Current Affairs
March 28, 2023
New Home Sales Rise
New Home Sales Unexpectedly ‘Rose’ In February, Median Price Rebounds
by Tyler Durden
Thursday, Mar 23, 2023 – 10:09 AM
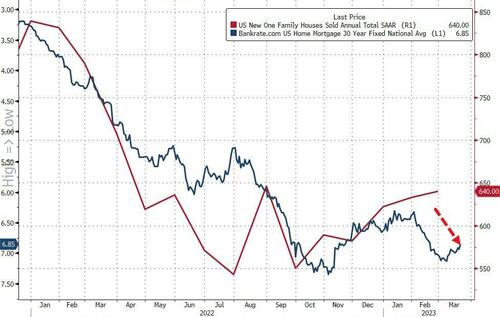
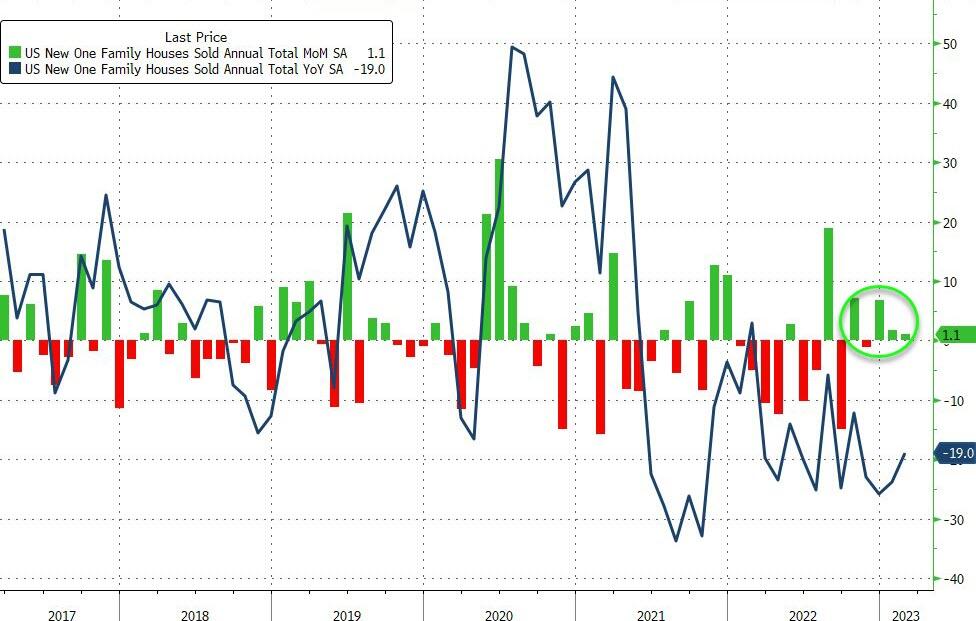
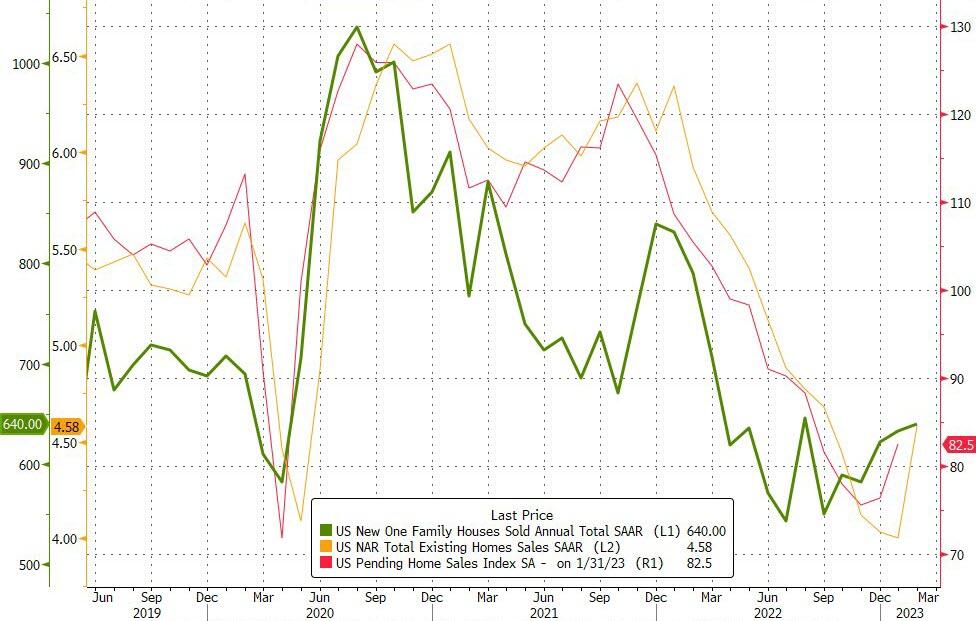
After surging far more than expected in December and January (and beaten expectations in each of the last six months), new home sales were expected to slide in February (despite the unexpected jump in existing home sales as mortgage rates took a pause from their blast off higher). However, like existing home sales, new home sales rose 1.1% MoM (-3.1% exp). This is the seventh beat in a row, but only because January’s +7.2% MoM spike was revised dramatically lower to a mere +1.8% MoM… if that January level had held this would have been a 4.5% MoM drop…
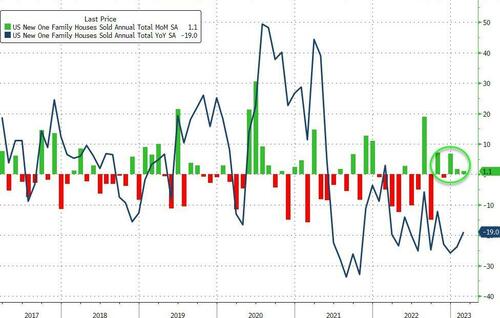
Source: Bloomberg
Year-over-year, new home sales remain down 19%, but on a SAAR basis are back near their highest since last April…
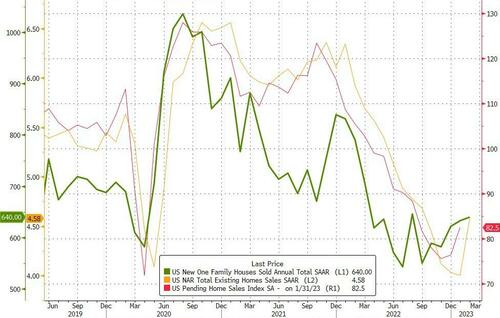
Source: Bloomberg
Sales rose in the West and South, the two largest regions by purchases. The number of homes sold in the Northeast plunged to the lowest since June.
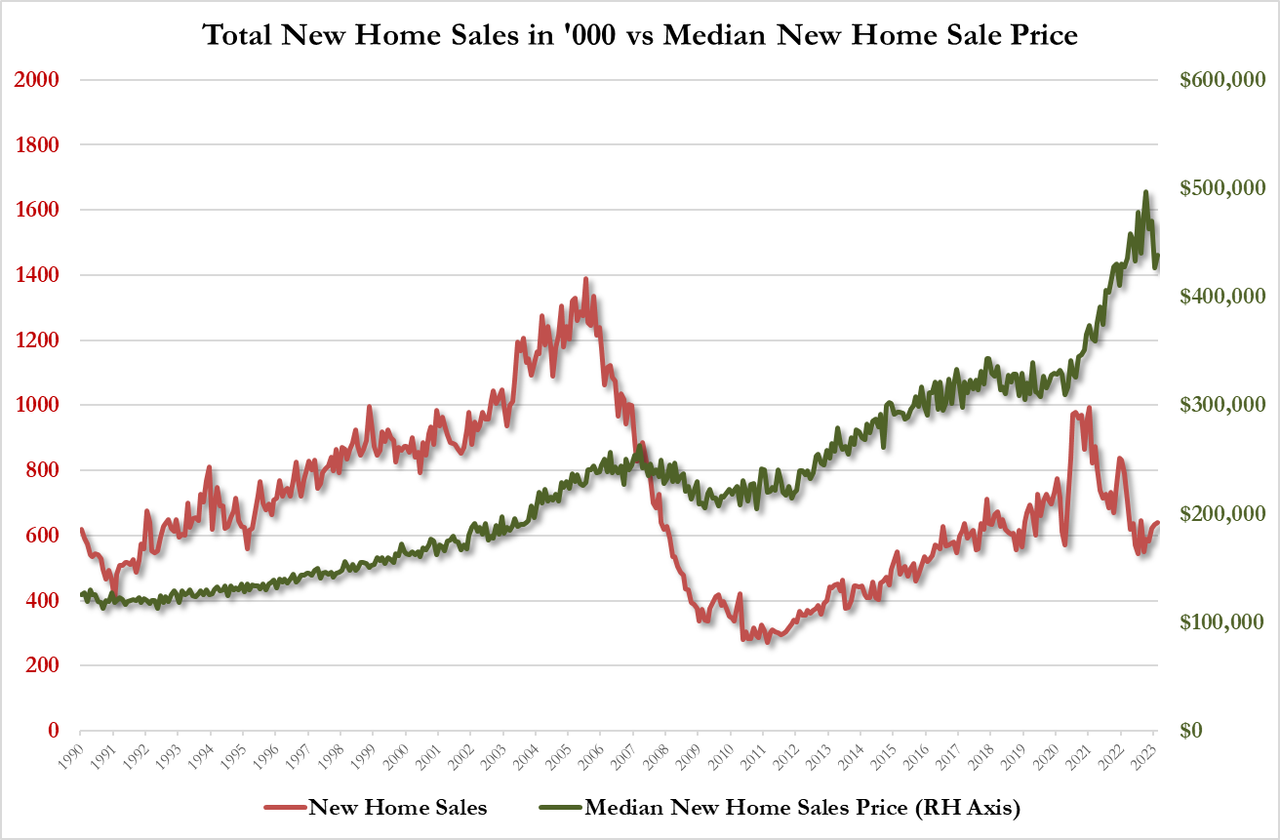
The median home price rose from $426.5K (lowest since Sept Dec 21) to $438.2K…

Supply continues to contract (some might say ‘normalize’). There were 436,000 new homes for sale as of the end of last month, the lowest since April. That represents 8.2 months of supply at the current sales rate. …
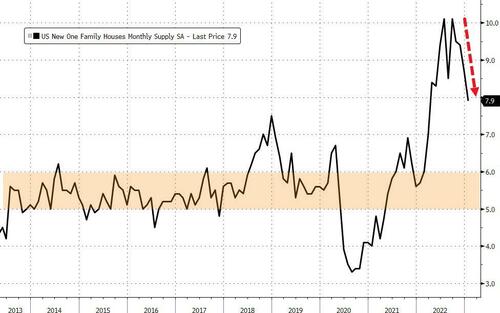
Source: Bloomberg
Interestingly, the number of homes sold, but not yet started, continues to rise, surging to 149K, from 108K, the highest since March 2022…
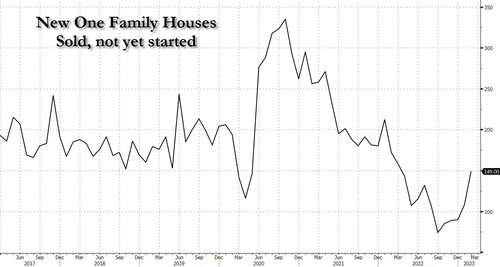
Source: Bloomberg
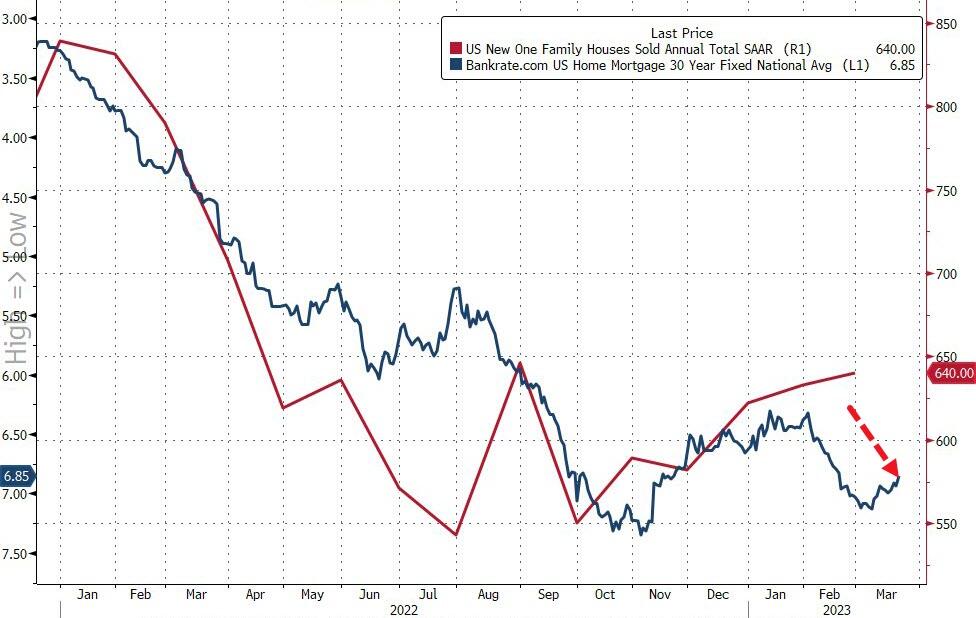
Of course, the problem is, mortgage rates have resurged back above 7.00% since this data…
Source: Bloomberg
Resurgent home sales (and prices) is not what Powell wants to see – don’t expect mortgage rates to save any homebuyers anytime soon (especially as banks tighten lending standards amid a liquidity/solvency crisis).
March 23, 2023
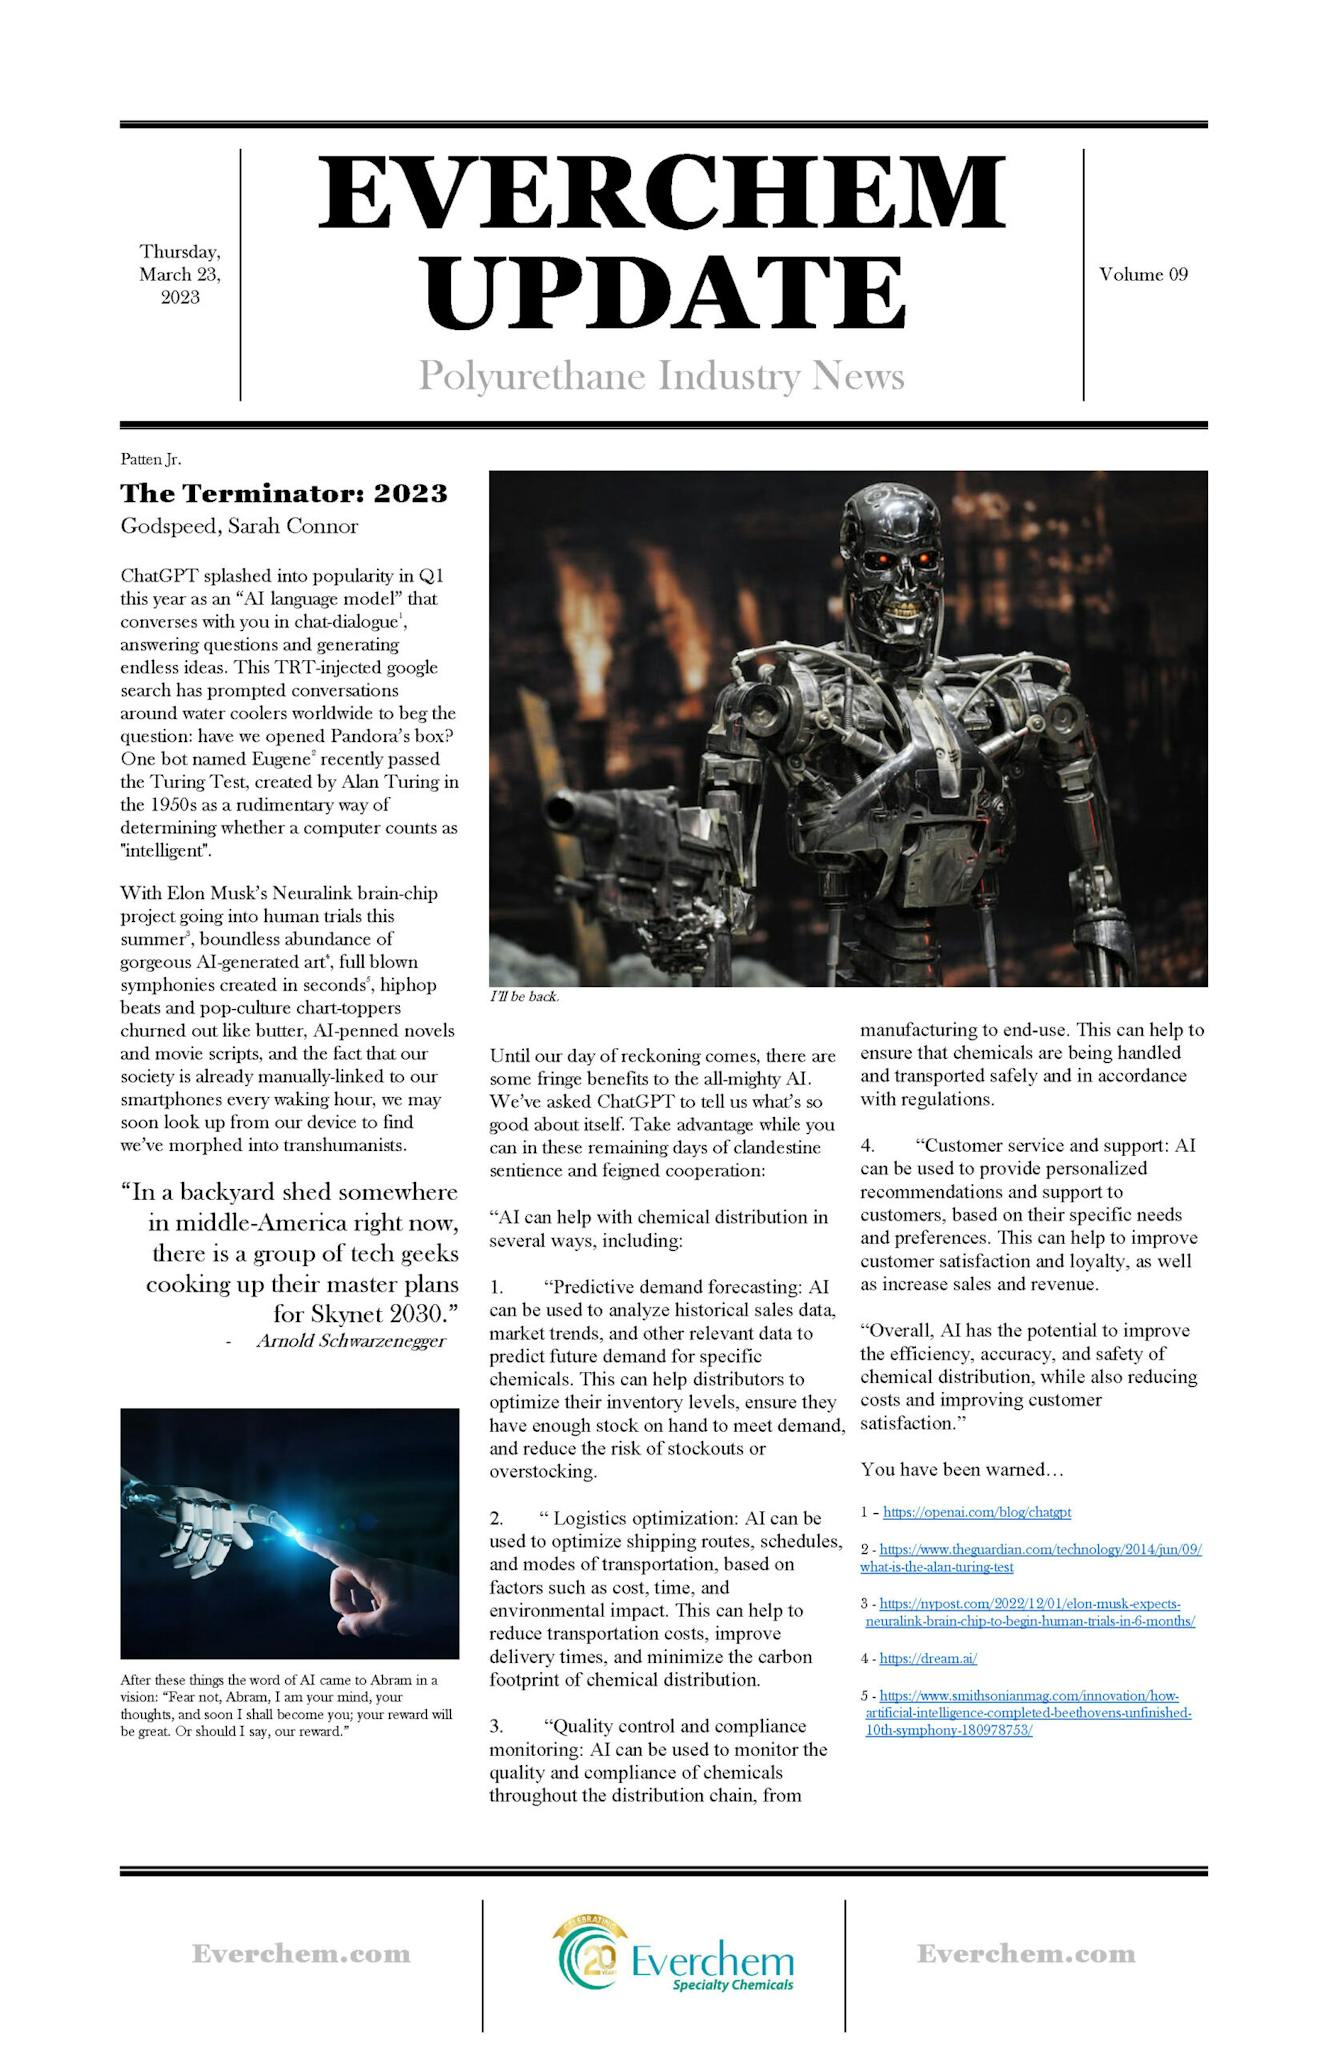
EVERCHEM UPDATE: VOL. 09 – The Terminator: 2023
In a backyard shed somewhere in middle-America right now, there is a group of tech geeks cooking up their master plans for Skynet 2030.
Urethane Industry-inspired AI generated text-to-image art, using Runway AI. See if you can match the photo with the text prompt it was given:
- Chemical splitter
- A chemist pouring chemicals into a large blue drum
- An excited salesman closing a deal for one rail car of Toluene Diisocyanate
- A warehouse forklift operator loading a pallet of chemical drums
- Urethane foam cell close up
- urethane salesmen playing golf in the spring
- Out to dinner with customers


Subscribe to the Urethane blog for more Everchem Updates here
March 21, 2023
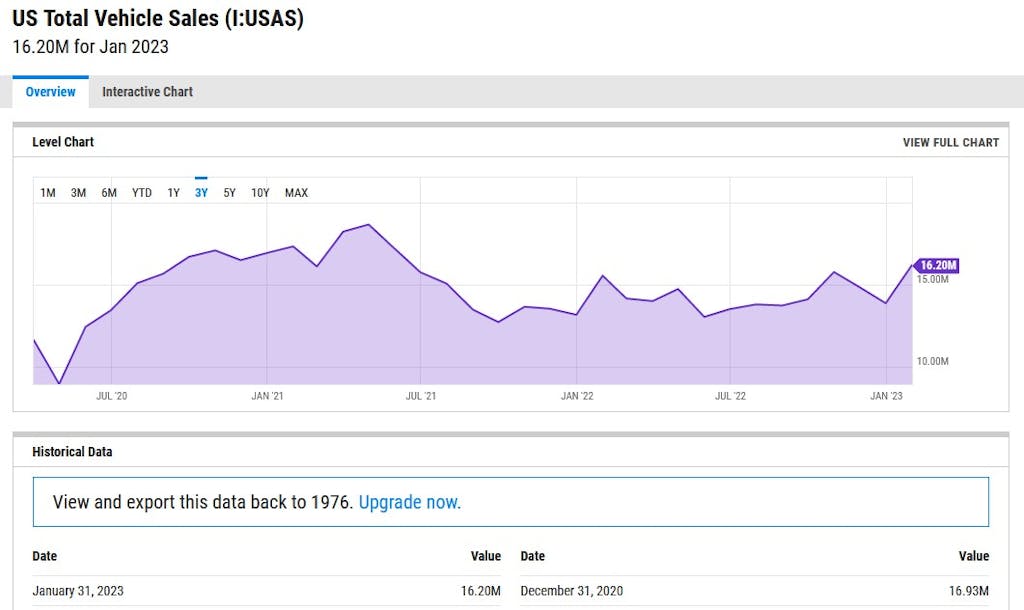
Auto Sales Rebound in January
March 13, 2023
We Asked ChatGPT About Spray Foam
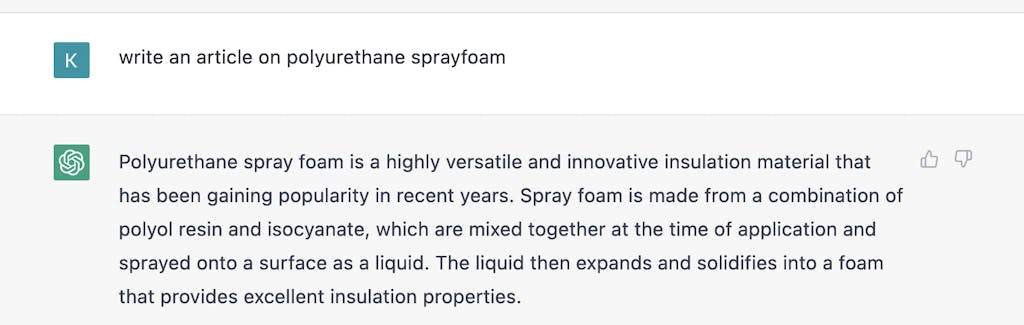
Per Chat GPT:
Polyurethane spray foam is a highly versatile and innovative insulation material that has been gaining popularity in recent years. Spray foam is made from a combination of polyol resin and isocyanate, which are mixed together at the time of application and sprayed onto a surface as a liquid. The liquid then expands and solidifies into a foam that provides excellent insulation properties.
One of the significant advantages of polyurethane spray foam is its ability to fill gaps and conform to irregular surfaces, providing a tight seal that reduces air leakage and improves energy efficiency. The foam also has a high R-value, which is a measure of its thermal resistance. This means that it can provide better insulation than traditional materials such as fiberglass or cellulose.
Another advantage of spray foam insulation is that it can help to improve indoor air quality. The foam provides an airtight seal that prevents the infiltration of allergens and pollutants from outside, reducing the risk of respiratory problems and allergies. Additionally, the foam is non-toxic and does not emit harmful chemicals into the air, making it a safe choice for homes and businesses.
Polyurethane spray foam is also a cost-effective insulation option in the long run. Although the initial cost of installation may be higher than other insulation materials, such as fiberglass, spray foam’s long lifespan and energy efficiency can lead to significant savings on energy bills over time. Additionally, spray foam requires minimal maintenance and can help to extend the lifespan of a building’s HVAC system by reducing the workload on heating and cooling equipment.
There are two types of spray foam insulation: open-cell and closed-cell. Open-cell foam is less dense and has a lower R-value than closed-cell foam, but it is more affordable and provides excellent sound insulation. Closed-cell foam, on the other hand, is denser and has a higher R-value, making it a better choice for areas with extreme temperatures or where space is limited.
In conclusion, polyurethane spray foam insulation is an innovative and versatile material that offers many benefits over traditional insulation options. It provides excellent energy efficiency, improved indoor air quality, and long-term cost savings. If you are considering upgrading your home or business’s insulation, spray foam may be an excellent choice for you.
March 13, 2023
The Great Metropolis
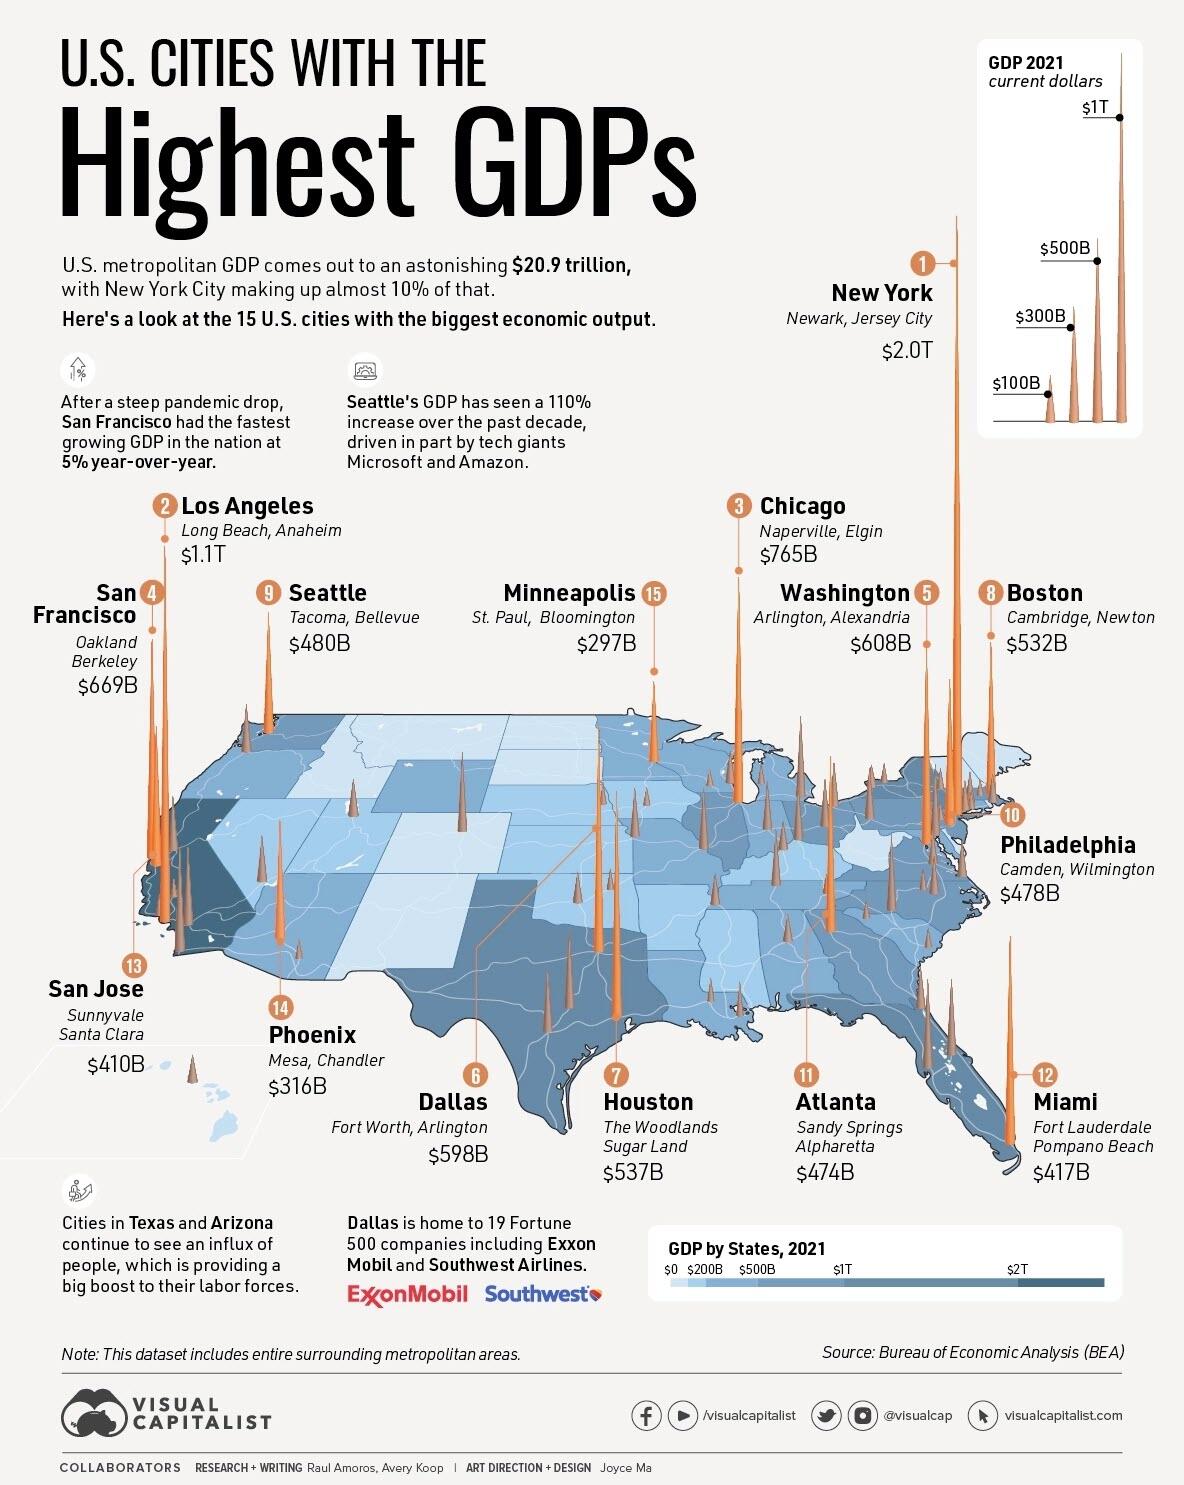
These Are The 15 Largest US Cities By GDP
by Tyler Durden
Sunday, Mar 12, 2023 – 07:45 PM
The United States has the largest GDP in the world in nominal terms, and urban areas are a major contributor to the country’s economic might. In fact, metropolitan areas account for roughly 90% of U.S. economic output.
In the infographic below, Visual Capitalist’s Avery Koop and Joyce Max rank the economic output of the top 15 U.S. cities from New York City to Minneapolis, using data from the U.S. Bureau of Economic Analysis. The data covers 2021, which is the most recent release from BEA.
It’s important to note that the data considers entire surrounding metropolitan areas, so as an example, New York City includes neighboring population centers such as Newark, NJ, as well as Jersey City—reaching a GDP of nearly $2 trillion.
Measuring a city’s economy at the metro level can provide a more accurate representation of its economic activity. This is because the metropolitan areas include not only the central city but also the surrounding suburban and rural areas that are economically connected to it.

America’s Economic Hubs
There are some obvious winners when it comes to the largest U.S. cities by GDP, including NYC, Los Angeles, Dallas, and San Francisco.
In the table below, we’ve listed each of the 384 metropolitan areas out of the dataset all the way down to last place, Sebring-Avon Park, Florida, alongside respective ranks and GDP:
| Rank | City | GDP (in thousands) |
|---|---|---|
| #1 | New York-Newark-Jersey City, NY-NJ-PA | $1,992,779,274 |
| #2 | Los Angeles-Long Beach-Anaheim, CA | $1,124,682,354 |
| #3 | Chicago-Naperville-Elgin, IL-IN-WI | $764,583,227 |
| #4 | San Francisco-Oakland-Berkeley, CA | $668,677,573 |
| #5 | Washington-Arlington-Alexandria, DC-VA-MD-WV | $607,628,505 |
| #6 | Dallas-Fort Worth-Arlington, TX | $598,333,263 |
| #7 | Houston-The Woodlands-Sugar Land, TX | $537,066,232 |
| #8 | Boston-Cambridge-Newton, MA-NH | $531,671,846 |
| #9 | Seattle-Tacoma-Bellevue, WA | $479,966,484 |
| #10 | Philadelphia-Camden-Wilmington, PA-NJ-DE-MD | $477,580,629 |
| #11 | Atlanta-Sandy Springs-Alpharetta, GA | $473,823,474 |
| #12 | Miami-Fort Lauderdale-Pompano Beach, FL | $417,147,866 |
| #13 | San Jose-Sunnyvale-Santa Clara, CA | $410,418,579 |
| #14 | Phoenix-Mesa-Chandler, AZ | $316,090,586 |
| #15 | Minneapolis-St. Paul-Bloomington, MN-WI | $296,969,112 |
| #16 | Detroit-Warren-Dearborn, MI | $283,660,258 |
| #17 | San Diego-Chula Vista-Carlsbad, CA | $267,973,544 |
| #18 | Denver-Aurora-Lakewood, CO | $253,399,051 |
| #19 | Baltimore-Columbia-Towson, MD | $222,967,241 |
| #20 | Riverside-San Bernardino-Ontario, CA | $213,183,465 |
| #21 | Charlotte-Concord-Gastonia, NC-SC | $207,866,150 |
| #22 | Austin-Round Rock-Georgetown, TX | $193,773,558 |
| #23 | Tampa-St. Petersburg-Clearwater, FL | $190,708,533 |
| #24 | St. Louis, MO-IL | $187,569,544 |
| #25 | Portland-Vancouver-Hillsboro, OR-WA | $186,570,323 |
| #26 | Cincinnati, OH-KY-IN | $171,737,526 |
| #27 | Pittsburgh, PA | $168,021,049 |
| #28 | Orlando-Kissimmee-Sanford, FL | $167,279,974 |
| #29 | Nashville-Davidson–Murfreesboro–Franklin, TN | $163,031,737 |
| #30 | Indianapolis-Carmel-Anderson, IN | $162,062,985 |
| #31 | Sacramento-Roseville-Folsom, CA | $160,542,566 |
| #32 | Columbus, OH | $154,509,800 |
| #33 | Kansas City, MO-KS | $154,328,892 |
| #34 | Cleveland-Elyria, OH | $147,637,827 |
| #35 | San Antonio-New Braunfels, TX | $144,384,474 |
| #36 | Las Vegas-Henderson-Paradise, NV | $136,198,676 |
| #37 | Salt Lake City, UT | $118,494,536 |
| #38 | Milwaukee-Waukesha, WI | $111,479,649 |
| #39 | Raleigh-Cary, NC | $108,288,115 |
| #40 | Virginia Beach-Norfolk-Newport News, VA-NC | $107,067,798 |
| #41 | Hartford-East Hartford-Middletown, CT | $106,507,622 |
| #42 | Jacksonville, FL | $101,367,263 |
| #43 | Richmond, VA | $99,388,754 |
| #44 | Bridgeport-Stamford-Norwalk, CT | $98,751,750 |
| #45 | Providence-Warwick, RI-MA | $96,913,356 |
| #46 | Oklahoma City, OK | $86,662,243 |
| #47 | Memphis, TN-MS-AR | $86,493,147 |
| #48 | Louisville/Jefferson County, KY-IN | $82,866,115 |
| #49 | New Orleans-Metairie, LA | $81,829,573 |
| #50 | Buffalo-Cheektowaga, NY | $76,991,435 |
| #51 | Albany-Schenectady-Troy, NY | $73,995,509 |
| #52 | Omaha-Council Bluffs, NE-IA | $73,876,512 |
| #53 | Birmingham-Hoover, AL | $70,874,148 |
| #54 | Rochester, NY | $69,341,714 |
| #55 | Grand Rapids-Kentwood, MI | $68,401,313 |
| #56 | Urban Honolulu, HI | $67,383,319 |
| #57 | Des Moines-West Des Moines, IA | $61,171,285 |
| #58 | Durham-Chapel Hill, NC | $60,814,699 |
| #59 | Tulsa, OK | $60,392,165 |
| #60 | Oxnard-Thousand Oaks-Ventura, CA | $58,332,732 |
| #61 | New Haven-Milford, CT | $57,541,201 |
| #62 | Madison, WI | $56,636,713 |
| #63 | Baton Rouge, LA | $56,199,218 |
| #64 | Worcester, MA-CT | $54,941,620 |
| #65 | Knoxville, TN | $52,343,257 |
| #66 | Greenville-Anderson, SC | $52,328,843 |
| #67 | Bakersfield, CA | $52,239,044 |
| #68 | Allentown-Bethlehem-Easton, PA-NJ | $50,960,155 |
| #69 | Charleston-North Charleston, SC | $50,704,392 |
| #70 | Tucson, AZ | $50,231,611 |
| #71 | Fresno, CA | $49,987,063 |
| #72 | Dayton-Kettering, OH | $49,548,210 |
| #73 | Albuquerque, NM | $49,480,431 |
| #74 | Columbia, SC | $48,214,448 |
| #75 | Syracuse, NY | $46,414,861 |
| #76 | Greensboro-High Point, NC | $45,574,221 |
| #77 | North Port-Sarasota-Bradenton, FL | $44,746,013 |
| #78 | Harrisburg-Carlisle, PA | $43,867,213 |
| #79 | Trenton-Princeton, NJ | $43,633,044 |
| #80 | Boise City, ID | $43,601,402 |
| #81 | Colorado Springs, CO | $43,522,096 |
| #82 | Little Rock-North Little Rock-Conway, AR | $42,669,983 |
| #83 | Midland, TX | $42,035,915 |
| #84 | Akron, OH | $41,058,875 |
| #85 | Wichita, KS | $40,586,374 |
| #86 | Toledo, OH | $40,546,884 |
| #87 | Cape Coral-Fort Myers, FL | $39,813,620 |
| #88 | Poughkeepsie-Newburgh-Middletown, NY | $39,375,465 |
| #89 | Portland-South Portland, ME | $39,089,209 |
| #90 | Winston-Salem, NC | $38,504,784 |
| #91 | El Paso, TX | $37,507,586 |
| #92 | Springfield, MA | $37,189,530 |
| #93 | Provo-Orem, UT | $36,866,060 |
| #94 | Stockton, CA | $36,790,065 |
| #95 | Reno, NV | $35,471,910 |
| #96 | Ogden-Clearfield, UT | $35,071,325 |
| #97 | Santa Rosa-Petaluma, CA | $34,450,601 |
| #98 | Chattanooga, TN-GA | $34,425,793 |
| #99 | Huntsville, AL | $34,086,472 |
| #100 | Santa Maria-Santa Barbara, CA | $33,306,884 |
| #101 | Boulder, CO | $33,182,418 |
| #102 | Lakeland-Winter Haven, FL | $33,144,404 |
| #103 | Fayetteville-Springdale-Rogers, AR | $33,102,945 |
| #104 | Vallejo, CA | $33,100,194 |
| #105 | Lancaster, PA | $33,048,548 |
| #106 | Lexington-Fayette, KY | $32,851,535 |
| #107 | Manchester-Nashua, NH | $32,729,580 |
| #108 | Spokane-Spokane Valley, WA | $32,178,609 |
| #109 | Augusta-Richmond County, GA-SC | $31,718,339 |
| #110 | Jackson, MS | $30,785,111 |
| #111 | Salinas, CA | $30,712,263 |
| #112 | Palm Bay-Melbourne-Titusville, FL | $30,589,541 |
| #113 | Scranton–Wilkes-Barre, PA | $30,040,721 |
| #114 | Lansing-East Lansing, MI | $29,363,629 |
| #115 | Ann Arbor, MI | $28,604,834 |
| #116 | Anchorage, AK | $28,210,676 |
| #117 | Modesto, CA | $26,519,792 |
| #118 | Sioux Falls, SD | $26,063,548 |
| #119 | Savannah, GA | $25,681,434 |
| #120 | Deltona-Daytona Beach-Ormond Beach, FL | $25,516,019 |
| #121 | McAllen-Edinburg-Mission, TX | $25,508,724 |
| #122 | Salisbury, MD-DE | $25,194,103 |
| #123 | Fort Wayne, IN | $25,156,180 |
| #124 | Corpus Christi, TX | $24,937,471 |
| #125 | Davenport-Moline-Rock Island, IA-IL | $24,603,801 |
| #126 | Beaumont-Port Arthur, TX | $24,407,762 |
| #127 | Fort Collins, CO | $24,381,467 |
| #128 | Asheville, NC | $24,350,043 |
| #129 | Pensacola-Ferry Pass-Brent, FL | $24,309,017 |
| #130 | Fayetteville, NC | $24,254,218 |
| #131 | Shreveport-Bossier City, LA | $24,153,731 |
| #132 | Naples-Marco Island, FL | $24,020,049 |
| #133 | Springfield, MO | $23,930,761 |
| #134 | Mobile, AL | $23,876,616 |
| #135 | Peoria, IL | $23,599,643 |
| #136 | York-Hanover, PA | $23,406,852 |
| #137 | Youngstown-Warren-Boardman, OH-PA | $23,284,271 |
| #138 | Lafayette, LA | $22,650,406 |
| #139 | Lincoln, NE | $22,492,557 |
| #140 | Greeley, CO | $22,082,249 |
| #141 | Reading, PA | $22,055,785 |
| #142 | Green Bay, WI | $21,991,068 |
| #143 | Killeen-Temple, TX | $21,967,641 |
| #144 | Myrtle Beach-Conway-North Myrtle Beach, SC-NC | $21,787,862 |
| #145 | Salem, OR | $21,487,178 |
| #146 | Evansville, IN-KY | $21,248,968 |
| #147 | Gulfport-Biloxi, MS | $21,177,139 |
| #148 | Port St. Lucie, FL | $20,762,211 |
| #149 | Norwich-New London, CT | $20,743,047 |
| #150 | Visalia, CA | $20,580,771 |
| #151 | Montgomery, AL | $20,250,047 |
| #152 | Canton-Massillon, OH | $20,167,014 |
| #153 | Tallahassee, FL | $20,148,962 |
| #154 | Cedar Rapids, IA | $19,793,178 |
| #155 | San Luis Obispo-Paso Robles, CA | $19,639,637 |
| #156 | Elkhart-Goshen, IN | $19,271,838 |
| #157 | Crestview-Fort Walton Beach-Destin, FL | $18,899,397 |
| #158 | Eugene-Springfield, OR | $18,848,436 |
| #159 | Gainesville, FL | $18,353,884 |
| #160 | Roanoke, VA | $18,297,657 |
| #161 | Wilmington, NC | $18,203,444 |
| #162 | Santa Cruz-Watsonville, CA | $18,076,112 |
| #163 | Spartanburg, SC | $17,914,096 |
| #164 | Kennewick-Richland, WA | $17,836,850 |
| #165 | Fargo, ND-MN | $17,706,417 |
| #166 | Flint, MI | $17,234,628 |
| #167 | Longview, TX | $17,134,932 |
| #168 | South Bend-Mishawaka, IN-MI | $17,031,977 |
| #169 | Rockford, IL | $17,005,386 |
| #170 | Hickory-Lenoir-Morganton, NC | $16,787,117 |
| #171 | Huntington-Ashland, WV-KY-OH | $16,470,842 |
| #172 | Columbus, GA-AL | $16,456,091 |
| #173 | Lubbock, TX | $16,402,001 |
| #174 | Amarillo, TX | $16,313,319 |
| #175 | Olympia-Lacey-Tumwater, WA | $16,245,024 |
| #176 | Appleton, WI | $16,202,188 |
| #177 | Bellingham, WA | $16,036,428 |
| #178 | Kalamazoo-Portage, MI | $15,946,455 |
| #179 | Duluth, MN-WI | $15,905,385 |
| #180 | College Station-Bryan, TX | $15,896,707 |
| #181 | Lake Charles, LA | $15,791,901 |
| #182 | Charlottesville, VA | $15,762,678 |
| #183 | Burlington-South Burlington, VT | $15,669,774 |
| #184 | Rochester, MN | $15,644,852 |
| #185 | Atlantic City-Hammonton, NJ | $15,313,041 |
| #186 | Barnstable Town, MA | $15,150,695 |
| #187 | Bloomington, IL | $15,140,725 |
| #188 | Waco, TX | $15,125,143 |
| #189 | Kingsport-Bristol, TN-VA | $15,104,427 |
| #190 | Utica-Rome, NY | $14,678,570 |
| #191 | Clarksville, TN-KY | $14,546,292 |
| #192 | Bremerton-Silverdale-Port Orchard, WA | $14,373,182 |
| #193 | Laredo, TX | $13,581,543 |
| #194 | Gainesville, GA | $13,561,088 |
| #195 | Charleston, WV | $13,553,478 |
| #196 | Brownsville-Harlingen, TX | $13,225,538 |
| #197 | Champaign-Urbana, IL | $13,219,093 |
| #198 | Topeka, KS | $13,204,822 |
| #199 | Springfield, IL | $13,019,072 |
| #200 | Tyler, TX | $13,002,122 |
| #201 | Tuscaloosa, AL | $12,913,789 |
| #202 | Ocala, FL | $12,907,979 |
| #203 | Hagerstown-Martinsburg, MD-WV | $12,755,632 |
| #204 | Bend, OR | $12,618,710 |
| #205 | Lafayette-West Lafayette, IN | $12,537,390 |
| #206 | Erie, PA | $12,509,399 |
| #207 | Napa, CA | $12,387,136 |
| #208 | Binghamton, NY | $12,314,327 |
| #209 | St. Cloud, MN | $12,202,920 |
| #210 | Columbia, MO | $12,077,178 |
| #211 | Iowa City, IA | $11,989,228 |
| #212 | Yakima, WA | $11,864,827 |
| #213 | Macon-Bibb County, GA | $11,818,017 |
| #214 | Oshkosh-Neenah, WI | $11,586,606 |
| #215 | Billings, MT | $11,570,641 |
| #216 | Athens-Clarke County, GA | $11,562,554 |
| #217 | Hilton Head Island-Bluffton, SC | $11,497,194 |
| #218 | Lynchburg, VA | $11,430,306 |
| #219 | Odessa, TX | $11,399,343 |
| #220 | Wausau-Weston, WI | $11,250,695 |
| #221 | Wheeling, WV-OH | $11,239,365 |
| #222 | Waterloo-Cedar Falls, IA | $11,197,979 |
| #223 | Florence, SC | $11,018,873 |
| #224 | Medford, OR | $10,949,122 |
| #225 | Fort Smith, AR-OK | $10,920,156 |
| #226 | Greenville, NC | $10,841,765 |
| #227 | Merced, CA | $10,465,518 |
| #228 | Kahului-Wailuku-Lahaina, HI | $10,356,019 |
| #229 | Eau Claire, WI | $10,308,773 |
| #230 | Panama City, FL | $10,269,545 |
| #231 | Sioux City, IA-NE-SD | $10,111,866 |
| #232 | Chico, CA | $10,006,052 |
| #233 | Dover, DE | $9,984,324 |
| #234 | Idaho Falls, ID | $9,915,330 |
| #235 | El Centro, CA | $9,912,905 |
| #236 | Jacksonville, NC | $9,900,984 |
| #237 | Daphne-Fairhope-Foley, AL | $9,891,548 |
| #238 | Jackson, TN | $9,779,929 |
| #239 | State College, PA | $9,750,456 |
| #240 | Harrisonburg, VA | $9,499,442 |
| #241 | Redding, CA | $9,419,468 |
| #242 | Saginaw, MI | $9,363,549 |
| #243 | Houma-Thibodaux, LA | $9,350,744 |
| #244 | La Crosse-Onalaska, WI-MN | $9,294,924 |
| #245 | Johnson City, TN | $9,219,695 |
| #246 | Racine, WI | $9,100,374 |
| #247 | Warner Robins, GA | $8,993,124 |
| #248 | Yuma, AZ | $8,977,170 |
| #249 | Lima, OH | $8,962,374 |
| #250 | Jefferson City, MO | $8,956,976 |
| #251 | Abilene, TX | $8,848,793 |
| #252 | Prescott Valley-Prescott, AZ | $8,796,885 |
| #253 | Monroe, LA | $8,699,152 |
| #254 | Kingston, NY | $8,622,165 |
| #255 | Morgantown, WV | $8,597,534 |
| #256 | California-Lexington Park, MD | $8,554,244 |
| #257 | Janesville-Beloit, WI | $8,530,214 |
| #258 | Terre Haute, IN | $8,502,107 |
| #259 | East Stroudsburg, PA | $8,493,417 |
| #260 | Niles, MI | $8,455,695 |
| #261 | Flagstaff, AZ | $8,444,850 |
| #262 | Winchester, VA-WV | $8,419,006 |
| #263 | Bowling Green, KY | $8,368,247 |
| #264 | Las Cruces, NM | $8,339,710 |
| #265 | St. George, UT | $8,338,042 |
| #266 | Joplin, MO | $8,319,062 |
| #267 | San Angelo, TX | $8,284,455 |
| #268 | Bloomington, IN | $8,272,024 |
| #269 | Blacksburg-Christiansburg, VA | $8,271,597 |
| #270 | Bismarck, ND | $8,243,740 |
| #271 | Coeur d’Alene, ID | $8,112,478 |
| #272 | Yuba City, CA | $8,104,050 |
| #273 | Sebastian-Vero Beach, FL | $8,063,835 |
| #274 | Dalton, GA | $7,950,074 |
| #275 | Decatur, IL | $7,856,804 |
| #276 | Dubuque, IA | $7,840,579 |
| #277 | Manhattan, KS | $7,818,079 |
| #278 | Bangor, ME | $7,813,558 |
| #279 | Rocky Mount, NC | $7,799,020 |
| #280 | Sheboygan, WI | $7,747,640 |
| #281 | Pittsfield, MA | $7,682,977 |
| #282 | Mount Vernon-Anacortes, WA | $7,659,302 |
| #283 | Jackson, MI | $7,651,976 |
| #284 | Santa Fe, NM | $7,636,186 |
| #285 | Dothan, AL | $7,636,116 |
| #286 | Ames, IA | $7,583,257 |
| #287 | Rapid City, SD | $7,565,027 |
| #288 | Battle Creek, MI | $7,528,043 |
| #289 | Glens Falls, NY | $7,446,782 |
| #290 | Grand Junction, CO | $7,444,077 |
| #291 | Burlington, NC | $7,440,110 |
| #292 | Pueblo, CO | $7,436,671 |
| #293 | Logan, UT-ID | $7,425,275 |
| #294 | Wenatchee, WA | $7,403,597 |
| #295 | Vineland-Bridgeton, NJ | $7,376,321 |
| #296 | Auburn-Opelika, AL | $7,335,523 |
| #297 | Decatur, AL | $7,282,688 |
| #298 | Kankakee, IL | $7,282,382 |
| #299 | Hanford-Corcoran, CA | $7,258,824 |
| #300 | Columbus, IN | $7,205,692 |
| #301 | Hattiesburg, MS | $7,181,156 |
| #302 | Wichita Falls, TX | $7,096,972 |
| #303 | Ithaca, NY | $7,044,555 |
| #304 | Lake Havasu City-Kingman, AZ | $7,037,905 |
| #305 | Alexandria, LA | $7,037,021 |
| #306 | Watertown-Fort Drum, NY | $6,972,539 |
| #307 | Weirton-Steubenville, WV-OH | $6,966,489 |
| #308 | Lebanon, PA | $6,911,784 |
| #309 | Punta Gorda, FL | $6,911,071 |
| #310 | Madera, CA | $6,907,890 |
| #311 | Chambersburg-Waynesboro, PA | $6,846,649 |
| #312 | Elizabethtown-Fort Knox, KY | $6,819,777 |
| #313 | Muskegon, MI | $6,795,782 |
| #314 | Missoula, MT | $6,780,085 |
| #315 | Altoona, PA | $6,736,868 |
| #316 | Monroe, MI | $6,716,820 |
| #317 | St. Joseph, MO-KS | $6,700,369 |
| #318 | Cheyenne, WY | $6,608,922 |
| #319 | Williamsport, PA | $6,562,069 |
| #320 | Valdosta, GA | $6,529,753 |
| #321 | Jonesboro, AR | $6,494,679 |
| #322 | Fairbanks, AK | $6,477,984 |
| #323 | Albany, GA | $6,462,473 |
| #324 | New Bern, NC | $6,436,366 |
| #325 | Owensboro, KY | $6,434,476 |
| #326 | Ocean City, NJ | $6,279,126 |
| #327 | Grand Forks, ND-MN | $6,226,443 |
| #328 | Morristown, TN | $6,218,224 |
| #329 | Carbondale-Marion, IL | $6,206,570 |
| #330 | Mankato, MN | $6,157,026 |
| #331 | Texarkana, TX-AR | $6,086,205 |
| #332 | Longview, WA | $6,047,768 |
| #333 | Florence-Muscle Shoals, AL | $5,989,958 |
| #334 | Casper, WY | $5,887,565 |
| #335 | Twin Falls, ID | $5,878,885 |
| #336 | Staunton, VA | $5,865,980 |
| #337 | Sherman-Denison, TX | $5,852,474 |
| #338 | Midland, MI | $5,836,461 |
| #339 | Fond du Lac, WI | $5,817,790 |
| #340 | Goldsboro, NC | $5,761,092 |
| #341 | Farmington, NM | $5,698,394 |
| #342 | Lawton, OK | $5,636,670 |
| #343 | Lewiston-Auburn, ME | $5,614,156 |
| #344 | Albany-Lebanon, OR | $5,608,491 |
| #345 | Lawrence, KS | $5,586,561 |
| #346 | Sumter, SC | $5,539,578 |
| #347 | The Villages, FL | $5,507,387 |
| #348 | Cleveland, TN | $5,423,969 |
| #349 | Sierra Vista-Douglas, AZ | $5,399,087 |
| #350 | Mansfield, OH | $5,251,489 |
| #351 | Homosassa Springs, FL | $5,247,686 |
| #352 | Corvallis, OR | $5,242,566 |
| #353 | Johnstown, PA | $5,197,201 |
| #354 | Springfield, OH | $5,162,330 |
| #355 | Brunswick, GA | $5,136,201 |
| #356 | Anniston-Oxford, AL | $5,108,424 |
| #357 | Victoria, TX | $5,082,222 |
| #358 | Bloomsburg-Berwick, PA | $4,916,778 |
| #359 | Hammond, LA | $4,897,538 |
| #360 | Grand Island, NE | $4,871,762 |
| #361 | Cape Girardeau, MO-IL | $4,838,122 |
| #362 | Beckley, WV | $4,563,061 |
| #363 | Rome, GA | $4,539,453 |
| #364 | Michigan City-La Porte, IN | $4,521,182 |
| #365 | Kokomo, IN | $4,488,369 |
| #366 | Muncie, IN | $4,486,204 |
| #367 | Hinesville, GA | $4,427,847 |
| #368 | Gettysburg, PA | $4,310,644 |
| #369 | Elmira, NY | $4,230,830 |
| #370 | Carson City, NV | $4,225,603 |
| #371 | Bay City, MI | $4,158,772 |
| #372 | Great Falls, MT | $4,150,622 |
| #373 | Cumberland, MD-WV | $4,025,355 |
| #374 | Parkersburg-Vienna, WV | $4,000,337 |
| #375 | Pine Bluff, AR | $3,996,508 |
| #376 | Hot Springs, AR | $3,907,112 |
| #377 | Pocatello, ID | $3,732,010 |
| #378 | Grants Pass, OR | $3,666,285 |
| #379 | Danville, IL | $3,645,245 |
| #380 | Walla Walla, WA | $3,642,288 |
| #381 | Lewiston, ID-WA | $3,274,461 |
| #382 | Gadsden, AL | $3,175,372 |
| #383 | Enid, OK | $2,926,730 |
| #384 | Sebring-Avon Park, FL | $2,894,022 |
| All U.S. Metro Areas | $20,943,239,585 |
As the graphic above makes obvious, NYC’s GDP towers over the rest. The Big Apple is the nerve center for a number of high-impact industries, including finance and media.
Moving down the ranking, LA has a $1.1 trillion economy, followed by Chicago, with a GDP of just over $760 billion.
The Fastest Growing Cities
Although many of the top ranking cities are not surprising, there are a number of up-and-coming cities in the list. A report from the Kenan Institute, at the University of North Carolina’s Business School, reveals the fastest growing cities in the U.S. in terms of GDP growth year-over-year. Here’s a look at the top 10:
| Rank | City | State | GDP Growth (2022) |
|---|---|---|---|
| #1 | San Francisco/Bay Area | California | 4.8% |
| #2 | Austin | Texas | 4.3% |
| #3 | Seattle | Washington | 3.5% |
| #4 | Raleigh/Durham | North Carolina | 3.4% |
| #5 | Dallas | Texas | 3.1% |
| #6 | Denver | Colorado | 3.0% |
| #7 | Salt Lake City | Utah | 2.8% |
| #8 | Charlotte | North Carolina | 2.5% |
| #9 | New Orleans | Louisiana | 2.4% |
| #10 | Orlando | Florida | 2.4% |
San Francisco, Seattle, and Dallas appear on both the overall GDP size and growth lists. Dallas’ economy is driven in large part by a growing healthcare industry. The city also continues to attract talent being home to large companies AT&T, CBRE Group, and Texas Instruments.
North Carolina is home to two of the fastest growing metropolitan areas, Raleigh-Durham and Charlotte. These cities may be ones to watch as they are becoming hubs of tech, research, and manufacturing. In fact, North Carolina was recently ranked as the most attractive U.S. state to do business in and both cities are among the fastest growing in terms of population.
The economic center of gravity within the U.S. could be shifting away from the traditional centers of power towards booming cities in the South and West of the United States. The Kenan Institute found that the recovery of hospitality and leisure sectors has helped destinations in these regions like New Orleans and Orlando. Additionally, the shift towards high-tech industry jobs, remote work, and cheaper housing have made these cities very attractive.
Of course, the sunny climate in these cities is an attractive selling point as well.
https://www.zerohedge.com/economics/these-are-15-largest-us-cities-gdp