Current Affairs
January 17, 2023
Freight Market Improving
High-frequency truckload data suggests the freight market is stabilizing
Craig Fuller, CEO at FreightWaves
· Monday, January 16, 2023

Listen to this article
0:00 / 2:30BeyondWords
Did the first quarter lull come early, in November and December of 2022?
For carriers, the first quarter is always the most difficult period in the annual freight calendar, when retailers clear their excess holiday inventory, construction takes a pause for the frigid weather and everything is gloomy and cold. The soft first quarter often follows a robust fourth quarter, in which freight companies enjoy the annual peak season and make an outsized portion of their profits. Carriers look forward to spring for some market stability and potential market accelerations.
Is it possible that winter came early this year? Did the freight winter start in November and now we are experiencing an early thaw?
Early freight data and channel checks would suggest the freight market could be stabilizing and clearer skies are ahead.
Over the past week, we’ve spoken with numerous freight executives who have mentioned that the first two weeks of the first quarter are shaping up better than expected, granted, expectations were incredibly low after such a weak peak.
Going into the quarter, executives we spoke with predicted a significant collapse in freight for the first quarter, with a seasoned veteran executive of a large trucking technology firm predicting that the first quarter would be the worst in his four-decade career. It was a fair bet considering how challenging the second half of the 2022 was for most in the freight market.
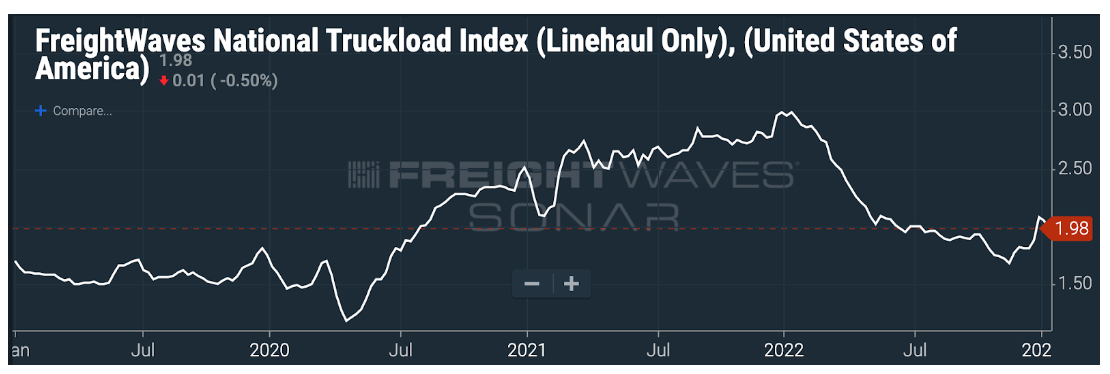
Truckload spot rates, according to the FreightWaves National Truckload Index, hit a low of $1.67 on Nov. 17, 2022, and have since bounced back to $1.98 per mile.
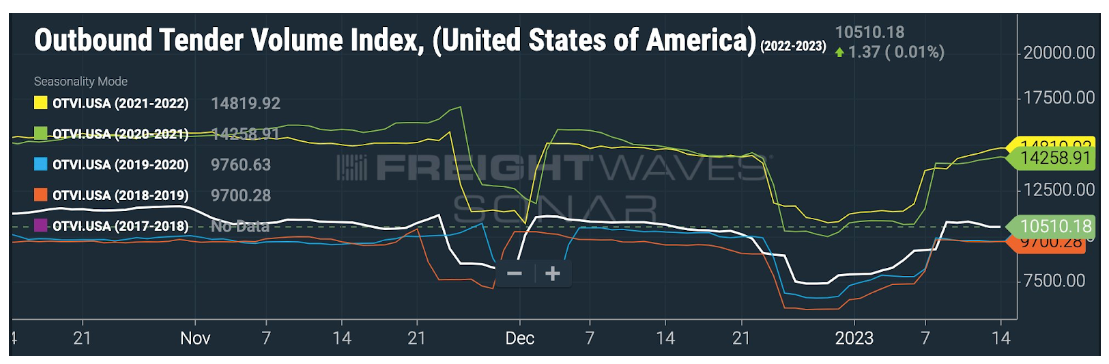
Trucking tender volumes also suggest that the direst of predictions have not played out. Tender volumes on the Outbound Tender Volume Index (OTVI), an index that tracks the volumes of load requests from shippers to carriers, show that volumes briefly dipped below 2019 and 2020 levels, but they have since broken away from this baseline.
If the first few weeks of the new year are an early omen, then the freight market may have bottomed in the fourth quarter and carriers can look forward to a far less volatile market in 2023.
Interested in being the first to know about the changes in the global freight market so that you can prepare your business for market changes before your competitors? All of the data in this article is available via subscription to SONAR, the world’s leading high-frequency data platform.
January 14, 2023
Fun For The Weekend
These Are North America’s Biggest Sources Of Electricity By State And Province
by Tyler Durden
Friday, Jan 13, 2023 – 08:40 PM
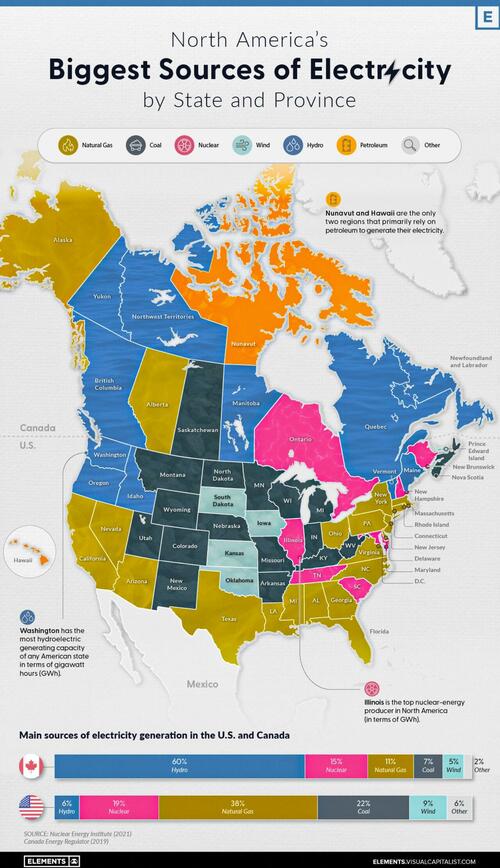
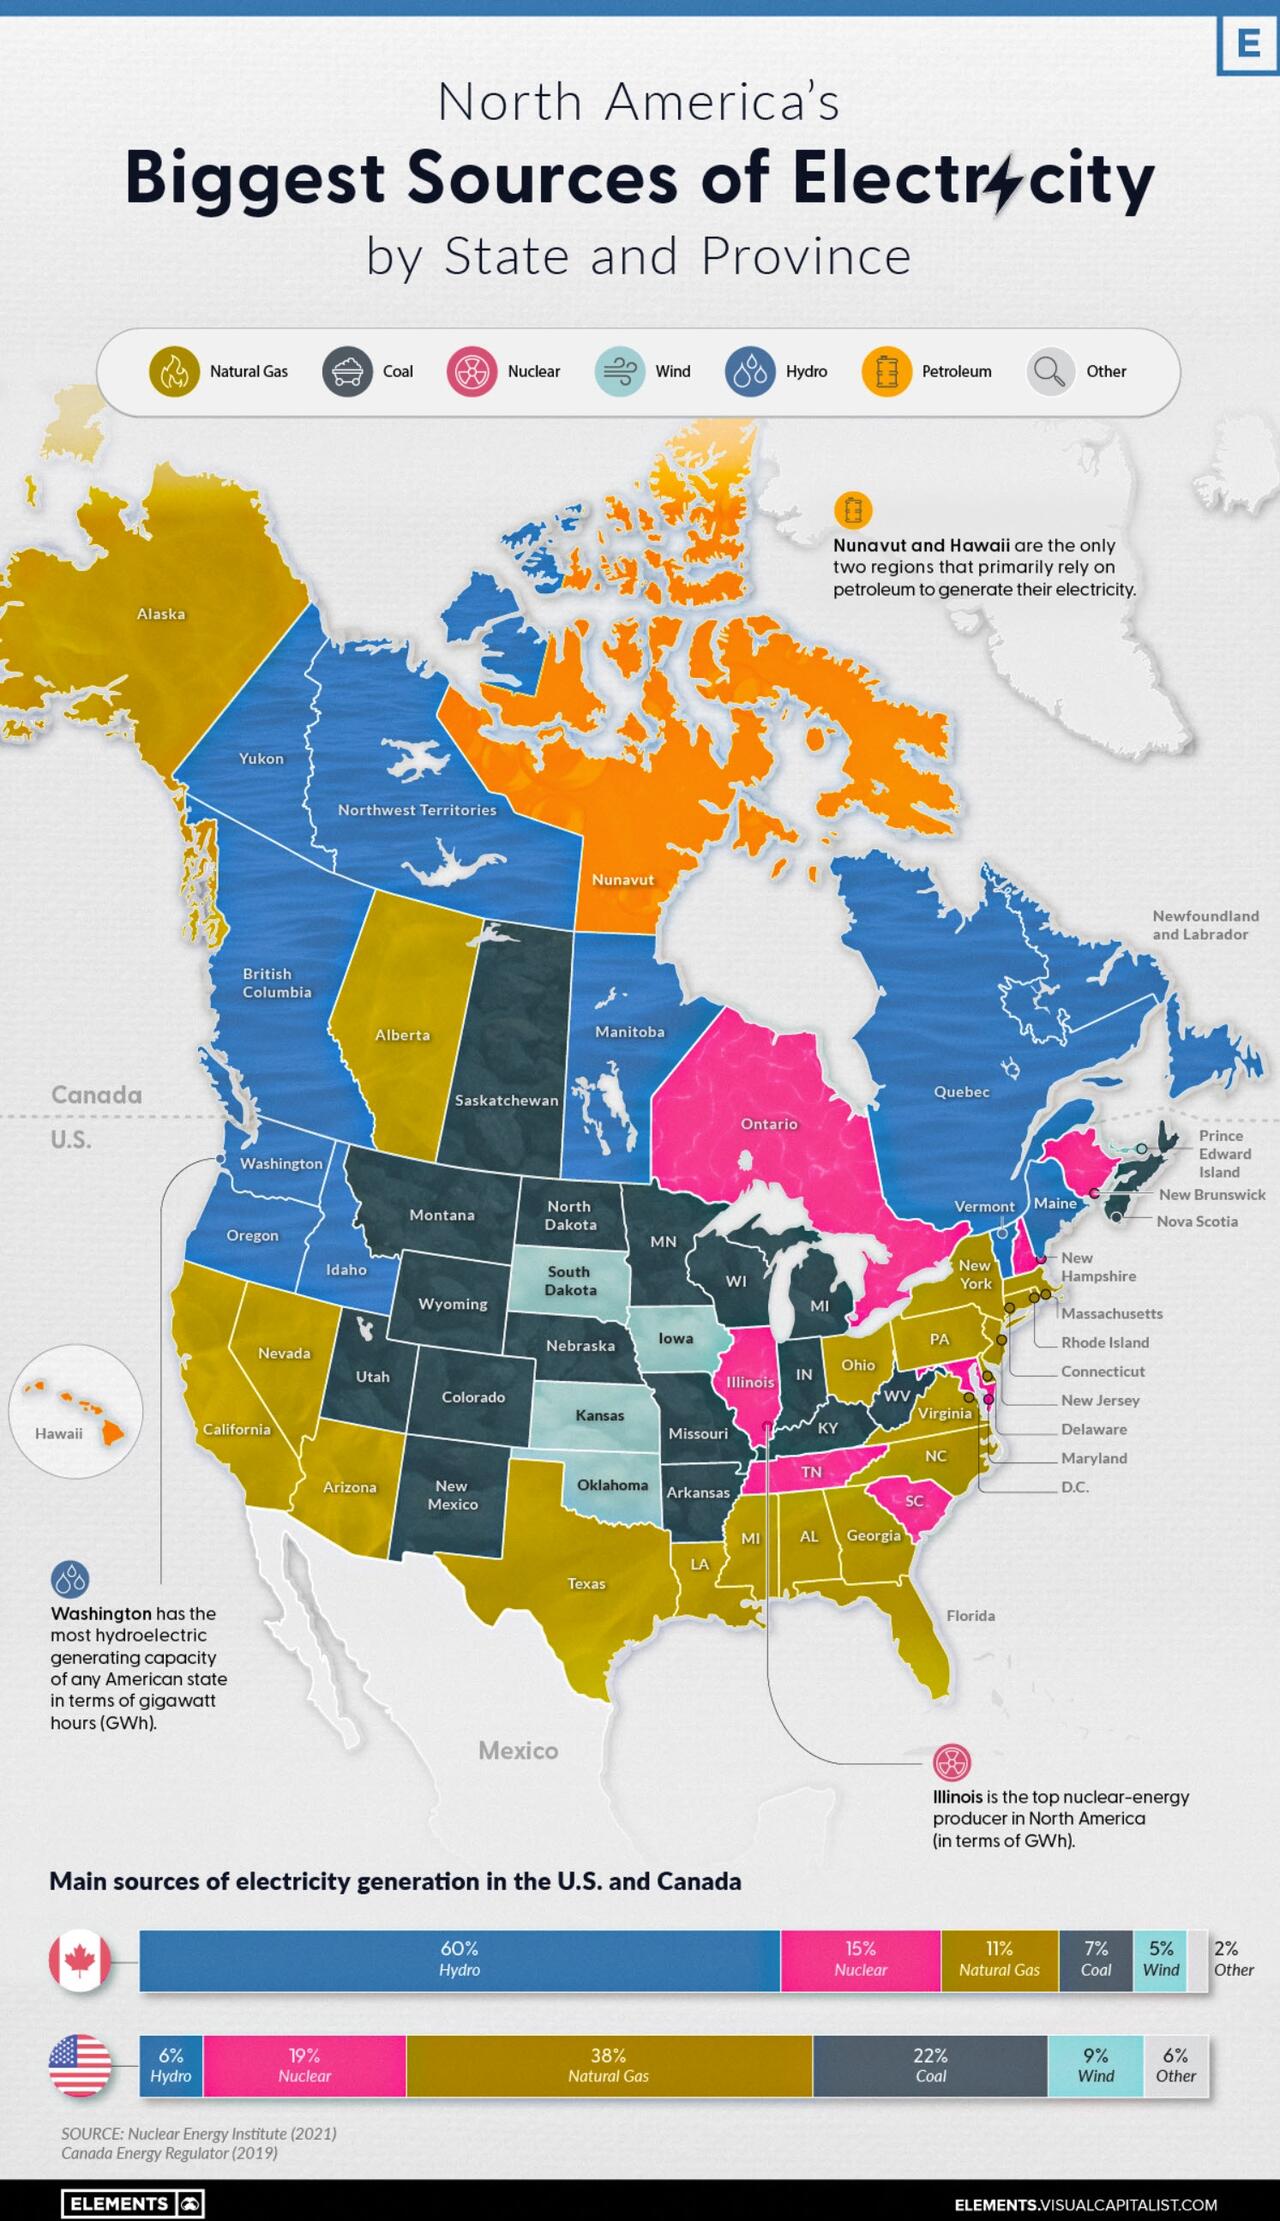
On a national scale, the United States and Canada rely on a very different makeup of sources to generate their electricity.
The U.S. primarily uses natural gas, coal, and nuclear power, while Canada relies on both hydro and nuclear. That said, when zooming in on the province or state level, individual primary electricity sources can differ greatly.
In the infographic below, Visual Capitalist’s Selin Oğuz takes a look at the electricity generation in the states and provinces of these two countries using data from the Nuclear Energy Institute (2021) and the Canada Energy Regulator (2019).
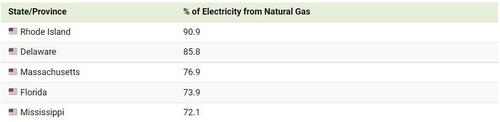
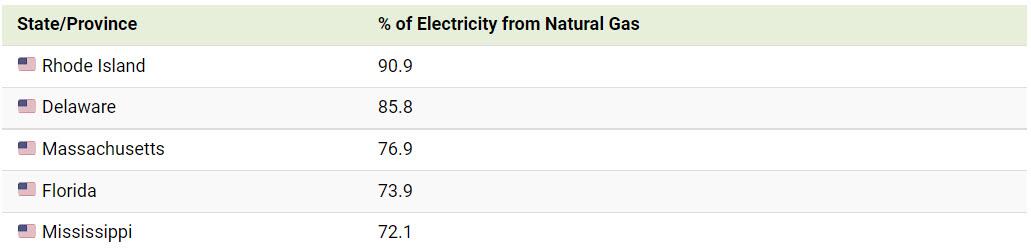
Natural Gas
Natural gas is widely used for electricity generation in the United States. Known as a “cleaner” fossil fuel, its abundance, coupled with an established national distribution network and relatively low cost, makes it the leading electricity source in the country.
In 2021, 38% of the 4120 terawatt-hours (TWh) of electricity generated in the U.S. came from natural gas. Not surprisingly, more than 40% of American states have natural gas as their biggest electricity source.
Here are some states that have the largest shares of natural gas-sourced electricity.
In Canada, natural gas is only the third-biggest electricity source (behind hydro and nuclear), accounting for 11% of the 632 TWh of electricity produced in 2019. Alberta is the only province with natural gas as its main source of electricity.
Nuclear
Nuclear power is a carbon-free energy source that makes up a considerable share of the energy generated in both the U.S. and Canada.
19% of America’s and 15% of Canada’s electricity comes from nuclear power. While the percentages are close to one another, it’s good to note that the United States generates 6 to 7 times more electricity than Canada each year, yielding a lot more nuclear power than Canada in terms of gigawatt hours (GWh) per year.
As seen in the map, many states and provinces with nuclear as their main source of electricity are concentrated in the eastern half of the two countries.
In the U.S., Illinois, Pennsylvania, and South Carolina are top producers in terms of GWh/year. Illinois and South Carolina also have nuclear as their primary electricity source, whereas Pennsylvania’s electricity production from natural gas exceeds that from nuclear.
The vast majority of Canada’s nuclear reactors (18 of 19) are in Ontario, with the 19th in New Brunswick. Both of these provinces rely on nuclear as their biggest source of electricity.
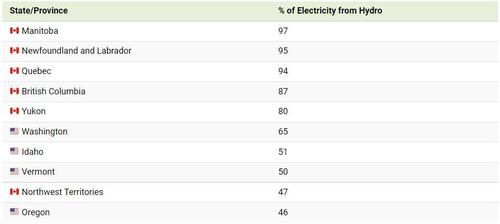
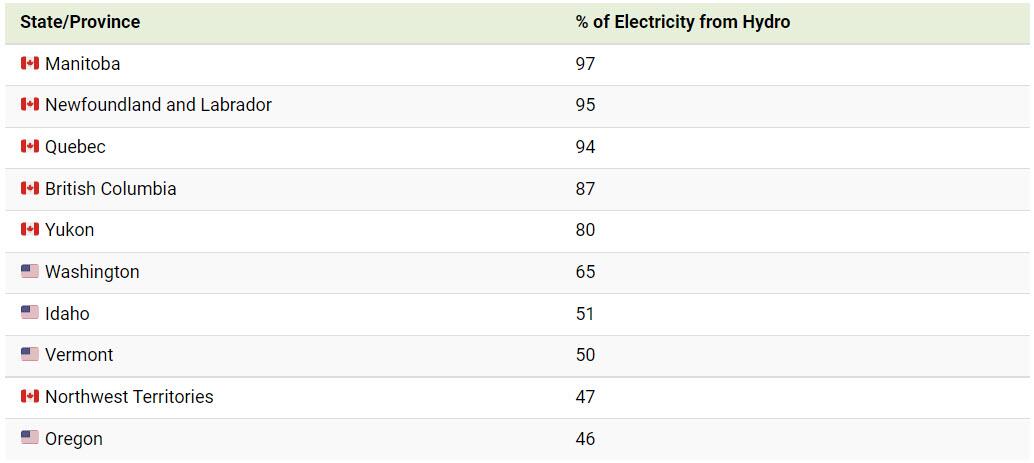
Renewables: Hydro, Wind and Solar
Out of the different types of renewable electricity sources, hydro is the most prevalent in North America. For example, 60% of Canada’s and 6% of the U.S.’s electricity comes from hydropower.
Here are the states and provinces that have hydro as their biggest source of electricity.
Wind and solar power collectively comprise a small percentage of total electricity generated in both countries. While no state or province relies on solar as its biggest source of electricity, Iowa, Kansas, Oklahoma, and South Dakota rely primarily on wind for their electricity, along with Canada’s Prince Edward Island (PEI).
Coal and Oil
Coal and oil are emission-heavy electricity sources still prevalent in North America.
Currently, 22% of America’s and 7% of Canada’s electricity comes from coal, with places such as Kentucky, Missouri, West Virginia, Saskatchewan, and Nova Scotia still relying on coal as their biggest sources of electricity.
Certain regions also use petroleum to generate their electricity. Although its use for this purpose is declining, it is still the biggest source of electricity in both Hawaii and Nunavut.
Over the next few years, it will be interesting to observe the use of these fossil fuels for electricity generation in the U.S. and Canada. Despite the differences in climate commitments between the two countries, lowering coal and oil-related emissions may be a critical part of hitting decarbonization targets in a timely manner.
January 13, 2023
European Flexible Foam Update
Europur: Supply situation improves / prices of raw materials historically high
Jan 10, 2023

According to Europur, the European Association of Flexible PU Foam Blocks Manufacturers, even though gas prices in Europe have receded compared to the summer, they remain historically high and volatile in Europe, creating difficulties for the entire chemicals industry, in which gas is used both as a raw material and as a source of energy.
As reported by CEFIC, the European Chemical Industry Council, in October 2022 for the first time ever Europe imported more chemicals than it exported, and the industry at large is at “a breaking point”. Major German raw materials suppliers, also active in the polyurethane supply chain, have warned that the situation may prompt them to adapt their European strategies in the short term.
Being strongly dependent on the supply of chemical raw materials, the above means the situation was precarious over the autumn for the flexible polyurethane foam industry. Especially since this was combined with the additional difficulty that the three European sites producing TDI (Toluene Diisocyanate) – one of the main chemicals used to make foam blocks – halted production for various reasons. While two have in the meantime restarted production, one of them remains under force majeure. All suppliers did their utmost to stabilize supply, notably by using their global networks to import TDI from Asia and the USA, but such extensive rotations of ships require time to be put in place.
In parallel, demand for foam is reported to have decreased due to reduced demand, mostly from the upholstered furniture and bedding markets, as Europeans divert their spending to other items.
As a result of the declining demand and of the restart of European production / stable imports of chemicals, foam shortages have largely receded during November 2022. Prices of chemical raw materials have also started to stabilise. However, with continued high gas prices, they remain historically high as reported in specialised trade press.
The evolution of the situation for the future remains quite uncertain, as the flexible polyurethane foam supply chain can be influenced positively or negatively by any of these factors:
- Gas prices in Europe and operational cost of the chemical industry / anticipated uncertainty on stability of gas supply in Europe over much of 2023.
- The evolution of the pandemic in Asia and particularly China, which can influence price of chemical raw materials at global level and possibility for exports to Europe.
- Evolution of demand in Europe for foam-containing products, especially mattresses and furniture.
January 12, 2023
EVERCHEM UPDATE: VOL. 07 – Green Lights and Bailouts
GREEN LIGHT: It’s that unwonted time of year again, the slow drag of December selloffs has finalized, and the purchasing department dogs are let loose. BAILOUTS: Once an economic downturn presents itself in grandiose enough manner to be leveraged, victimhood goes in vogue.
January 12, 2023
More on the Ports
The Great Unwind: Busiest US Container Ports Went From Swamped To Eerily Quiet
by Tyler Durden
Thursday, Jan 12, 2023 – 10:59 AM
Container volumes at the twin ports of Los Angeles and Long Beach, California, are seeing steep declines versus one year ago, signaling a downturn in imported goods might suggest continued sinking economic activity.
The twin ports are the busiest container port complex in the country, responsible for 40% of all containerized flow, and are a major artery feeding overseas goods into the Heartland through rail and trucking networks.
Gene Seroka, the executive director of the Port of Los Angeles, told Bloomberg the days of more than 100 container ships waiting in queue and massive container backlogs are all but over.
Imports are sliding as major US retailers such as Walmart, Target, and Costco pull back on orders because of high inventories. Management of these retailers noted on recent earnings calls that consumer demand for big-ticket items such as electronics and furniture has waned because of elevated inflation and interest rates, leaving them with an abundance of supply in warehouses.
US retail sales tumbled in November, the Commerce Department said last month, as consumers buy staple items to survive the inflation storm rather than buying televisions and computers.
Last month, Seroka said, “We are seeing a nationwide slowing of imports.”
The latest charts show West Coast transport networks are slowing.
The first chart shows easing congestion at the largest containerized ports and slumping congestion on rail networks.
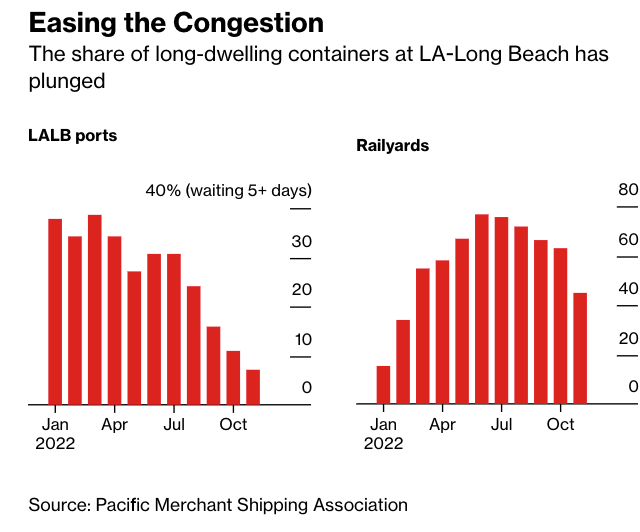
Seroka noted in the Bloomberg interview that easing backlogs meant processing containers through the twin ports has increased in speed.
Next are container rates for major shipping lines that have plunged — some are nearing pre-pandemic levels.
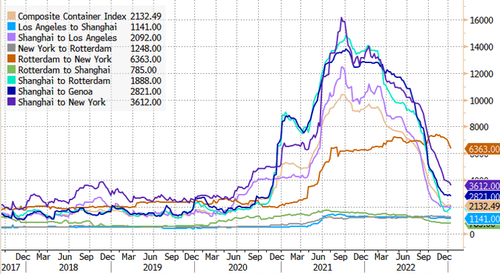
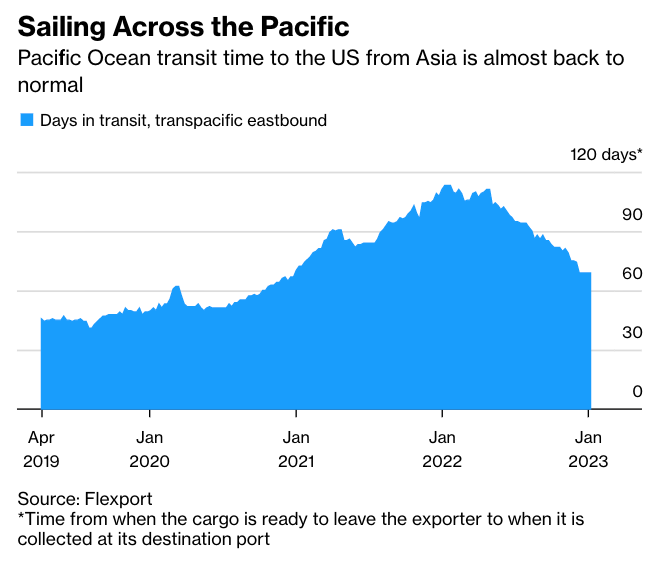
Transit times for vessels from Asia to the US are normalizing.
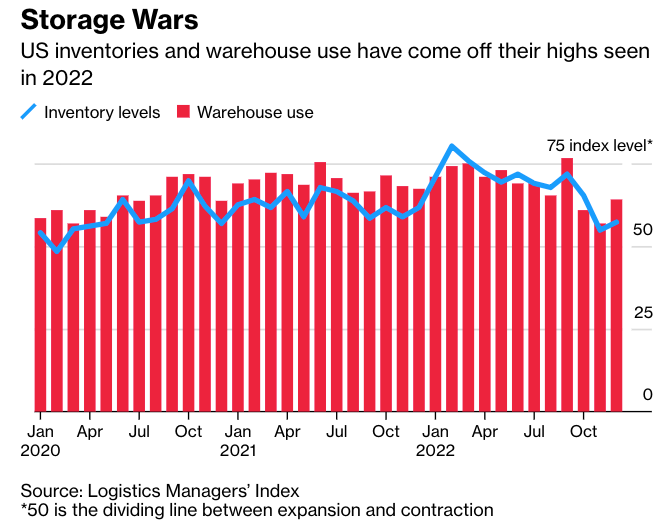
Inventory levels at warehouses are coming off a peak.
Separately, in a note on Wednesday, Goldman Sachs’ Patrick Creuset told clients, “demand destruction allowed for an unwinding of supply chain bottlenecks” across the air and sea networks. He expects this “will come to an end during 1Q23, with volumes returning to modest growth through the rest of the year.”
Creuset pointed out, “a record order book of containerships about to be delivered from 1Q23 through 2H24, and belly capacity set to gradually return in air cargo.” The good news is that seaborne transport capacity is about to be expanded.
And according to Morgan Stanley’s Ravi Shank, he expects retailers’ 12-15 month de-stocking cycle could reach a bottom and begin to normalize by the midpoint of the year, and it could even lead to an upcycle in the second half.
So the good news is the shipping downturn has cleared out supply chain snarls at some of the largest US containerized ports. It seems like retailers are at an inflection point, and once de-stocking is complete, they will increase overseas orders, which might not occur until the second half.
We ask why retailers would want to increase goods on hand if the IMF and World Bank are slashing global growth estimates and warning about recession.
https://www.zerohedge.com/markets/great-unwind-busiest-us-container-ports-went-swamped-eerily-quiet