Current Affairs
January 12, 2023
More on the Ports
The Great Unwind: Busiest US Container Ports Went From Swamped To Eerily Quiet
by Tyler Durden
Thursday, Jan 12, 2023 – 10:59 AM
Container volumes at the twin ports of Los Angeles and Long Beach, California, are seeing steep declines versus one year ago, signaling a downturn in imported goods might suggest continued sinking economic activity.
The twin ports are the busiest container port complex in the country, responsible for 40% of all containerized flow, and are a major artery feeding overseas goods into the Heartland through rail and trucking networks.
Gene Seroka, the executive director of the Port of Los Angeles, told Bloomberg the days of more than 100 container ships waiting in queue and massive container backlogs are all but over.
Imports are sliding as major US retailers such as Walmart, Target, and Costco pull back on orders because of high inventories. Management of these retailers noted on recent earnings calls that consumer demand for big-ticket items such as electronics and furniture has waned because of elevated inflation and interest rates, leaving them with an abundance of supply in warehouses.
US retail sales tumbled in November, the Commerce Department said last month, as consumers buy staple items to survive the inflation storm rather than buying televisions and computers.
Last month, Seroka said, “We are seeing a nationwide slowing of imports.”
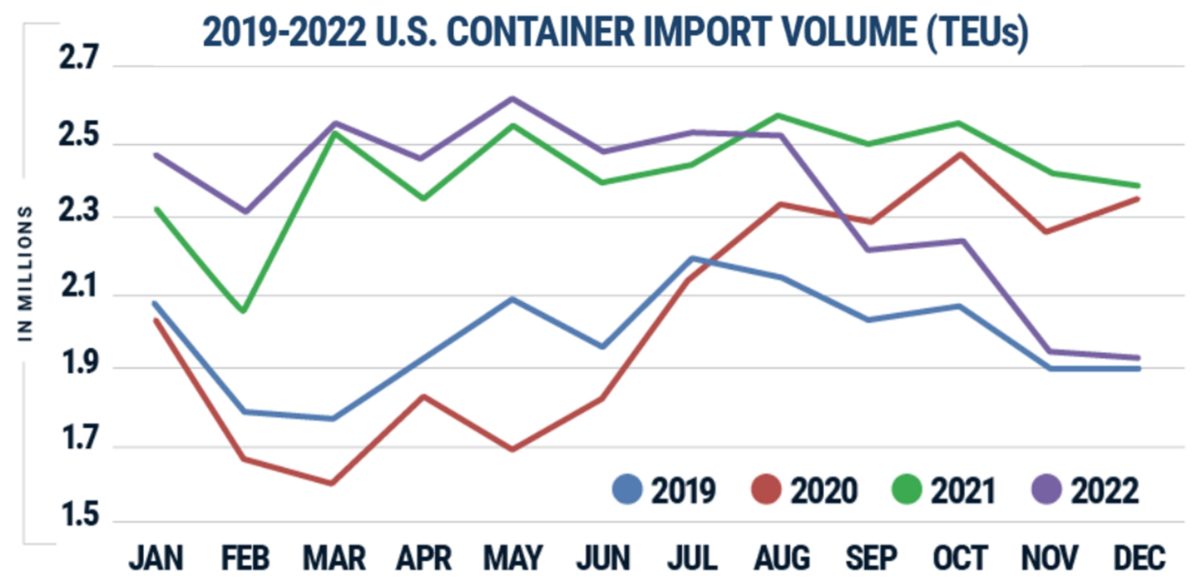
The latest charts show West Coast transport networks are slowing.
The first chart shows easing congestion at the largest containerized ports and slumping congestion on rail networks.
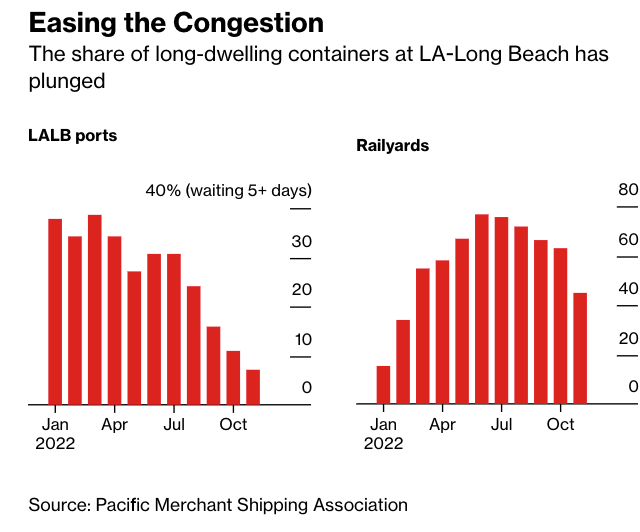
Seroka noted in the Bloomberg interview that easing backlogs meant processing containers through the twin ports has increased in speed.
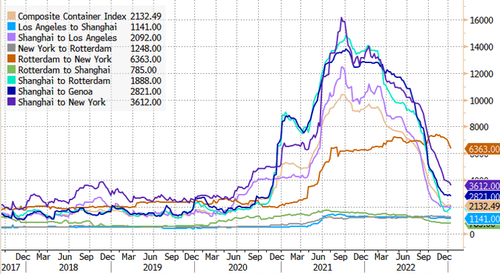
Next are container rates for major shipping lines that have plunged — some are nearing pre-pandemic levels.
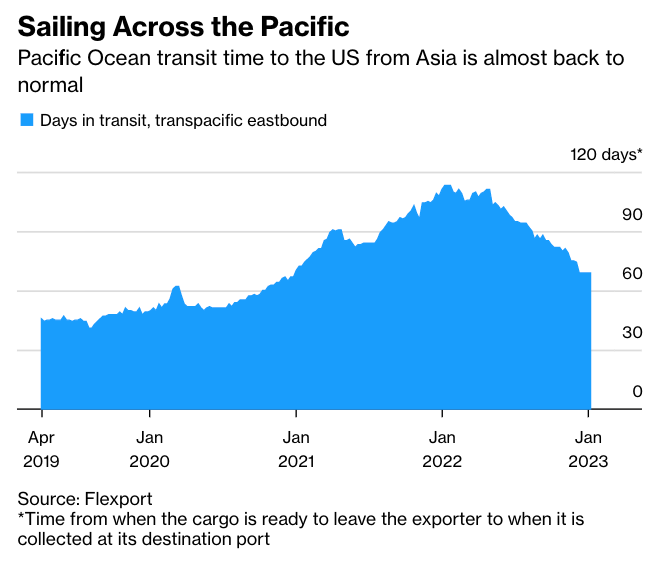
Transit times for vessels from Asia to the US are normalizing.
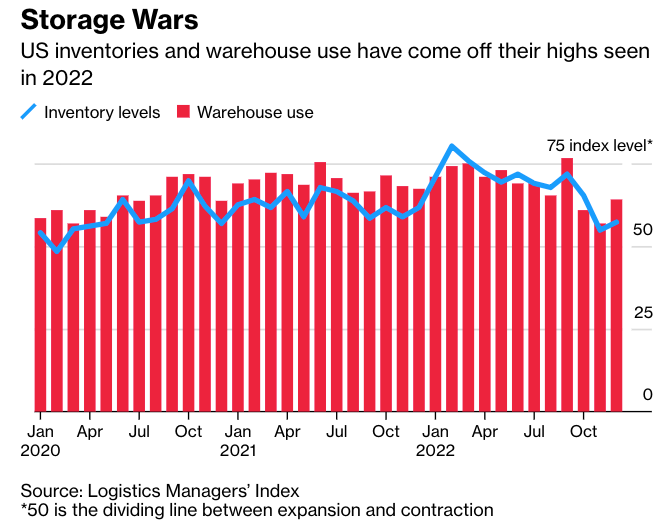
Inventory levels at warehouses are coming off a peak.
Separately, in a note on Wednesday, Goldman Sachs’ Patrick Creuset told clients, “demand destruction allowed for an unwinding of supply chain bottlenecks” across the air and sea networks. He expects this “will come to an end during 1Q23, with volumes returning to modest growth through the rest of the year.”
Creuset pointed out, “a record order book of containerships about to be delivered from 1Q23 through 2H24, and belly capacity set to gradually return in air cargo.” The good news is that seaborne transport capacity is about to be expanded.
And according to Morgan Stanley’s Ravi Shank, he expects retailers’ 12-15 month de-stocking cycle could reach a bottom and begin to normalize by the midpoint of the year, and it could even lead to an upcycle in the second half.
So the good news is the shipping downturn has cleared out supply chain snarls at some of the largest US containerized ports. It seems like retailers are at an inflection point, and once de-stocking is complete, they will increase overseas orders, which might not occur until the second half.
We ask why retailers would want to increase goods on hand if the IMF and World Bank are slashing global growth estimates and warning about recession.
https://www.zerohedge.com/markets/great-unwind-busiest-us-container-ports-went-swamped-eerily-quiet
January 11, 2023
Imports Normalizing
‘Surge finally over,’ US imports back near pre-pandemic levels
Descartes: December 2022 imports just 1.3% above December 2019 imports
· Tuesday, January 10, 2023

Listen to this article
0:00 / 3:50BeyondWords
The “new normal” is looking a lot like the old normal as U.S. imports continue to fall. Volumes began declining sharply in September and were already close to 2019 levels by the end of last year. They’re expected to pull even with pre-COVID numbers this month and next.
The “pandemic-driven surge [is] finally over,” said the National Retail Federation (NRF).
The NRF publishes the monthly Port Tracker report together with Hackett Associates. “Import patterns appear to be returning to what was normal prior to 2020,” said Hackett Associates founder Ben Hackett.
Port Tracker covers 12 U.S. ports. While final counts are not in yet, it estimated the ports it covers handled 1.88 million twenty-foot equivalent units in December, down 10.1% year on year.
Port Tracker forecasts that import volumes in January and February will be roughly even with pre-COVID levels then will bounce back above them again in March-May.
Another data provider, Descartes, reported imports for all U.S. ports totaled 1,929,032 TEUs in December, just 1.3% higher than imports in December 2019, pre-COVID.
Last month’s imports were down 19.3% year on year and down 1.3% versus November, according to Descartes.
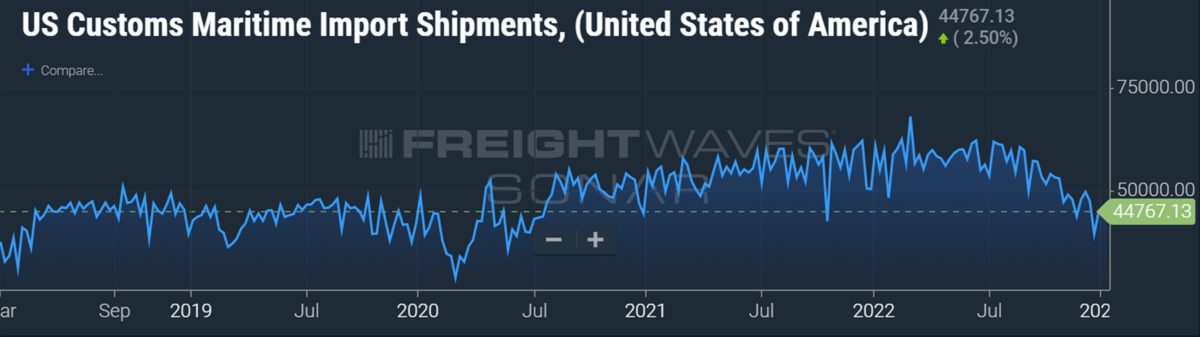
A FreightWaves SONAR dataset on U.S. Customs import shipments likewise shows a reversion to pre-pandemic conditions. Shipments are now back to 2019 levels.
Not all back to normal
Countrywide volumes are close to pre-boom levels, but there are still some big differences.
Ocean schedules have improved, but delays remain higher than they used to be. In the first week of January, the Flexport Ocean Timeliness Indicator for the Asia-U.S. route was still 25% higher than three years ago.
The coastal mix is also much different. Ports on the East and Gulf coasts continue to handle significantly higher volumes than before the pandemic. Volumes on the West Coast are much lower than they used to be.
A new West Coast dockworker labor contract has still not been signed, over seven months after the last one expired.
“The continuing labor uncertainty could be a significant reason why import volumes are not shifting back to major California ports despite their improving situation,” said Chris Jones, executive vice president of industry and services at Descartes.
The COVID-19 situation in China presents another ongoing complication for supply chains. “COVID infection is widespread and given that the Chinese population has little to no immunity, the impact of COVID on manufacturing supply chains could continue for quite some time,” noted Jones.
There could also be another inventory effect ahead — this time in the opposite direction. In 2022, importers brought in too much; at some point in 2023, they may find they have too little.
“People … will see that underlying consumer demand is actually relatively healthy and all of a sudden, they’ll become concerned that their inventories are a bit on the low end and we’ll possibly see a bounce-back,” said Hapag-Lloyd CEO Rolf Habben Jansen last year.
Hackett predicted, “As inflation eases and consumer spending returns, we project that growth will slowly return going into the second half of the year.”
January 10, 2023
U.S. Auto Sales
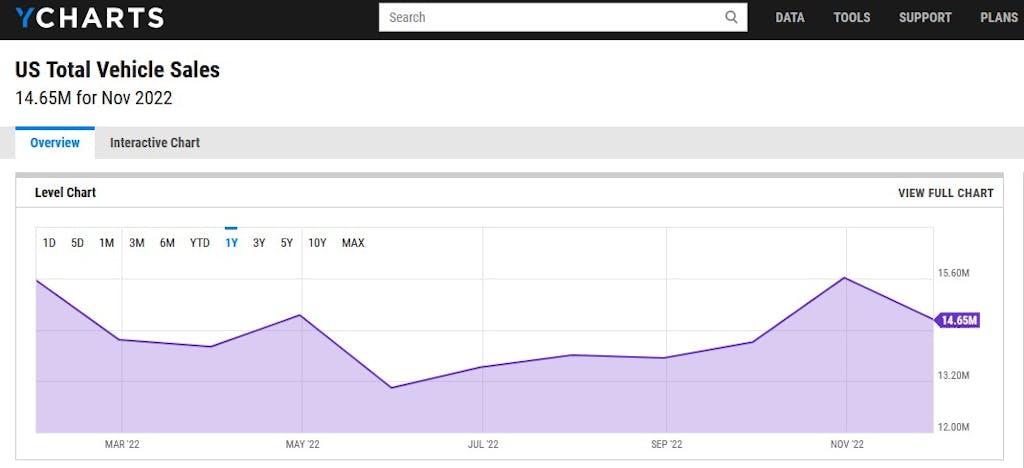
January 10, 2023
U.S. Auto Sales
January 10, 2023
Mattress Imports in November 2022
Imports: Mattresses and other bedding products
Total Imports Compared to the same month a year ago
-32.62%
Compared to last month
-6.75%
Total All Imports Compared to the same month a year ago
-1.24%
Compared to last month
-9.38%
RankAmong U.S. Imports
118
Rank 2021
107
U.S. imports of Mattresses and other bedding products totaled $348.83 million in November, a change of -32.62 percent from the same month one year ago. The change from one month ago was -6.75 percent. Among more than 1,260 commodity classifications, Mattresses and other bedding products ranked No. 118 in November. It had ranked No. 107 for the same month last year.
While Mattresses and other bedding products ranked No. 118 in November by value, it ranked No. 95 by tonnage. The top three U.S. markets by value for Mattresses and other bedding products imports in November were (1) China, (2) Mexico, and (3) Indonesia. Among the nation’s more than 450 airports, seaports and border crossings, the top three by value were (1) Oil, (2) Passenger vehicles, and (3) Cell phones, related equipment.