The Urethane Blog
Everchem Updates
VOLUME XXI

September 14, 2023
Everchem’s exclusive Closers Only Club is reserved for only the highest caliber brass-baller salesmen in the chemical industry. Watch the hype video and be introduced to the top of the league: — read more
June 9, 2022
FOR IMMEDIATE RELEASE
Polyurethane Foam Association Spring Meeting Reports Record Attendance, Promotes Information Exchange
Edge-Sweets Company and James T. McIntyre, Jr. Inducted Into The Flexible Polyurethane Foam Hall Of Fame

congratulations from Bill Gollnitz, PFA
Past President and Technical Program
Moderator, for winning the Dr. Herman
T. Stone Technical Excellence Award.
ST. PETERSBURG, FL (June 8, 2022)—The Polyurethane Foam Association (PFA) recently concluded its Spring meeting, a return to near-normal for over 150 sales and marketing professionals, EHS specialists, technologists, entrepreneurs and C-suite executives who convened at the Vinoy Renaissance in St. Petersburg, FL.
Attendees saw presentations on key industry issues including supply chain challenges, recycling, regulations, and end-user market forecasting.
PFA’s Industry Issues session examined the full reach of the polyurethane value chain, from research priorities and raw materials sourcing to the challenges faced by foam users in the automotive, office furniture, carpet cushion and footwear industries.
The following afternoon, technical papers covered achievements in foam recycling, odor and microbial control, alternative catalysts, block geometry, and the use of data science to guide production parameters.
“Our industry weathered the pandemic better than many, but we all welcomed the chance to meet again in person and continue moving back toward normal,” said Russ Batson, PFA Executive Director.
Batson noted that more than a dozen new companies have joined PFA in the last year, which he called a vote of confidence in the association and its central role in the industry. “To stay abreast of technical developments, regulatory challenges, sourcing strategies, industry-sponsored and government-funded research, companies really need to be involved with the association.”
Keynote speaker Dr. Brian Domitrovic discussed supply-side economics and offered insights into the current economic situation in the U.S. Domitrovic, a former economic history professor at Sam Houston State University, co-authored with Larry Kudlow JFK And The Reagan Revolution: A Secret History of American Prosperity. Early registrants to PFA’s meeting were provided copies of the book, which Domitrovic signed for attendees. Domitrovic contended that the U.S. today channels too much talent and money into the finance, health care and education sectors, and not enough into manufacturing.
Keith Task of BASF won the Dr. Herman Stone Technical Excellence Award, as his presentation, “Digitization And Predictive Modeling Of Polyurethane Data Via Machine Learning And Artificial Intelligence,” was voted best by those attending the Technical Program.
“Our technical presenters covered a spectrum of topics this year,” noted Bill Gollnitz, Past President of PFA and Moderator for the Technical Program. “It was refreshing to see a mix of new faces along with industry veterans sharing innovations with the flexible polyurethane foam industry.”
www.pfa.org
June 8, 2022
US Import Demand Is Dropping Off A Cliff
by Tyler DurdenTuesday, Jun 07, 2022 – 07:25 PM
By Henry Byers of FreightWaves
The latest ocean container bookings data reveals that despite the strong levels of inbound cargo during the first five months of 2022, import demand is not just softening — it’s dropping off a cliff. Because capacity on the trans-Pacific has remained relatively stable, Drewry’s container spot rates from China to the West Coast have plunged 41% month-over-month to $9,630.
Freight forwarders will enjoy expanding margins on ocean freight, while U.S. trucking carriers and intermodal volume providers may start to see volume risks.
Consumer buying patterns are rapidly normalizing to pre-COVID levels, and U.S. retailers are stuck with too much inventory. Target shares dropped Tuesday morning after executives said the company would mark down unwanted items, cancel purchase orders and move quickly to get rid of excess inventory.
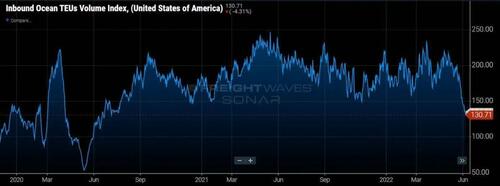
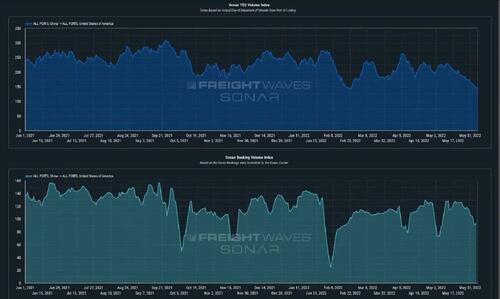
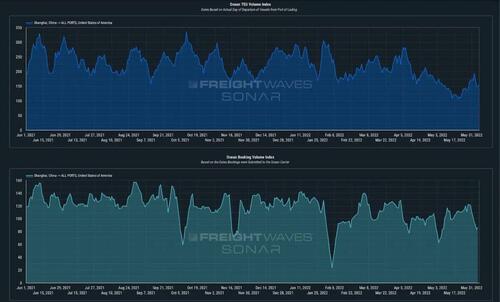
Container imports bound for the U.S. have dropped over 36% since May 24. (This index measures departing container volumes at the port of origin). This is a troubling sign for domestic U.S. freight markets that have been benefiting from an unprecedented surge of containerized import volumes over the last 18 months. Since ocean transit times for these inbound container volumes have recently been averaging between 30 and 35 days, we will begin seeing the softer volumes show up at U.S. ports in the first couple of weeks of July.
This also puts U.S. containerized imports from all countries of origin down 36% year-over-year, which is a reversion back to the volume levels of the summer of 2020. But what is the cause of the sudden drop in containerized import volumes? Well, there are a few simultaneous factors converging that serve as likely explanations for why volumes are suddenly dropping.
The inventory glut
At the forefront of these reasons is the buildup of inventory here in the U.S. resulting from companies attempting to both replenish inventories that were largely depleted in 2021, but also from these companies wanting to keep enough inventory on hand in case of any further disruptions that may occur. Consecutive rounds of COVID lockdowns in China only exacerbated those fears, but after the war between Russia and Ukraine broke out more than 100 days ago, the geopolitical risks seem to only be escalating, and for better or for worse, companies decided that they would rather have the inventory safely here in the U.S. than risk having it abroad should there be a sudden surge in consumer demand.
So, if consumers are now shifting buying trends from goods to services, those goods-producing companies may get stuck with too much inventory or the wrong inventory in order to try to capture sales. This buildup of inventory will inevitably lead to a slowdown in new import orders abroad and thus will only add to the demand destruction we are seeing for containerized imports into the U.S. Just Tuesday Target announced an “aggressive” inventory reduction plan led by canceling orders and marking down even more inventory.
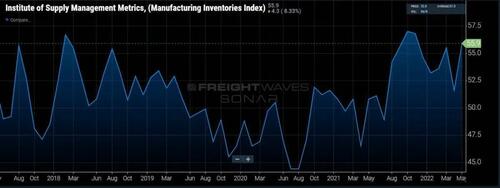
The chart above, displaying rising inventories, and the chart below, displaying falling imports, reveal that retailers are upside down after the last surge of freight to hit the United States’ shores and are throttling down freight velocity in their networks.
The consumer is getting crushed
Conditions for the consumer seem to be getting worse and worse as inflation takes hold and prices get more and more expensive. Just this week, AAA reported a new record high for gasoline prices at $4.51 per gallon on its national index.
Some economists speculate that with the Fed beginning to raise rates and draw down its balance sheet, we may be experiencing “peak inflation.” However, even if inflationary pressures begin to ease, consumers may still be overexposed to rising interest rates through the use of credit in a way that could further deteriorate demand and discretionary spending.
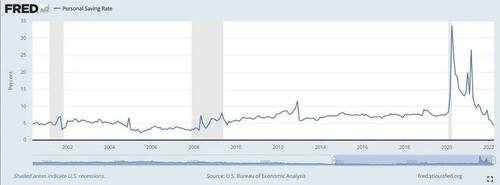
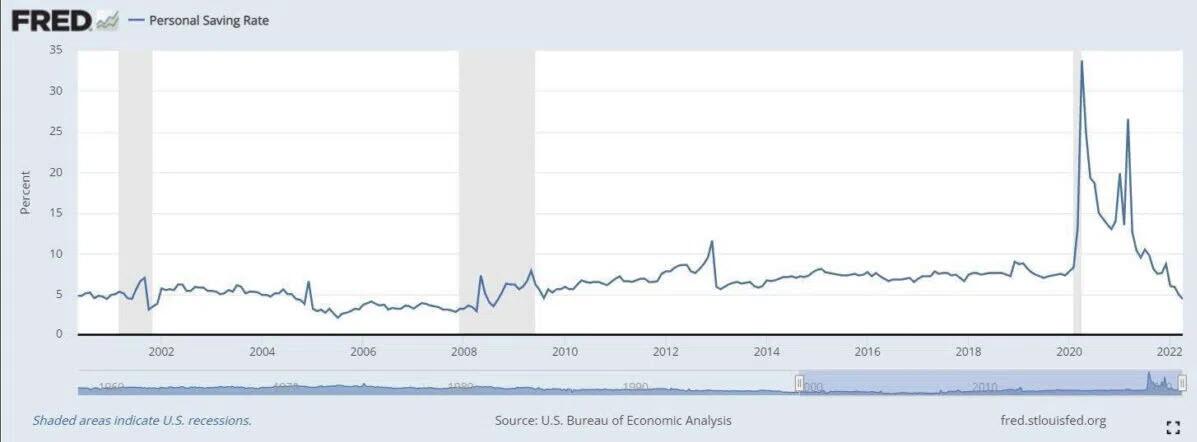
Credit card spending has been accelerating at a time when personal savings rates have continued to decrease and move toward some of their lowest rates (last reading 4.4) since the Great Financial Crisis (4.5 in August 2009). There are two ways to read very low savings rates: either consumers are exceptionally confident and exuberantly spending their money or consumers are spending every last dollar they have in an attempt to keep their heads above water in a high-inflation environment. Either way, there isn’t any slack left in consumer wallets — it’s hard to imagine consumer spending growing from here.
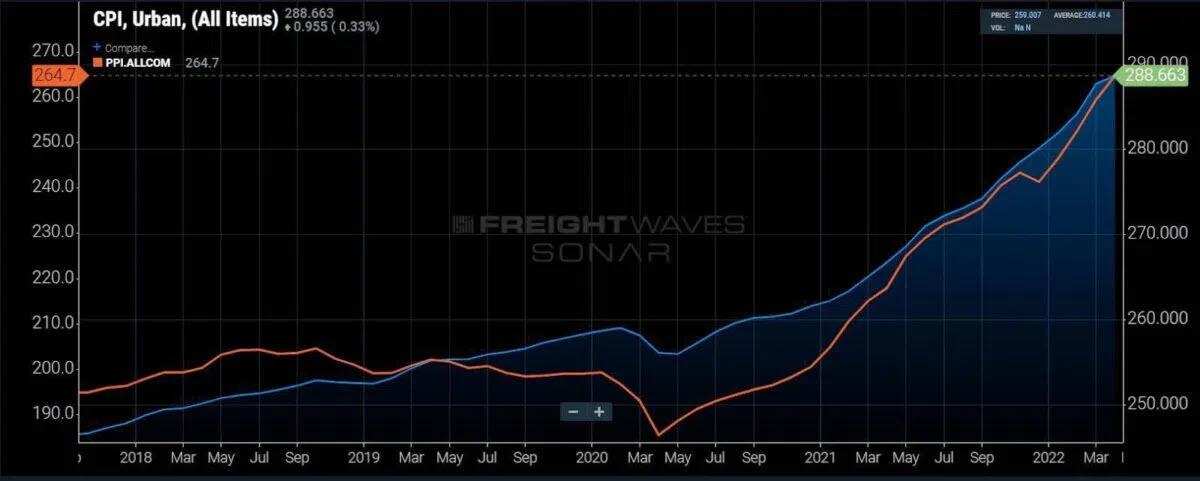
Unfortunately, inflationary pressures in energy and food don’t know or care that American consumers are out of money — inflation in those sectors was caused by supply shocks, not artificially stimulated demand. It is also important to keep in mind that the rate of growth for the Producer Price Index has been outpacing the Consumer Price Index, so some producers may still be taking some hits from rising costs that have not yet been passed on to the consumer.

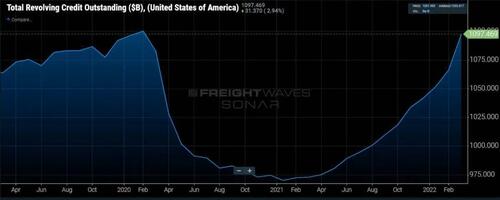
So even though total revolving credit outstanding is just at pre-pandemic levels, it is nonetheless accelerating, and if prices continue to rise, it is reasonable to expect that revolving credit outstanding will rise as well.
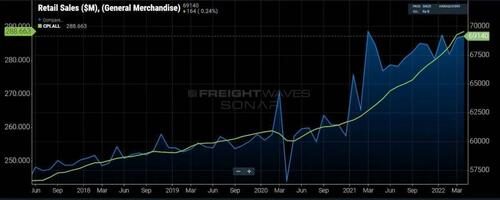
At first glance, one may look at retail sales (charted below) and conclude that they are growing, but keep in mind that the report is measured in nominal dollars unadjusted for inflation and represents increases in the prices of goods being sold — not so much the strength or resilience of consumers. Goods-producing companies will not be alone. Services and tech companies will also be under pressure in the coming months, and sell-offs could lead to layoffs.
As we see a growing number of signs pointing toward further demand destruction from U.S. consumers, and thus a further reversion of import container volumes back to levels closer to 2019, it is worth examining the trade lane that handles a majority of that volume: China to the U.S.
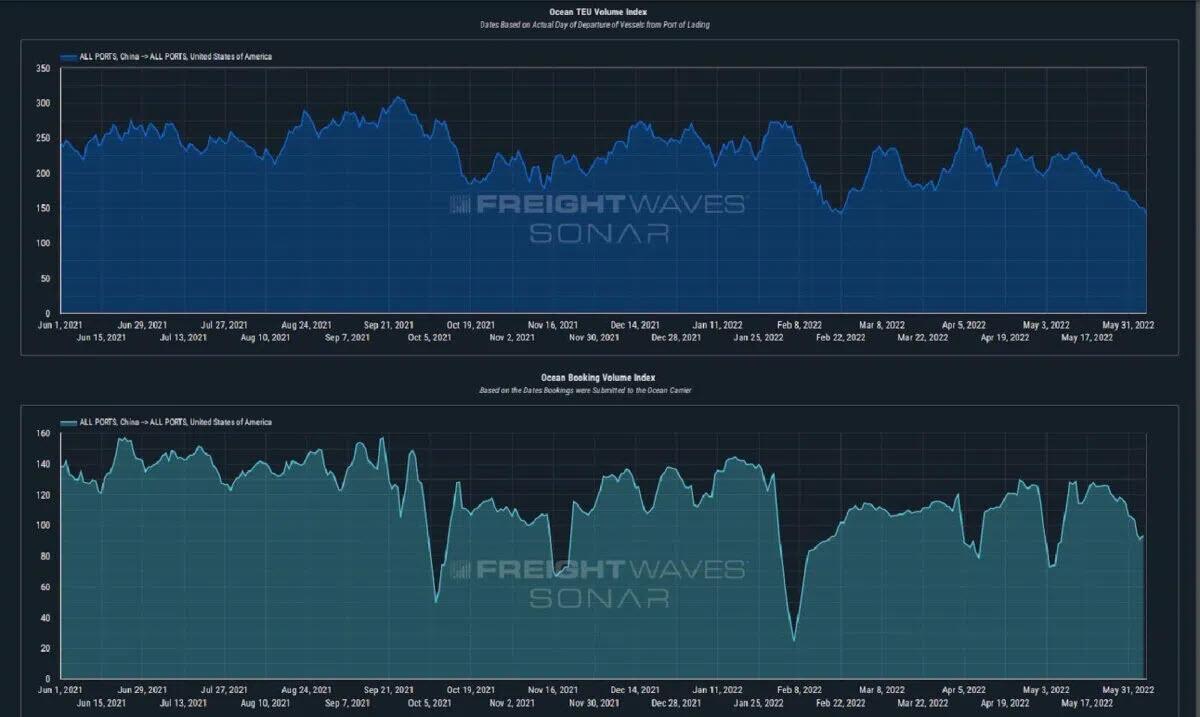
When looking at aggregated volumes from China to all U.S. ports, we are able to see that volumes have been declining from the “peak of peak season” in September 2021 through Tuesday (currently down 51% from that peak). While late March through the beginning of May is historically (pre-trade war/pre-pandemic) a softer period for volumes on this trade lane, it is important to realize that this decline in volumes has also been amplified by the COVID restrictions and lockdowns implemented by the Chinese government in Shanghai as well as other important manufacturing regions in China (most notably around Beijing and its major nearby port of Tianjin).
Despite the lockdowns, a decline in volumes on this major trade lane was seemingly inevitable in 2022 as the massive volumes moved between these two countries in 2021 were at unprecedented and unsustainable levels. Now some industry observers are calling for a “container surge” as China reopens, but it seems that the demand destruction has already spilled over into this trade lane in a big way.
The ‘container surge’ that never was
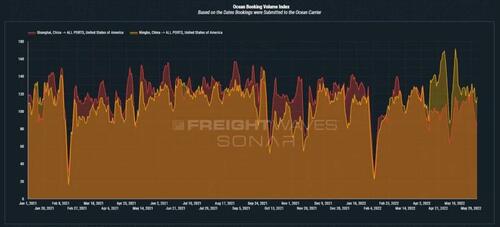
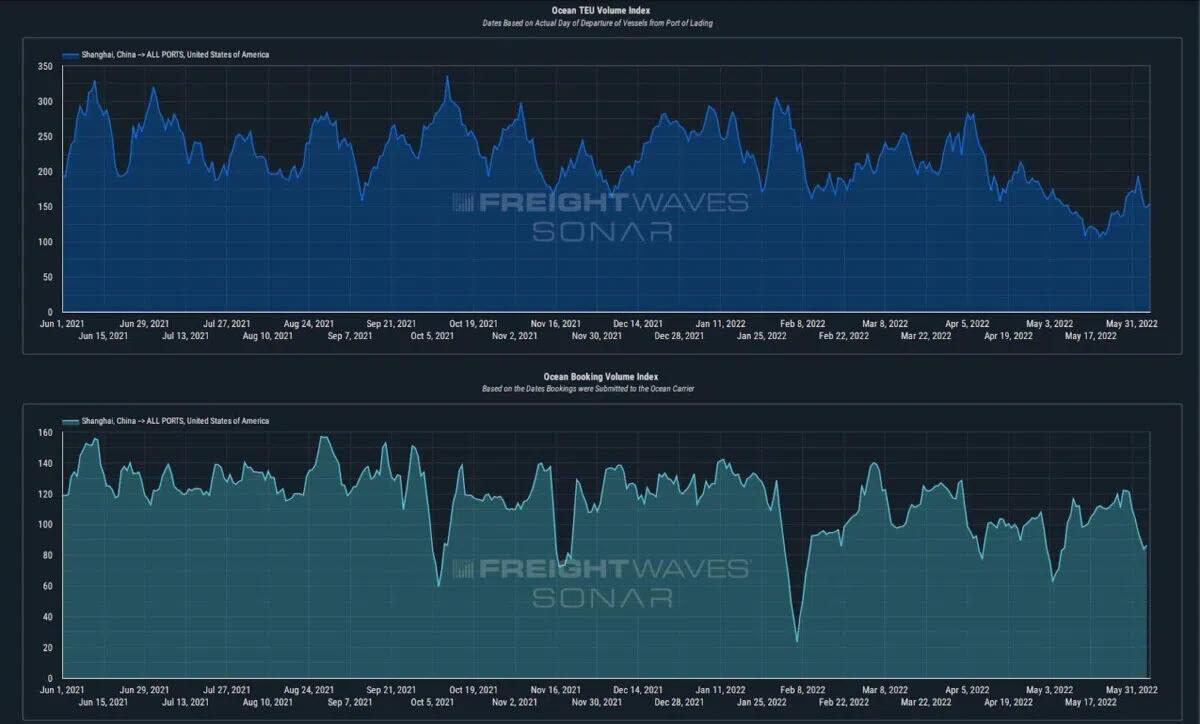
The “container surge” that many have been expecting from Shanghai (thought to be building during the lockdowns) appears to have mostly already been rerouted through the Port of Ningbo (yellow). With access to the Port of Shanghai being largely blocked due to landside restrictions (i.e., road closures), shippers were quick to reroute volumes through the closest alternate major port to the Port of Shanghai (red). Since the lockdowns began in Shanghai in late March, the decline in Shanghai new bookings (and thus load volumes) has been more than offset by a surge of volumes through Ningbo from rerouted containers. This led to booking lead times hitting their lowest levels on record as shippers scrambled to get their volumes moving.
Despite the reopening of Shanghai, total container volumes from China to the U.S. have continued their downward trajectory, and that trend is not likely to be reversed by an easing of COVID restrictions alone. As of the latest data points, if this is the “container surge” from Shanghai to U.S. ports upon its reopening last Wednesday, then right now, it is barely a “blip on the radar” compared to the volumes from Shanghai to the U.S. that what we have seen over the last 18 to 22 months. This could easily change within our bookings data for the weeks ahead, and if there is pent-up demand, it will undoubtedly show up in the bookings data, but as of Tuesday, it has not yet materialized in any significant way.
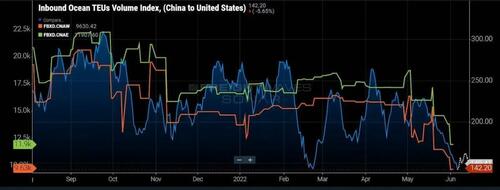
This steady decline in volumes from China to the U.S. has also put significant downward pressure on spot rates from the demand side. As capacity remained relatively consistent in the first few weeks post-lockdown (March 28 onward), the drop in volumes caused a decline in both the Freightos Baltic Daily Index and the Drewry World Container Index spot rates from China/East Asia to the U.S. West Coast (down 41% per FEU month-over-month [m/m] – $9,630), as well as from China/East Asia to the U.S. East Coast (down 36% per FEU m/m – $11,907). While this has been a welcome downturn in spot rates for shippers that battled the record-setting spot rates of 2021, we should also keep in mind that these spot rates remain elevated on a y/y basis (73% to the West Coast and 59% to the East Coast).
If bookings continue to soften through June, we expect to see spot rates on this trade lane decline further, but ocean carriers may go to greater lengths than ever before to try and protect their record-setting earnings. They have already been cutting capacity on major trade routes through measures such as blank sailings and reassigning vessels to other services, but if the decline in volumes accelerates in the weeks ahead, we may see the alliances test their strength and discipline like never before.
If rates start dropping quickly, it is reasonable to suspect that the ocean carriers that have not locked in a majority of their allocations in longer-term contracts may begin aggressively undercutting one another as they compete in the spot market.
Interestingly enough, the last port labor negotiations at LAX/LGB that caused disruptions to supply chains (and thus led to a buildup of inventory in the U.S.) in 2014-15 created a similar situation. Coming off of a record year, that may sound like an unlikely scenario, but there is a distinct possibility that sharply softening spot rates could cause a shakeup and/or reorganization of the current alliances.
https://www.zerohedge.com/markets/us-import-demand-dropping-cliff
June 8, 2022
US Import Demand Is Dropping Off A Cliff
by Tyler DurdenTuesday, Jun 07, 2022 – 07:25 PM
By Henry Byers of FreightWaves
The latest ocean container bookings data reveals that despite the strong levels of inbound cargo during the first five months of 2022, import demand is not just softening — it’s dropping off a cliff. Because capacity on the trans-Pacific has remained relatively stable, Drewry’s container spot rates from China to the West Coast have plunged 41% month-over-month to $9,630.
Freight forwarders will enjoy expanding margins on ocean freight, while U.S. trucking carriers and intermodal volume providers may start to see volume risks.
Consumer buying patterns are rapidly normalizing to pre-COVID levels, and U.S. retailers are stuck with too much inventory. Target shares dropped Tuesday morning after executives said the company would mark down unwanted items, cancel purchase orders and move quickly to get rid of excess inventory.
Container imports bound for the U.S. have dropped over 36% since May 24. (This index measures departing container volumes at the port of origin). This is a troubling sign for domestic U.S. freight markets that have been benefiting from an unprecedented surge of containerized import volumes over the last 18 months. Since ocean transit times for these inbound container volumes have recently been averaging between 30 and 35 days, we will begin seeing the softer volumes show up at U.S. ports in the first couple of weeks of July.
This also puts U.S. containerized imports from all countries of origin down 36% year-over-year, which is a reversion back to the volume levels of the summer of 2020. But what is the cause of the sudden drop in containerized import volumes? Well, there are a few simultaneous factors converging that serve as likely explanations for why volumes are suddenly dropping.
The inventory glut
At the forefront of these reasons is the buildup of inventory here in the U.S. resulting from companies attempting to both replenish inventories that were largely depleted in 2021, but also from these companies wanting to keep enough inventory on hand in case of any further disruptions that may occur. Consecutive rounds of COVID lockdowns in China only exacerbated those fears, but after the war between Russia and Ukraine broke out more than 100 days ago, the geopolitical risks seem to only be escalating, and for better or for worse, companies decided that they would rather have the inventory safely here in the U.S. than risk having it abroad should there be a sudden surge in consumer demand.
So, if consumers are now shifting buying trends from goods to services, those goods-producing companies may get stuck with too much inventory or the wrong inventory in order to try to capture sales. This buildup of inventory will inevitably lead to a slowdown in new import orders abroad and thus will only add to the demand destruction we are seeing for containerized imports into the U.S. Just Tuesday Target announced an “aggressive” inventory reduction plan led by canceling orders and marking down even more inventory.
The chart above, displaying rising inventories, and the chart below, displaying falling imports, reveal that retailers are upside down after the last surge of freight to hit the United States’ shores and are throttling down freight velocity in their networks.
The consumer is getting crushed
Conditions for the consumer seem to be getting worse and worse as inflation takes hold and prices get more and more expensive. Just this week, AAA reported a new record high for gasoline prices at $4.51 per gallon on its national index.
Some economists speculate that with the Fed beginning to raise rates and draw down its balance sheet, we may be experiencing “peak inflation.” However, even if inflationary pressures begin to ease, consumers may still be overexposed to rising interest rates through the use of credit in a way that could further deteriorate demand and discretionary spending.
Credit card spending has been accelerating at a time when personal savings rates have continued to decrease and move toward some of their lowest rates (last reading 4.4) since the Great Financial Crisis (4.5 in August 2009). There are two ways to read very low savings rates: either consumers are exceptionally confident and exuberantly spending their money or consumers are spending every last dollar they have in an attempt to keep their heads above water in a high-inflation environment. Either way, there isn’t any slack left in consumer wallets — it’s hard to imagine consumer spending growing from here.
Unfortunately, inflationary pressures in energy and food don’t know or care that American consumers are out of money — inflation in those sectors was caused by supply shocks, not artificially stimulated demand. It is also important to keep in mind that the rate of growth for the Producer Price Index has been outpacing the Consumer Price Index, so some producers may still be taking some hits from rising costs that have not yet been passed on to the consumer.
So even though total revolving credit outstanding is just at pre-pandemic levels, it is nonetheless accelerating, and if prices continue to rise, it is reasonable to expect that revolving credit outstanding will rise as well.
At first glance, one may look at retail sales (charted below) and conclude that they are growing, but keep in mind that the report is measured in nominal dollars unadjusted for inflation and represents increases in the prices of goods being sold — not so much the strength or resilience of consumers. Goods-producing companies will not be alone. Services and tech companies will also be under pressure in the coming months, and sell-offs could lead to layoffs.
As we see a growing number of signs pointing toward further demand destruction from U.S. consumers, and thus a further reversion of import container volumes back to levels closer to 2019, it is worth examining the trade lane that handles a majority of that volume: China to the U.S.
When looking at aggregated volumes from China to all U.S. ports, we are able to see that volumes have been declining from the “peak of peak season” in September 2021 through Tuesday (currently down 51% from that peak). While late March through the beginning of May is historically (pre-trade war/pre-pandemic) a softer period for volumes on this trade lane, it is important to realize that this decline in volumes has also been amplified by the COVID restrictions and lockdowns implemented by the Chinese government in Shanghai as well as other important manufacturing regions in China (most notably around Beijing and its major nearby port of Tianjin).
Despite the lockdowns, a decline in volumes on this major trade lane was seemingly inevitable in 2022 as the massive volumes moved between these two countries in 2021 were at unprecedented and unsustainable levels. Now some industry observers are calling for a “container surge” as China reopens, but it seems that the demand destruction has already spilled over into this trade lane in a big way.
The ‘container surge’ that never was
The “container surge” that many have been expecting from Shanghai (thought to be building during the lockdowns) appears to have mostly already been rerouted through the Port of Ningbo (yellow). With access to the Port of Shanghai being largely blocked due to landside restrictions (i.e., road closures), shippers were quick to reroute volumes through the closest alternate major port to the Port of Shanghai (red). Since the lockdowns began in Shanghai in late March, the decline in Shanghai new bookings (and thus load volumes) has been more than offset by a surge of volumes through Ningbo from rerouted containers. This led to booking lead times hitting their lowest levels on record as shippers scrambled to get their volumes moving.
Despite the reopening of Shanghai, total container volumes from China to the U.S. have continued their downward trajectory, and that trend is not likely to be reversed by an easing of COVID restrictions alone. As of the latest data points, if this is the “container surge” from Shanghai to U.S. ports upon its reopening last Wednesday, then right now, it is barely a “blip on the radar” compared to the volumes from Shanghai to the U.S. that what we have seen over the last 18 to 22 months. This could easily change within our bookings data for the weeks ahead, and if there is pent-up demand, it will undoubtedly show up in the bookings data, but as of Tuesday, it has not yet materialized in any significant way.
This steady decline in volumes from China to the U.S. has also put significant downward pressure on spot rates from the demand side. As capacity remained relatively consistent in the first few weeks post-lockdown (March 28 onward), the drop in volumes caused a decline in both the Freightos Baltic Daily Index and the Drewry World Container Index spot rates from China/East Asia to the U.S. West Coast (down 41% per FEU month-over-month [m/m] – $9,630), as well as from China/East Asia to the U.S. East Coast (down 36% per FEU m/m – $11,907). While this has been a welcome downturn in spot rates for shippers that battled the record-setting spot rates of 2021, we should also keep in mind that these spot rates remain elevated on a y/y basis (73% to the West Coast and 59% to the East Coast).
If bookings continue to soften through June, we expect to see spot rates on this trade lane decline further, but ocean carriers may go to greater lengths than ever before to try and protect their record-setting earnings. They have already been cutting capacity on major trade routes through measures such as blank sailings and reassigning vessels to other services, but if the decline in volumes accelerates in the weeks ahead, we may see the alliances test their strength and discipline like never before.
If rates start dropping quickly, it is reasonable to suspect that the ocean carriers that have not locked in a majority of their allocations in longer-term contracts may begin aggressively undercutting one another as they compete in the spot market.
Interestingly enough, the last port labor negotiations at LAX/LGB that caused disruptions to supply chains (and thus led to a buildup of inventory in the U.S.) in 2014-15 created a similar situation. Coming off of a record year, that may sound like an unlikely scenario, but there is a distinct possibility that sharply softening spot rates could cause a shakeup and/or reorganization of the current alliances.
https://www.zerohedge.com/markets/us-import-demand-dropping-cliff
June 7, 2022
“Effective July 1, 2022, or as contracts allow, Stepan will increase the price for STEPANPOL® and TERATE® Rigid Polyester
Polyols used in the Americas by $0.12 per pound. This increase is necessary due to the rapid and significant escalation in
feedstock and transportation prices in North America.”