Urethane Blog
Demographic Changes and Growth in the USA
November 19, 2022
Visualizing America’s Changing Demographics Over The Past 100 Years
by Tyler Durden
Friday, Nov 18, 2022 – 08:00 PM
The United States has famously been called a melting pot, due its demographic makeup of various cultures, races, religions, and languages. But what shape does that mixture take? And how has it changed over time?
Beginning over 100 years ago, this video from Kaj Tallungs assesses how America’s demographics have changed from 1901 to 2020. It uses data from multiple sources including the U.S. Census Bureau, the National Center for Health Statistics, and the Human Mortality Database.
A Look at the Total Population
As Visual Capitalist’s Avery Koop notes, the most obvious takeaway from this animation is that America’s population has soared over the last century. America’s population grew from 77 million in 1901 to over 330 million in 2020—or total growth of 330% over the 119 years.
And the U.S. has continued to add to its population totals. Here’s a brief look at at the population in 2021 by regional breakdowns:

And here’s a glance at how some of the population shakes out, across the top 10 most populous states in the country:
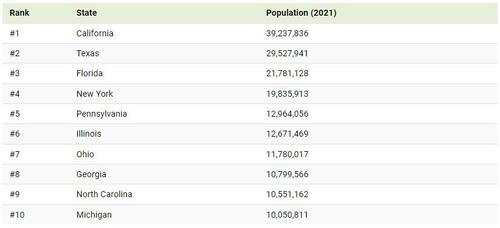
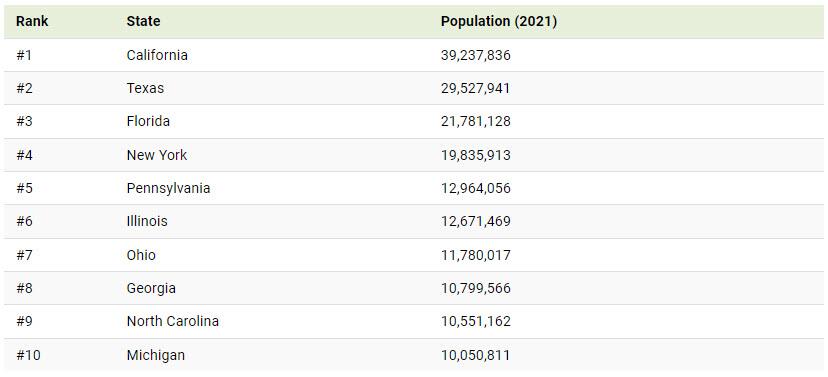
Demographic Breakdowns
Diving a little deeper, the country’s demographic breakdowns have also changed significantly over the last 100+ years. While the share of men and women is an obvious near-even split, age and race distributions have changed drastically.
For starters, though birth rates have remained fairly strong in the U.S., they have been slowing over time. This is similar to many other Western countries, and can eventually result in a larger share of elderly people as well as an increased financial cost of subsidizing their care. Additionally, fewer births results in a depleting workforce as the young population shrinks.
The shares of Black, Asian, Hispanic, and people of two or more races have also been growing. In fact, between 2010–2020 the population of people identifying as two races or more increased by a whopping 276%.
Here’s a glance at some of the other demographic growth rates over the 2010-2020 period:
- Black or African American alone population: +5.6%
- Asian alone population: +35.5%
- Hispanic or Latino alone population: +23%
- White population: -9%
Looking Ahead
Like many countries, a “graying” of the population will become a concern in the United States.
By 2060, it is expected that 95 million Americans will be over 65. But the share of those 18 and under will also continue to grow (albeit at a much slower pace) from 74 million people in 2020 to 80 million in 2060.
Another interesting insight from the Census Bureau is that from 2016–2060, the American-born population is expected to grow by only 20%, whereas the foreign-born population—the share of population who will immigrate to the U.S.—is expected to rise 58%.
True to the melting pot moniker, America’s demographics will continue to change dramatically over the coming decades.
https://www.zerohedge.com/economics/visualizing-americas-changing-demographics-over-past-100-years