
The Urethane Blog
November 1, 2026
Expensive to Import, Hard to Sell: The Middle East PU Market’s Supply-Demand Squeeze
October 27, 2026 4 min read
The Middle East PU market continues to face a difficult balance. Local supply remains limited, while replacing it with imports is expensive. Chinese-origin TDI and PMDI prices have stayed firm, supported by high import costs, but downstream manufacturers are struggling to absorb those prices. Material is still moving into the region; the difficulty is selling it at a workable price and in meaningful volumes.
Buyers are keeping purchases close to current production needs. For traders, committing to a costly cargo involves both a high landed cost and the possibility that customers will delay orders by the time it arrives. These pressures have kept the market active enough to meet immediate requirements, but without a broader recovery in demand.
Firm import prices meet cautious buyers
Mid-October price indications show how costly replacement supply remains for GCC buyers:
| Product | Chinese-origin Middle East price indication |
| TDI | $2,800–3,000/tonne |
| PMDI | $2,700–2,800/tonne |
| Conventional flexible polyol, 3,000 MW | $2,000–2,100/tonne CIF |
TDI and PMDI indications were broadly unchanged recently. Flexible polyol prices were also stable after Chinese export quotations rose earlier in October. The lack of another increase offers buyers some relief, but current levels remain difficult for many downstream businesses.
TDI illustrates the problem particularly well. Chinese-origin imports continue to play a major role in GCC supply, yet flexible foam producers have resisted higher prices and kept orders focused on immediate production. PMDI faces a similar limit: restricted regional availability supports firm import indications, while cautious purchasing prevents that firmness from turning into stronger trade. For flexible polyols, stable offers have likewise brought little incentive for buyers to rebuild stocks while affordability remains a concern.
Limited local supply keeps the region dependent on imports
Sadara’s PU production has not returned to normal. Although a small part of the large complex is operating, that activity has not restored regular local MDI, TDI and polyol supply. Earlier expectations of a broader return by the end of September have given way to continued uncertainty over when these materials will again be available consistently.
Local stocks can cover some customers, particularly established buyers in Saudi Arabia, but buyers across the wider Middle East still rely on traders or direct imports. That dependence leaves them exposed to Chinese supplier prices, shipping costs and delivery times.
Market reports have also suggested that Dow may consider selling its 35% stake in Sadara. Aramco, already the majority owner, has been mentioned as a possible buyer and could become the sole owner if it acquired Dow’s stake. Some in the market wonder whether the unresolved ownership discussions are contributing to the cautious pace of production, although there is no confirmation of a connection. For buyers, the immediate issue remains the absence of a dependable return of local PU supply.
Freight keeps replacement costs high
Ocean freight from China to the Middle East remains expensive. Recent quotations for a 40-foot container imply an ocean freight cost of roughly $400 per tonne to Jebel Ali and around $500 or more per tonne to Saudi destinations, assuming a 23-tonne cargo load.
| Shanghai to | Recent ocean freight, 40-foot container | Approximate cost at 23 tonnes |
| Jebel Ali | $9,000 | $391/tonne |
| Jeddah | $11,433 | $497/tonne |
| Dammam | $12,333 | $536/tonne |
Freight has stayed high even without a sharp further increase in recent weeks. Saudi routes carry a particularly heavy burden. Inland transport, handling and other charges can add to the cost, while long transit times make it harder for traders to match incoming cargoes to customers’ changing needs.
This freight table shows the shipping burden on an illustrative container load. Across all three products, though, expensive logistics remain a central part of the region’s supply problem.
High costs continue to restrain downstream demand
The market’s difficulty is not simply a shortage of material. Downstream manufacturers also need finished-product orders that justify buying expensive raw materials. Flexible foam, insulation and other PU users are sensitive to both the product price and the cost of getting it delivered. When those costs rise faster than customers will accept, manufacturers limit purchases and avoid building inventory.
This leaves the market in a persistent squeeze. Restricted local production and costly imports keep TDI, PMDI and polyol replacement prices firm. At the same time, weak downstream purchasing limits trading volumes. Buyers may need material for current orders, but many have little reason to commit to larger quantities at today’s costs.
Conditions differ across nearby markets. Egyptian activity has improved in some areas, yet available stocks and competitive local offers continue to restrain prices. In East Africa, high material costs and shipment delays have affected affordability, although the approaching seasonal period could bring more activity. Neither market should be used as a direct measure of Gulf demand, but both show how supply costs and customers’ ability to pay can pull prices in different directions.
What could change the balance?
A sustained return of local PU production would reduce dependence on costly imports. Lower Chinese-origin product prices, cheaper freight or both would make replacement material more affordable for downstream manufacturers. Demand is unlikely to strengthen substantially unless buyers can obtain raw materials at delivered costs their own customers can support.
Until that happens, the Middle East PU market is likely to remain caught between firm import prices and restrained purchasing. Cargo can move, but expensive supply is still proving hard to sell.
October 29, 2026
BASF forecasts €7.4B-€7.8B 2026 EBITDA before special items while keeping €1.5B-€2.3B free cash flow range
Oct 28, 2026, 8:11 AM ETBASF SE (BASFY) Stock, BFFAF StockAI-Generated Earnings Calls Insights

Earnings Call Insights: BASF SE (BASFY) Q3 2026
Management View
- “Before we start the discussion of our Q3 results, I would like to address the possible combination of BASF and Evonik upfront.” (CEO & Chairman of the Board of Executive Directors Markus Kamieth) “A potential combination with Evonik would be a logical and meaningful step in this direction.” (CEO & Chairman of the Board of Executive Directors Kamieth) “We will only pursue a potential transaction if it is value accretive for our shareholders. We will not overpay.” (CEO & Chairman of the Board of Executive Directors Kamieth)
- “BASF delivered another strong quarter with considerable growth in EBITDA before special items driven by all core businesses.” (CEO & Chairman of the Board of Executive Directors Kamieth) “Disciplined capital allocation enabled us to further reduce net debt, strengthen our balance sheet and continue our share buybacks.” (CEO & Chairman of the Board of Executive Directors Kamieth) “The strong year-to-date performance of our core businesses gives us confidence to narrow our forecast range for EBITDA before special items upward.” (CEO & Chairman of the Board of Executive Directors Kamieth)
- “We divested the Decorative Paints business in 2025 and completed the transaction with Carlyle in 2026 at a combined multiple of 13x, resulting in net cash inflows of more than EUR 6 billion.” (CEO & Chairman of the Board of Executive Directors Kamieth) “The preparations for the planned IPO of Agricultural Solutions are on track, giving us confidence that the business will be IPO-ready by mid-2027.” (CEO & Chairman of the Board of Executive Directors Kamieth)
- “At EUR 6.4 billion, EBITDA before special items increased by more than EUR 900 million compared with the prior year period.” (CFO & Chief Digital Officer Dirk Elvermann) “Net income came in at EUR 5.2 billion, including the disposal gain of EUR 3.5 billion after tax from the Coatings transaction with Carlyle.” (CFO & Chief Digital Officer Elvermann)
Outlook
- “We expect EBITDA before special items of between EUR 7.4 billion and EUR 7.8 billion.” (CEO & Chairman of the Board of Executive Directors Kamieth) “Compared with our previous forecast, we have raised the lower end of the range and slightly increased the upper end.” (CEO & Chairman of the Board of Executive Directors Kamieth)
- “Given the continuing uncertainty surrounding further geopolitical and global economic developments and their impact on oil and gas prices, in particular, we maintain the forecast range for the free cash flow of between EUR 1.5 billion and EUR 2.3 billion.” (CEO & Chairman of the Board of Executive Directors Kamieth)
- Compared with the prior quarter, “we now anticipate EBITDA before special items of between EUR 6.9 billion and EUR 7.7 billion in 2026” (CEO & Chairman of the Board of Executive Directors Kamieth, Q2 2026) shifted to “between EUR 7.4 billion and EUR 7.8 billion” (CEO & Chairman of the Board of Executive Directors Kamieth, Q3 2026), while the free cash flow range stayed “between EUR 1.5 billion and EUR 2.3 billion” (CEO & Chairman of the Board of Executive Directors Kamieth, Q2 2026; CEO & Chairman of the Board of Executive Directors Kamieth, Q3 2026).
October 29, 2026
Wanhua Chemical’s Q3 Profit Rises 84% as Polyurethane Sales Top RMB 70 Billion
October 29, 2026 1 min read

Wanhua Chemical reported third-quarter revenue of RMB 66.55 billion, up 24.80% year on year, while net profit attributable to shareholders rose 84.38% to RMB 5.60 billion. Profit growth accelerated from the 64.35% increase recorded in the first half, although revenue growth eased from H1’s 31.26%.
For January–September, Wanhua’s revenue reached RMB 185.87 billion, up 28.87% year on year. Attributable net profit climbed 70.99% to RMB 15.66 billion, exceeding the company’s full-year 2025 profit.
| Period | Revenue | Year-on-year change | Attributable net profit | Year-on-year change |
| H1 2026 | RMB 119.32bn | +31.26% | RMB 10.06bn | +64.35% |
| Q3 2026 | RMB 66.55bn | +24.80% | RMB 5.60bn | +84.38% |
| Jan–Sep 2026 | RMB 185.87bn | +28.87% | RMB 15.66bn | +70.99% |
Polyurethane series products generated RMB 70.37 billion in sales revenue over the first nine months. Wanhua reported production of 5.2 million tonnes and sales volume of 5.1 million tonnes for the series during January–September, including material used internally between product series.
Wanhua said polyurethane prices fluctuated upward in Q3. Average market prices were approximately RMB 21,200/tonne for pure MDI, RMB 17,000/tonne for polymeric MDI and RMB 16,800/tonne for TDI. Flexible polyether polyols averaged around RMB 10,000/tonne. The company cited recovering demand in some end uses and support from exports, while noting that domestic flexible-polyol sales remained weak.
The figures show that Wanhua maintained strong earnings growth through September, despite uneven conditions across polyurethane applications. Its Q3 profit increase outpaced its revenue growth, extending the improvement reported in the first half.
Source: Wanhua Chemical’s 2026 third-quarter report
October 25, 2026
First Signs Of A Deeply Frozen Housing Market
by Tyler Durden
Saturday, Oct 24, 2026 – 07:30 PM
Authored by Milan Adams via Preppgroup,
At a glance
- Existing-home sales have run roughly a third below their pre-2020 level for three years, while the median price has repeatedly set records – a combination that ordinary market logic does not predict.
- A large majority of outstanding mortgages carry rates below 5 percent. Selling means trading a cheap loan for an expensive one, and the households with the strongest finances are the least willing to make that trade.
- The housing shortage is a permission problem as much as a land problem. Reforms that legalize construction take three to five years to produce occupied houses, which is longer than most political cycles.
- Insurance premiums, climate exposure and condominium assessments now shape the monthly cost of owning a home at least as much as the purchase price does – and they vary enormously from one ZIP code to the next.
Introduction
American housing has spent three years doing the strangest thing a market can do: nothing.

Not collapsing, not recovering, not clearing. Sales fell by roughly a third from their pandemic peak and then stayed there, year after year, while prices kept grinding upward and the number of homes changing hands in a twelve-month window dropped to a level last seen in the mid-1990s, when the country had some seventy million fewer people living in it. Read only the median price and you would conclude that little has happened. Try to buy or sell a house and you would know better.
The standard vocabulary fits badly here. Bubble implies something inflating toward a pop. Correction implies a direction of travel. Crash and recovery both assume motion. What exists instead is a standoff between two groups with almost no reason to trade with each other. Owners sit on loans at rates that no longer exist, on houses that keep gaining value, in neighborhoods where the monthly cost of staying put is fixed and known. Buyers look at the same properties and see payments several hundred dollars a month higher than what the current occupant pays for the same roof. Neither side is in trouble. Neither side has an incentive to move first.
What that produces is a stall rather than a crash. Transactions thin out, the handful of houses that do sell are the best of a very small pool, and the steady flow of comparable sales that tells everyone what a home is worth slows to a trickle. Appraisers begin valuing against data months out of date. Agents leave the business because there are no commissions. Lenders cut staff because there are no loans. Aggregated into a national median, all of it can look almost like business as usual, which is part of why the situation has lasted this long without anyone declaring it.
Four forces built it, and only one is the interest rate. Cheap mortgages issued during the pandemic trapped existing owners in place. Rates that rose four percentage points in about eighteen months made those loans unrepeatable. A decade and a half of underbuilding left too few houses for the households that already exist. And a set of costs unrelated to interest – insurance, property taxes, maintenance, condominium assessments – climbed fast enough to make ownership harder to hold, not merely harder to enter.
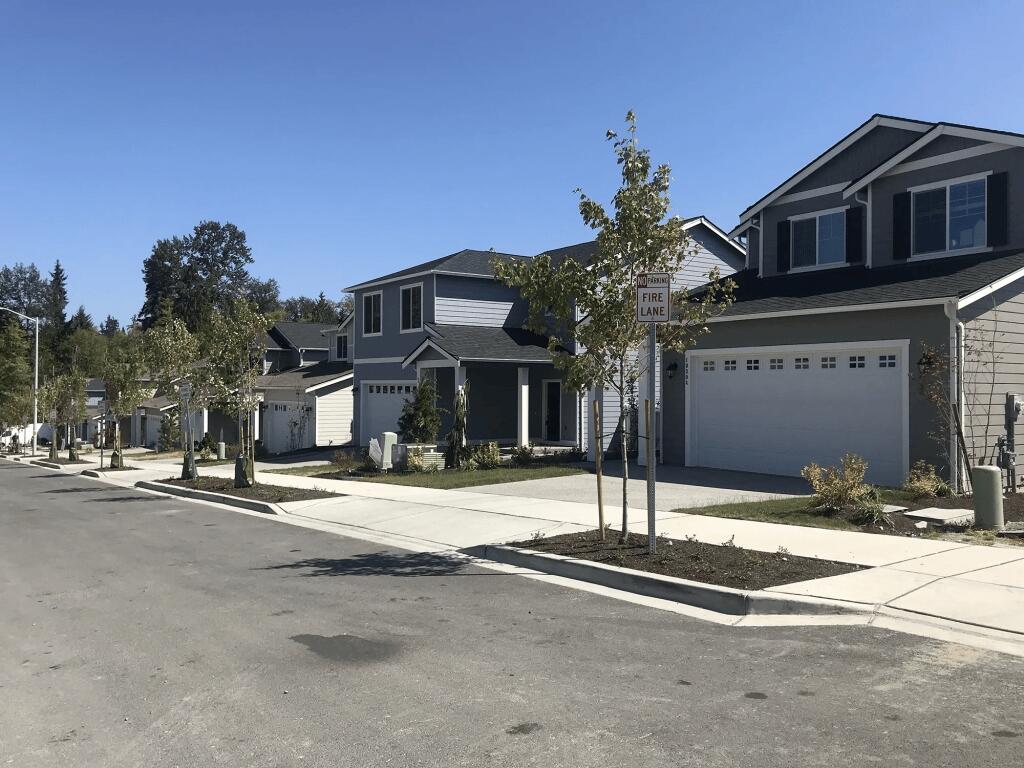
The distributional consequence is the part that matters most and gets discussed least. The country is being quietly sorted by when people bought. Everyone who closed before 2022 sits inside the standoff, insulated, often better off every month than they would be starting fresh. Everyone else stands outside it, paying the price in rent, in down-payment years, in moves not made. That sorting does not show up in any of the numbers the market reports about itself.
A market that has stopped is harder to restart than one that has fallen, because a crash creates buyers and a standoff creates only patience. What follows is an attempt to separate what is measurable from what is inferred, and to say plainly where the evidence is thin.
1. A market that stopped moving
Volume is the first thing to go, and the thing almost nobody watches.
Existing-home sales ran above five million a year for most of the decade before 2020, peaked near 6.5 million during the boom, then fell by about a third and stayed down. New listings in most metros have spent three years below their 2015-2019 averages. Homes now sit on the market longer than at any point since 2012, even as prices rise – a pairing that would have looked incoherent to anyone who learned this market in the 1990s.
Why transaction volume matters more than it sounds
A home sale is not one event; it is a small industry. Appraisers, inspectors, title officers, escrow clerks, loan processors, movers, painters, locksmiths and furniture salespeople all eat from it. When a third of the transactions disappear, a third of that work disappears with them, spread thinly across thousands of small firms with no way to hedge. Businesses built for a market that moves slowly but never stops are not built for one that stops.
Prices, meanwhile, have not followed volume down. In an ordinary slowdown, falling sales eventually drag prices, because sellers compete for a shrinking pool of buyers. Here, supply fell at roughly the same rate as demand, and the ratio between them barely budged. That is the mechanical explanation, and it is worth stating precisely: the number of homes for sale and the number of households shopping for them both contracted, so the balance of bargaining power never shifted far enough to force concessions on price.
Some markets have moved anyway. Austin, where a construction boom added enough units to move both prices and asking rents, is the clearest counterexample, and worth holding onto because it shows the standoff is not a law of nature. It is a consequence of specific local decisions about how much gets built.
📊 The missing transactions. Economists at Fannie Mae and the Federal Housing Finance Agency have separately estimated that the lock-in effect suppressed something on the order of one to one and a half million sales a year. Both figures are model-based estimates rather than counts, and both depend on an assumed “normal” turnover rate, so they should be read as magnitudes rather than precise numbers.
A million and a half household decisions deferred annually does not sound like much against a population of 340 million. It compounds, though. A job not taken because a family could not sell in time. A school district not changed. A business not started in a cheaper city. None of it appears in a price index, and all of it accumulates in the form of a country that moves less than it used to.
2. Most mortgaged owners are sitting on a loan nobody will ever repeat
The foundation was poured in about eighteen months, and it was poured deliberately.
In early 2021 the average thirty-year fixed mortgage rate touched 2.65 percent, the lowest reading in the nearly fifty-year history of the survey. By late 2023 it had passed 7.5 percent. Somewhere between six and seven in ten outstanding mortgages now carry a rate below 5 percent, with a large share below 4. Most of those loans were refinanced in a wave, often more than once, by households doing exactly what the financial press told them to do.
The arithmetic explains a great deal. A household that borrowed $400,000 at 3 percent pays roughly $1,686 a month in principal and interest. The same household buying the same house today at 6.5 percent pays about $2,528. That is roughly $840 more per month, or $10,000 a year, for three decades, on a house that has not changed in any respect. Spread across a household budget, the difference is the entire reason the market stopped.
What makes this cycle unusual is who is refusing to transact. In a normal market, the financially strongest households trade most freely, because they can absorb the friction. Here they trade least. The people with the best credit, the most equity and the least risk are the least willing to surrender a loan that will never be offered again – and a market in which the best-positioned owners decline to participate does not clear, however many buyers show up.
The difference between the math and the mood
There is a temptation to treat this as purely arithmetic, and a corresponding temptation to treat it as purely psychological. Neither is sufficient.
The arithmetic is real: replacing a 3 percent loan with a 6.5 percent loan costs money, every month, for thirty years. But the arithmetic alone does not explain why a household with a growing family, a new job three states away, or a marriage ending would stay put. Those households still move. What has disappeared is the discretionary move – the upgrade to a bigger house, the relocation for a modestly better salary, the trade into a nicer school district – the transactions that used to make the market liquid.
Add transaction costs and the picture sharpens further. Commissions, title insurance, appraisal fees, transfer taxes and moving expenses routinely run into five figures, and they are paid in cash at exactly the moment a household is already absorbing the rate increase. A paper gain of $150,000 in equity is not $150,000 of usable money unless the household sells, and selling means spending real cash to unlock it.
⚖️ Two readings of the same fact. One interpretation holds that owners are trapped by arithmetic and would list if rates fell to roughly 5 percent. The other holds that a large share of them were never going to move, and are using rates as a socially acceptable reason. Both are plausible; surveys about hypothetical moves have a poor record of predicting actual behavior, and the honest position is that the split is unknown.
A wealth effect runs alongside the rate effect and pushes the same way. Owners who bought before 2022 have watched equity grow by six figures without doing anything, and a large unrealized gain is itself an argument against selling. Why trade an appreciating asset for a more expensive version of the same thing financed at a higher rate? For a household content with where it lives, the answer is usually: not now.
3. Almost nothing is for sale, and nobody has a reason to list
High prices are supposed to summon sellers. In this cycle they have not, for a reason almost too obvious to state: the seller is also a buyer.
A homeowner listing in a strong market walks straight into the problem. The next house is expensive too, and the loan on it costs more than the loan being retired. So the seller nets a large gain and hands much of it directly back in the form of a bigger monthly payment, plus closing costs, plus the cost of making a new house habitable. For a household that likes where it lives, the trade is frequently a loss dressed up as a profit.
Active listings remain well below pre-pandemic norms across most of the Northeast, the Midwest and the West Coast. New construction has filled part of the gap, but mostly in the South and the exurbs, at prices first-time buyers struggle to reach. Roughly a third of listings have taken a price cut in recent months, which sounds like weakness until you notice that the cuts are small and the original asking prices were set high. A seller who prices optimistically and cuts twice is not under pressure. A seller who prices low and gets three offers in a weekend is in a different market entirely.
Months of supply – how long it would take to sell everything listed at the current pace – has hovered near four, against a long-run balanced figure closer to six. By that measure this remains a seller’s market, and on desirable houses it behaves like one: multiple offers, waived inspections, dropped contingencies. Yet buyers cannot really afford it, which produces the odd condition of a market that is tight and unaffordable at the same time, with the usual self-correcting mechanism refusing to engage.
Why the loop does not close
Tight supply should raise prices. Higher prices should thin the buyer pool. A thinner buyer pool should bring out more supply. The loop ought to resolve on its own.
It has not, for three years, and the reason is that the supply is not being held back by strategy or sentiment but by arithmetic. Sellers are not withholding houses to force prices up; they are declining to participate in a transaction that costs them money. That is a different kind of restraint from the one markets are built to correct.
Where the mechanism weakens is worth noting. Owners who must sell – because of a job, a death, a divorce, a medical need – sell regardless of rates, and they are the ones absorbing the cost. In markets with heavy in-migration, enough new households arrive to keep pressure on prices even as local owners sit still. In markets with flat or declining population, the same standoff produces visible weakness. The national aggregate averages these together and describes neither.
4. The first-time buyer is now forty
The entry point is where the standoff does its clearest damage, because the entry point is where a market renews itself.
The median first-time buyer is now forty years old, the oldest on record. In the early 1980s that buyer was twenty-nine. First-timers account for roughly a quarter of purchases, the lowest share since the survey began in 1981, and the median down payment has climbed past 10 percent of the purchase price, running considerably higher in expensive metros.
Three factors pushed the entry point out of reach, and only one is the mortgage rate. Price is the largest: the median existing home has spent the middle of the decade near or above $400,000, roughly double its level in 2012. The down payment is second, and it must be saved in cash while rent consumes an ever-larger share of income. Third is competition from buyers who need no mortgage at all and therefore do not care what rates do.
Two different kinds of unaffordability
This distinction matters more than it usually gets credit for. A household can be priced out of ownership in two separate ways, and the remedies are different.
Payment unaffordability. The household cannot cover the monthly mortgage, taxes, insurance and maintenance at current prices and rates. Lower rates or lower prices help directly. This is the constraint most discussion focuses on.
Capital unaffordability. The household could comfortably carry the monthly payment but cannot assemble the down payment and closing costs, because those require accumulated cash rather than monthly cash flow. Lower rates barely help; what helps is savings, family assistance, or a loan product requiring less cash up front.
A household in the second category can be perfectly solvent and still unable to buy for years, which is why affordability metrics built on payment-to-income ratios often understate how tight the entry point has become.
💡 Where the money actually goes. Roughly four adults in ten would need to borrow or sell something to cover an unexpected $1,000 expense. Half of renters are cost-burdened, spending more than 30 percent of income on shelter. Student loan payments, restarted after a three-year pause, compete directly with down-payment savings in the same monthly budget – and they win, because they are due whether or not a house is ever bought.
The result is a queue that moves at half speed. People who would have bought at thirty buy at forty. People who would have bought at forty are still renting at fifty. And behind them sits a cohort that has never known a market in which the arithmetic worked.
Two escape hatches exist and both are narrowing. Family assistance now funds a substantial share of first purchases, which quietly converts homeownership into a question of parentage. Longer terms do the rest – forty-year mortgages, interest-only products, adjustable-rate loans – stretching the monthly payment while raising total interest and shifting rate risk onto the borrower at the point in life when it is hardest to absorb.
5. Cash buys what a mortgage cannot
When transactions are rare, they go to whoever has the fewest constraints, and the fewest constraints belong to people paying cash.
All-cash purchases have run near a third of transactions, well above the historical norm. Roughly 38 percent of owner-occupied homes carry no mortgage at all – a figure that surprises people who assume debt is universal. Institutional buyers, largely absent from the headlines since 2022, have resumed purchasing in Sun Belt metros, and they buy the way institutions buy: in volume, quickly, and often below asking.
The market that results splits in a way the median price never captures. On one side sit households with equity, cash or family money, transacting almost normally and largely indifferent to borrowing costs. On the other sit households dependent on a mortgage at current rates, for whom the same house is a different asset at a different price. The median averages the two groups and describes neither.
Not all cash buyers are the same
Treating them as a single bloc obscures the mechanics. Three distinct groups pay cash, and they behave differently.
Equity-rich movers. Longtime owners rolling gains from one house into the next. They are indifferent to rates but sensitive to price, and they tend to buy the house they intend to live in for a decade.
Downsizers and retirees. Households leaving a larger home, often with no mortgage on either property. Their budgets are fixed and their patience is long, so they wait for the right house and rarely overpay.
Yield-seeking investors, individual and institutional. They buy against a rental return and are therefore sensitive to rents, insurance costs and property taxes – which means they pull back first when those costs rise, and return first when they fall.
The squeeze lands hardest on the entry-level segment: three-bedroom houses in decent school districts, the classic starter home. First-time buyers, cash-rich downsizers and investors all want the same property, and the first group has the least capital and the longest timeline.
6. Builders are building the wrong houses
New construction is the obvious escape valve, and it has not been wide enough to matter.
The country has added roughly 1.3 to 1.4 million housing units a year for most of the decade, against estimates of need running from 1.5 million upward. The cumulative shortfall, by the reckoning of the National Association of Home Builders and a range of independent economists, sits somewhere between three and five million units. Single-family starts turned down again mid-decade as builders worked through unsold inventory, narrowing the valve just as it was needed most.
Costs explain much of the gap. Land, permitting delays and impact fees add tens of thousands of dollars before a shovel touches dirt. Construction labor thinned after 2008, when roughly a million building workers left the trade and never returned, and those who remained are older. Tariffs on imported lumber and components raised material costs at the same moment financing did, squeezing margins from both ends.
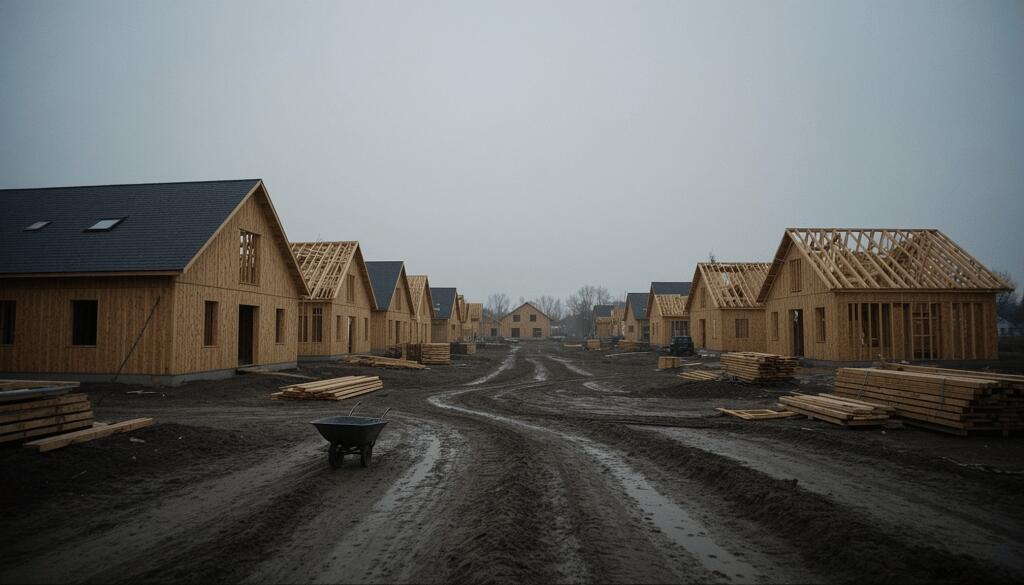
Builders have responded rationally by building the product with the best margin: larger houses, further out, aimed at move-up buyers and retirees who can absorb the price. The starter home – small, plain, close in – has been the hardest to build profitably, and so it is the thing most missing. This is not a failure of imagination. It is what happens when land, labor and money all get more expensive at once and the only way to make a project pencil is to sell a bigger box.
A newer model has grown into the space. Build-to-rent subdivisions, in which whole neighborhoods are constructed and held as rentals, have moved from curiosity to a meaningful share of single-family construction. That solves a real problem by giving households a house without requiring a mortgage. It also means a slice of new supply never reaches the for-sale market – so a country that cannot build enough houses is now building some of them for the wrong tenure.
7. The neighbors hold a veto
The shortage is a permission problem as much as a land problem, and the permission is granted at the end of the street.
Most American residential land is zoned for detached houses on generous lots, and most decisions about what gets built are made by local boards answerable to the people already living there. The arrangement produces stability, predictability and remarkable visual consistency. Over several decades it also produces a systematic shortage of everything except detached houses. Nobody set out to create a shortage. It emerged from a million small decisions, each defensible on its own.
The reforms that worked are instructive precisely because they are unglamorous. Minneapolis eliminated single-family-only zoning and saw rents in affected areas rise more slowly than in comparable cities. Austin approved large volumes of multifamily construction and became the rare metro where prices and asking rents fell. California legalized duplexes and lot splits statewide, then limited local discretion over small apartment buildings near transit. Montana, a state with a rural self-image, passed reforms allowing more units in its cities.
Permission is not the same as completion
This distinction is routinely blurred in policy arguments, and it decides whether reform should be judged a success.
A zoning change produces legal capacity, not houses. The houses arrive three to five years later, financed by a developer who must still secure land, permits, labor and a loan, and who will abandon the project if the arithmetic stops working halfway through. The benefits therefore show up first as slower rent growth rather than lower prices, which is why reforms are so often declared failures in year two and vindicated in year seven.
Opposition, meanwhile, is rarely to density in the abstract. It is to a specific project, a specific parking situation, a specific shadow across a specific garden. That is why the reform that works best tends to be the one that removes discretion rather than the one that wins an argument.
8. An insurance letter can end a mortgage
There is a second front, and it arrives in envelopes.
In Florida, California, Louisiana and parts of Texas, the cost of insuring a house has risen faster than the cost of the house. Premiums in some coastal counties doubled within three years. Carriers withdrew from entire states after strings of bad loss years. Insurers of last resort – Florida’s Citizens Property Insurance Corporation and California’s FAIR Plan – expanded from backstops into major players, with Florida’s state-backed carrier becoming the largest property insurer in the state.
The chain from there is short and mostly automatic. A mortgage lender requires insurance. Where insurance becomes unavailable or unaffordable, the loan becomes harder to obtain, and a house that cannot be financed cannot easily be sold. Owners in the worst-exposed areas increasingly pay cash or go without coverage, which is tolerable until the first storm and then becomes a personal balance-sheet event rather than an insurance one.
Several states have responded with catastrophe funds, faster claims rules and limits on litigation. Those measures have slowed the increase rather than reversed it. Insurance is repricing a risk that was underpriced for three decades, and repricing does not stop because the risk is real and widely acknowledged.
What makes this corrosive to a housing market is its geography. Insurance does not rise evenly. It rises in bands – in floodplains, in fire corridors, along particular coastlines – drawing visible local boundaries between insurable and nearly insurable. A market already sorted by when people bought is now being sorted again, this time by where.
9. Water, fire and heat have entered the appraisal
For a century, appraisal treated climate as a footnote, and for most of that century it was right to.
Flood maps are being redrawn, and the new maps put more houses inside hazard zones. Wildfire models now reach into suburban hillsides long considered safe because they had never burned. Extreme heat, which for most of history never appeared in a valuation, is showing up in insurance loads and utility bills and, increasingly, in whether a buyer will consider a place at all. Non-renewal notices cluster, and where they cluster, closings slow.
Two slower effects follow. Municipal bond markets have begun pricing the tax bases of towns whose exposure is concentrated, which matters because a town that loses ratable value loses services, and a town that loses services loses residents. And a migration has started toward cities with water, mild summers and low hazard – Buffalo, Duluth, Cincinnati, Rochester – none of which currently has the housing supply to absorb a wave, and all of which remain comparatively cheap.
Keep three mechanisms separate
They interact, but they are not the same thing, and confusing them leads to bad conclusions.
| Mechanism | What it does | How fast it acts |
|---|---|---|
| Physical risk | Actual probability of flood, fire or heat damage to a specific structure | Slow, and highly local |
| Insurance pricing | Converts physical risk into an annual cash cost the owner must pay | Fast – months, not years |
| Lender and appraisal response | Converts insurance availability into mortgage eligibility and valuation | Medium – one to two years |
The 2025 Los Angeles firestorm and a run of Gulf hurricanes accelerated all three. When thousands of structures burn in one event and insurers absorb losses in the tens of billions, the next round of premiums is decided by arithmetic rather than by regulators. In exposed areas this shows up first as longer time on market rather than lower asking prices, because a seller with a 3 percent mortgage can afford to wait, and waiting is cheaper than conceding.
10. The condominium bill arrived in the mail
A separate mechanism began with a collapse, and it is still running.
On June 24, 2021, Champlain Towers South in Surfside, Florida, came down at one in the morning, killing 98 people. Investigations pointed to decades of deferred structural maintenance and to reserve funds kept deliberately thin because owners voted for low dues, cycle after cycle, in buildings that looked fine from the outside. Florida responded with legislation requiring milestone inspections and, critically, full funding of reserves for structural items rather than the minimum that would pass a vote.
What followed was an avalanche of special assessments – one-time charges levied on unit owners by the association to cover work the regular dues never funded. Buildings across South Florida, and increasingly elsewhere, were handed six-figure per-unit bills for roofs, facades, plumbing, elevators and concrete restoration. Owners who had bought a condo for $250,000 were asked for $80,000 in cash, on a deadline, in a building they had chosen partly because the dues were low.
Why an assessment breaks a sale
An assessment damages a condo market twice. First, it raises the effective purchase price for any buyer who must reserve cash for a future bill, and lenders increasingly ask about reserve studies before approving a loan. Second, it can force a sale: an owner with modest savings who cannot pay the assessment in cash must borrow, and an owner who cannot borrow must sell into a market where every other unit in the building is facing the same bill.
Older condominiums are the cheapest route into ownership in many cities, which makes this more consequential than it first appears. If the cheapest route becomes expensive to hold, the last affordable rung of the ladder starts to disappear – and it disappears for precisely the households the standoff is already squeezing.
11. Rents have stopped running
For three years after 2020, renting was the pressure valve. Households priced out of buying could rent instead, at a price, and the rental market absorbed the overflow.
That is changing. Multifamily completions reached their highest level in decades, with hundreds of thousands of units delivered in a single year. Asking rents flattened and then declined in many metros, particularly the Sun Belt cities that had seen the sharpest increases, and concessions reappeared in markets that had not offered them in years.
Two consequences follow, and they pull in opposite directions. If rent growth stops, the financial case for buying weakens, because the gap between a rent check and a mortgage payment narrows less than the down payment suggests. And if landlords can no longer raise rents, some sell, adding supply to the for-sale market. Both effects are real and both are small relative to the size of the standoff.
A surplus that is temporary
The rental surge is worth distinguishing from a lasting improvement, because the two are often conflated.
The current wave of completions reflects projects financed in 2021 and 2022, when money was cheap and rents were climbing. Multifamily starts collapsed once construction costs and interest rates rose, so the pipeline empties toward the end of the decade and a brief surplus becomes a renewed shortage. Build-to-rent subdivisions sit in the middle of this, offering a house with a lease instead of a mortgage – an attractive product for households that have given up on buying, and supply that never becomes ownership.
The implication is uncomfortable: the ownership rate can fall even while construction booms.
12. Nobody is moving
The most under-discussed damage is geographic, and it compounds slowly.
In 2023, fewer Americans moved than in any year since the Census Bureau began tracking the figure in 1948 – roughly one in thirteen. Job quits fell to their lowest rate in a decade outside the pandemic. Interstate migration flattened among homeowners while staying high among renters, which is a way of saying that the people with the most to gain from moving are the ones who can least afford to.
When workers cannot move, employers in growing metros struggle to hire, wage convergence between regions stalls, and productivity growth slows in ways that are hard to attribute but real. Local economies built on relocation – moving companies, storage, furniture, home services – shrink. Whole industries lose their customer base without anyone writing about it, because the decline is spread across thousands of small firms rather than concentrated in one visible collapse.
Housing used to be the American answer to a hundred different problems. It let people chase wages, leave a bad marriage, follow a child’s school, retire near family, start over somewhere cheaper after a business failed. A market transacting at half its normal rate withdraws that answer, quietly and without ever announcing it. The country does not lose mobility all at once. It loses it one household at a time, and each household concludes, reasonably, that moving is not worth it right now.
13. The machine underneath
Beneath all of this sits a plumbing problem most borrowers never see, and it explains why mortgage rates no longer fall the way they used to.
The spread between the thirty-year mortgage rate and the ten-year Treasury yield has run far wider than its historical norm, because lenders price in the risk that borrowers refinance the moment rates fall – a risk unusually large when so many loans were written at historic lows. Nonbank servicers, which now handle most of the country’s servicing, carry that prepayment risk on thin capital. Origination volumes fell by more than half from the 2020-21 peak, and lenders cut staff accordingly. Every firm that survives the trough must rebuild capacity before it can handle a refinance wave – which means the industry is structurally slow to respond to the very event everyone is waiting for.
The practical result is that mortgage rates no longer follow the policy rate down in step. A one-point cut in the federal funds rate historically moved mortgage rates by less than half of that, and the transmission has slowed further as the spread widened.
🔎 A self-reinforcing loop. High rates suppress transactions. Suppressed transactions weaken the lending industry. A weaker industry prices loans more expensively. Expensive loans keep the market stalled. Nothing in the loop corrects itself, and it runs in the direction of less activity rather than more.
14. Delinquency without disaster
The obvious worry is that a stalled market eventually breaks the way 2008 broke. So far it has not, and equity is the reason.

FHA and VA delinquencies have crept up from pandemic lows while remaining well below 2009 levels. The typical mortgaged homeowner holds several hundred thousand dollars of equity, and total homeowner equity sits in the tens of trillions. Foreclosure starts, after a long pause, normalized at modest levels. In 2008, owners owed more than their houses were worth and were forced to sell into a falling market. Today they owe far less and are choosing not to sell.
Equity is not the same as cash
This distinction explains why a household can look wealthy on a spreadsheet and still feel squeezed.
Home equity is the difference between the market value of a house and the debt secured against it. It is large, it grows, and it is entirely illiquid unless the owner sells or borrows against it.
Liquidity is the cash available in a given month. It is small, it does not grow with house prices, and it is what pays for a new roof, a medical bill, or a car repair.
A household can hold $300,000 of equity and still fail to cover a $3,000 furnace replacement without a credit card. That is why the equity cushion prevents foreclosures without preventing hardship – and why delinquency and distress can rise together even as balance sheets look healthy.
Stress is showing up where you would expect it if the problem were affordability rather than leverage: auto loan delinquencies are at their worst since 2010, credit card balances have risen steadily, and some owners are borrowing against equity to cover ordinary expenses, converting a housing asset into a spending account at the moment it is the only thing appreciating.
15. Two markets sharing an address
By now the shape is clear, and it is less a single market than two sharing an address and a postal code.
Inside sit households that bought before 2022, holding cheap loans, large equity and fixed housing costs. Their situation is stable and, on paper, improving. They are insulated from the thing everyone calls a housing crisis, and many do not experience it at all. Outside sit everyone else: renters saving against rising rents, first-time buyers aged forty competing with cash offers, families stuck in two bedrooms, workers who cannot relocate, retirees who cannot downsize, divorced households maintaining two residences because neither party can absorb the transaction cost.
Both groups read the same median price as two different facts, and they respond to the same interest rate in opposite directions. A rate cut helps the outsider and tempts the insider, which means policy that helps one usually does so at the expense of the other. Making buying cheaper also makes holding more valuable, and holding more valuable reduces the supply of sellers.
The distributional effect is the part worth carrying forward. A market that transacts at half its normal rate distributes opportunity unevenly across cohorts in a way that will outlast the rate cycle. Households that entered before 2022 begin accumulating equity a decade earlier than those behind them, and equity compounds. The gap does not close when rates fall; it widens, because the people inside the market are the ones who benefit from its recovery.
16. How a standoff ends
History offers two exits, and they look nothing alike.
In the 1980s, mortgage rates touched 18 percent, transactions collapsed, and the market stayed quiet for years. Nominal prices barely fell; real prices were ground down by inflation while owners sat still. The standoff ended when rates came down, which took most of a decade. The mid-2000s produced no standoff at all, because credit was loose enough that everyone transacted until the whole thing broke. The similarity to the 1980s is meaningful – a long, quiet, inflation-eroded plateau. The difference is that today’s owners carry far more equity and far better credit than their 1980s counterparts, which makes forced selling less likely and a long plateau more likely.
What could change the trajectory
| Scenario | What would have to happen | Likely effect |
|---|---|---|
| Slow thaw | Rates drift toward 5 percent; incomes outpace prices | Listings rise gradually; volume recovers over several years |
| Rate-driven unlock | A sharp, sustained drop in mortgage rates | Short burst of activity, then renewed shortage as supply is absorbed |
| Supply-led relief | Sustained construction plus zoning reform | Rent growth slows first; price effects appear after three to five years |
| Cost-driven stress | Insurance and taxes keep rising faster than incomes | Weakness concentrated in exposed metros while the rest stays frozen |
A rate cut to 5 percent would unlock a meaningful share of owners who say they would move at that level, and would do more than any policy currently on the books. Income growth outpacing prices would repair affordability slowly, without a dramatic moment. Zoning reform, construction and condo repair would help on a five-to-ten-year horizon, which is longer than most political cycles. Insurance and tax policy would determine where recovery happens rather than whether it happens.
The likeliest path is a slow thaw rather than a break – but it is a forecast, not a certainty. It assumes rates fall without a recession, that incomes keep pace, and that insurance costs stabilize. If any of those fails, the plateau simply extends.
Closing
What makes this situation unusual is that it is nobody’s fault and everybody’s doing. Millions of households made individually sensible decisions – refinancing at 3 percent, staying put, holding an appreciating asset – and those decisions aggregated into a national paralysis.
The market has not broken. It has stopped. That difference matters because a crash creates buyers, and a standoff creates only patience – and patience, unlike a crash, has no natural end point.
🔭 What to watch next. Four indicators would confirm or challenge this analysis: the share of outstanding mortgages below 5 percent (falling means the lock-in is decaying); months of supply (rising above five means sellers are capitulating); insurance premium growth in coastal metros (slowing means the cost shock is easing); and the Census Bureau’s annual mover rate (recovering means the geographic damage is repairing). None of these turns quickly, and all four would need to move together for the picture to change.
The signs are quiet, and easy to walk past. A street where two houses sold in three years. A thirty-eight-year-old on a good salary who still cannot assemble a down payment. A condo board meeting where the agenda is a roof and the number has six figures in it. A moving truck parked for a single day on a block where ten families used to come and go.
https://www.zerohedge.com/personal-finance/first-signs-deeply-frozen-housing-market
October 22, 2026
Dow Inc. (DOW) Q3 2026 Earnings Call Transcript
Oct 22, 2026, 1:17 PM ETDow Inc. (DOW) Stock

Dow Inc. (DOW) Q3 2026 Earnings Call October 22, 2026 8:00 AM EDT
Company Participants
Andrew Riker – Vice President of Investor Relations
Karen Carter – CEO & Director
Jeffrey Tate – Chief Financial Officer
Karen Carter
CEO & Director
Thank you, Andrew. Our solid third quarter performance reflects the discipline and focus of Team Dow as we build a stronger company while navigating a dynamic market environment. We continue to partner with customers in attractive growth markets while also improving productivity and strengthening cash generation. And our collective self-help measures, which include the completion of our $1 billion 2025 cost savings program, the beginning of our previously announced European asset shutdowns and our transformation are all delivering tangible results. In the third quarter, that execution translated into meaningful progress and strong performance in many areas of our portfolio.
Net sales were up 13% year-over-year with growth in every operating segment. Operating EBITDA was more than $1.5 billion as pricing actions and self-help measures more than offset higher raw material and logistics costs to drive year-over-year growth. Together, our actions and the results they are delivering help reinforce Dow’s earnings power. They strengthen our financial position while also enabling us to build a more competitive company for the long term. Transform to Outperform continues to deliver benefits ahead of our initial schedule, and we remain on track to achieve approximately $700 million in growth and productivity improvements this year. We also completed significant planned maintenance during the third quarter, which will support stronger production and earnings performance heading into the fourth quarter and beyond. And we are optimizing our working capital and actively prioritizing debt reduction with excess cash. This reinforces our continued focus on financial discipline and operational execution.
Next, turning to the portfolio. Let me highlight the greatest areas of strength. First, in the Packaging & Specialty Plastics segment, we’re maintaining higher pricing for polyethylene and functional polymers in all regions, and we delivered sequential volume gains. In the Industrial Intermediates & Infrastructure segment, increased demand for energy applications and AI infrastructure is supporting improved pricing and margins. And we are seeing growth in the Performance Materials & Coatings segment, driven by consumer, electronics and home care applications. This quarter, we also saw volume gains in Europe as well as in Latin America and the United States and Canada, all while the macro conditions remained dynamic. Moving forward, our focus remains on improving shareholder returns through self-help actions, better cash generation and a stronger balance sheet.
Jeffrey Tate
Chief Financial Officer
Thank you, Karen. Starting with our Packaging & Specialty Plastics segment on Slide 4. Net sales were $5.8 billion, up 18% versus the year ago period. Operating EBIT was approximately $585 million, which represents an increase of more than $385 million compared with the same period last year. This was primarily driven by higher polyethylene prices, improved integrated margins and benefits from our self-help initiatives. The Packaging & Specialty Plastics business delivered higher net sales driven by polyethylene and functional polymer price gains in all regions. Polyethylene prices rebounded in the second half of the quarter, supported by elevated feedstock costs and demand remained resilient as evidenced by year-over-year volume growth, excluding supply constraints related to the Middle East conflict.
Polyethylene volumes were notably strong in pipe applications, led by gains in infrastructure-related applications in Europe, the Middle East, Africa and India. Higher net sales in the Hydrocarbons & Energy business were driven by increased pricing. We also saw increased olefins volumes after restarting our lowest cost, most flexible cracker in Terneuzen following an idling due to planned maintenance. As a result of having this asset back online, we delivered record LPG consumption in Europe in the third quarter, capitalizing on feedstock dynamics.
Next, I’ll turn to Slide 5, which outlines the strong year-over-year earnings improvement in our Industrial Intermediates & Infrastructure segment. Net sales were $3.1 billion, up 8% versus the year ago period, driven by a 16% increase in local price. This reflects gains across both businesses and all regions.
Operating EBIT improved to $176 million, reflecting an increase of $223 million versus the same quarter last year. This was driven by higher margins and benefits from our self-help initiatives. Polyurethanes & Construction Chemicals recorded higher sales, driven by stronger pricing in MDI and propylene oxide derivatives across Europe and the United States and Canada, reflecting constrained supply dynamics in the period. Additionally, volume and EBITDA growth in Industrial Solutions was fueled by robust demand for AI infrastructure and energy applications, where favorable trends continue to support the segment’s momentum.
Moving to Performance Materials & Coatings on Slide 6. We saw solid top line and EBITDA growth in the third quarter. Net sales were $2.3 billion, up 8% versus the same quarter last year. This included volume improvements in both businesses, which was led by downstream silicones. Operating EBIT was $154 million. The team delivered both price and volume gains as well as benefits from our self-help initiatives, including cost savings associated with the second quarter shutdown of our Barry siloxanes unit. Consumer Solutions had double-digit sales and EBITDA growth in the Americas. This was largely driven by downstream silicones volume gains in all regions. And the Coatings & Performance Monomers business delivered higher sales across all regions, led by price and volume gains in both acrylic monomers and Architectural Coatings.
Next, on Slide 8, I’ll walk through some details that support our overall view that underlying demand is steady, while the macroeconomic environment remains challenging. We continue to see resilience in packaging globally as well as electric vehicle growth in Asia and Europe. At the same time, higher interest rates and weaker consumer confidence continue to pressure demand for products tied to housing. Across regions, Dow’s footprint in the Americas remains advantaged, supported by our favorable feedstock position and continued high operating rates in the U.S. Gulf Coast. In Europe, persistently high energy costs continue to challenge industry economics and broad-based petrochemical closures are accelerating. In Asia, demand remains mixed. Strength in electronics is helping offset softer consumer spending and real estate markets. Lastly, in the Middle East, while oil supply concerns have eased from levels we saw earlier this year, risk to trade flows in energy markets remain elevated as do freight and other transportation costs with increased pressure on tanker and diesel prices.
Karen Carter
CEO & Director
Thanks, Jeff. Above all, our focus is on building a more competitive Dow that delivers improved long-term value. That comes down to 3 priorities: winning with customers in attractive growth markets, strengthening our portfolio’s competitiveness and maintaining a balanced approach to capital allocation. And importantly, our self-help commitments underpin all 3. I’ll start with our progress on Transform to Outperform on Slide 11, then we’ll walk through how these priorities guide our growth investments, portfolio decisions and financial discipline.
Dow’s transformation is contributing significant gains as part of our overall approach to continued self-help. These efforts are effectively resetting our cost structure and establishing a more targeted approach to sustained growth. As I mentioned earlier, we expect to deliver approximately $700 million this year, which is higher than our initial projections. Let me highlight a few timely examples of where this work is having an impact. As the way we work continues to evolve, so do our expectations for where and how work gets done.
We are enabling faster decision-making and putting the right roles in the right areas of the company. This includes the reduction of approximately 4,500 Dow roles. To date, we have implemented approximately 70% of those reductions, and we expect to substantially complete this phase of the transformation by year-end. At the same time, we are driving productivity improvements of approximately $150 million in benefits in the second half of this year. This includes deploying a repeatable site transformation playbook at our largest sites, which remains focused on maintenance productivity, energy efficiency and asset utilization. For example, recent improvements at a U.S. Gulf Coast site helped to cracker achieve durable record high production, which ultimately adds low-cost capacity and strengthens supply reliability for downstream customers.
On the growth side, we are establishing platforms and teams that bring Dow’s technologies and expertise together around attractive end markets like AI infrastructure and mobility. By pairing Dow’s materials science expertise, technical service and digital tools with customers’ own innovation goals, the platforms move us from supplier to partner. This helps customers innovate better and faster while earning Dow higher value and more stable growth. And we are using data more efficiently to ensure stronger commercial pipeline discipline. As a result, our teams have earlier visibility into customer opportunities and stronger insights, allowing us to quickly prioritize the opportunities that have higher value potential.
This also helps us decide sooner which opportunities not to pursue, allowing us to focus Dow’s resources where we are best positioned to win. These are just a few examples, and we remain committed to advancing all of our self-help measures to deliver material improvements in the near term. We’re doing so while also executing on each of our priorities, beginning with focused growth and innovation on Slide 12. Dow’s downstream silicones business illustrates our approach well. We are investing in applications and projects that serve fast-growing markets. Many of the incremental growth investments we have made in silicones specifically are expected to pay back in 2 to 3 years. For example, our closed-loop liquid cooling systems and advanced thermal fluids are serving markets that are growing at double-digit rates.
Our technologies are helping to solve important challenges for hyperscale servers and our thermal interface materials and engineered silicones are used in semiconductor packaging and power electronics. In mobility, the opportunities for Dow are driven by a growing EV market in Europe and Asia as well as the amount of silicon used in each vehicle. EVs contain approximately 3x as much silicone as a traditional internal combustion model. And Dow materials are used in critical applications that protect cameras and sensors as well as support battery pack assembly and thermal management. When it comes to how we think about growth and innovation, the bottom line is this. Dow teams are advancing from expanded customer development capabilities to new production capacity in key markets, and we are doing so with a clear focus on capital discipline and faster payback projects.
Turning to Slide 13. We’re strengthening the competitiveness of Dow’s portfolio by intentionally shifting our investments toward differentiated applications and advantaged production while also exiting higher cost upstream capacity. And while this particular slide doesn’t provide a [ complete list ], I’d like to share some key examples. First, we’re improving the cost position of our manufacturing footprint. We restarted our lowest cost and most flexible cracker in Europe in the second quarter, while also completing the shutdown of our higher-cost energy-intensive Barry siloxanes unit in the United Kingdom. Both actions contributed to improved third quarter earnings. At the same time, we’re investing in downstream applications where our differentiation matters to customers. More specifically, our Poly 7 polyethylene unit in the U.S. Gulf Coast supports specialty packaging as well as health and hygiene applications where demand remains resilient.
And our alkoxylation investments in the United States and Europe support growth in our Industrial Solutions business, which serves home care, pharmaceutical and energy markets. In silicones, we’re expanding capabilities across the U.S., China and Japan to serve electronics and mobility markets, including engineered silicone and silicone rubber capacity expansions. Our asset actions include both closures and prudent growth investments. Taken together, they form one integrated portfolio strategy. We have completed a number of key actions and expect to advance more through next year. Next, Jeff will discuss our third priority, balanced capital allocation and the actions we are taking to strengthen Dow’s financial position for the long term.
Frank Mitsch
Fermium Research, LLC
I was curious if you could update us on Sadara. There were obviously press reports early last month that suggested you were looking to exit the partnership. So I was wondering if you could comment on what the future is of Sadara within Dow’s portfolio? And also, if you could provide any update in terms of how those assets are given the Iran war.
Karen Carter
CEO & Director
Yes. Thanks, Frank, for the question. I think our message is the same as we shared on the call last quarter, we remain really engaged with Aramco. Jim is leading that negotiation team in his new role as Exec Chair. We’ve been really clear, I think, on the last call that we’ve established a financial boundary around Sadara, and we’re working diligently to identify the best long-term solution. Obviously, we’ve already made progress on 2 really important fronts. In the first quarter, as you know, we suspended further recognition of Sadara equity losses. And then we also limited our funding commitment to about $1.3 billion, and that continues to come down. So we should think about that $100 million a year as we move that down. So that’s where we are. And again, those negotiations continue. What I would say about the assets there is that they are running, not all of them. Some of them are running at reduced rates, as you can imagine, for the obvious reasons.
Harris Fein
Wolfe Research, LLC
This is Harris Fein on for Chris. Just a quick one on II&I. Just thinking about the outlook for MDI and some of the propylene oxide derivatives now that we’ve — we’re moving past some of your competitors’ outages. I guess, ignoring normal building and construction seasonality, has anything changed in terms of your price expectations? And I know there was a little bit of a restocking story because of the outages. Are you seeing that your customers are fully restocked? Or is that still ongoing?
Karen Carter
CEO & Director
Yes, it’s a good question, Chris, and thank you for it. I mean overall markets, to your point, do remain soft. As you know, 40% of the MDI end market is around building and construction, and that continues to be the weakest end market for us across the company. And so our expectation is in fourth quarter, we do expect to move back to a longer market with the resolution of industry supply disruptions — but also the recent start-up of new capacity here in North America. So the bottom line on MDI is that the market still remains challenging, mainly driven by the weak demand in building and construction and just a low demand environment overall for that segment, which is exacerbated by the new capacity additions. And so longer term, we expect gradual operating rate improvement through 2030, but that’s our view on fourth quarter right now.
Arun Viswanathan
RBC Capital Markets, Research Division
I guess I just wanted to get your thoughts on maybe global utilization rates across your 3 main chains, polyethylene, polyurethanes and silicones. It appears that we’re maybe in the mid-80s and there hasn’t really been any material closures. Would you agree with that? And would you also agree with the statement that China has increased their production pretty significantly in most of those chains, and that’s also impacting pricing negatively?
Karen Carter
CEO & Director
So let me start with ethylene and polyethylene. We do feel like and believe that operating rates today are in the low 80s. And so — and I think I’ve said this before, we believe that we could get back to mid-cycle rates by the end of the decade. And there’s a couple of reasons for that. Based on even where we were before the conflict, you needed about 10% of capacity to come out in order to materially get back to mid-cycle operating rates. 5% to 6% of that has already been announced, and that includes our cracker in Europe. There’s another about 8% that’s being speculated. Most of all of that are in high-cost regions. And so Asia as well as Europe. Recently heard in the last couple of months that there’s another 1 million tons that’s been confirmed to come out from Korea. And so you’re seeing the rationalizations.
And of course, we know that there’s capacity that’s coming online. But the other part of the story is that polyethylene continues to grow at a factor above GDP. So I would call industry operating rates on the ethylene side today in the low 80s. And again, we believe that we can get back to mid-cycle operating rates by the end of the decade, which also aligns, by the way, with the timing of our Alberta asset that, again, the first phase will come up in 2029. On the siloxanes and the silicones side, it’s a bit of a tale of 2 cities. So upstream, you’re absolutely right. China has added a significant amount of capacity. It’s one of the reasons why we took out our high-cost siloxane capacity in Barry U.K. in the second quarter of this year. Just as a reminder, that’s going to add $60 million of EBITDA in the second half of the year alone. But it’s really important to emphasize that downstream silicones continues to grow significantly, directly aligned with a number of megatrends, whether you’re talking about electrification, but also obviously, AI infrastructure.
So we are seeing that. Most of our end markets in silicones are growing double digits, and that’s showing up not only on our order books, but also on the bottom line. And then I think I just talked about MDI, one of the — of course, one of the key value chains where you’re seeing overcapacity for sure, being built in Europe. We’ve taken out both in [ PO ] in particular, we’ve taken out assets there as well. But again, working to rightsize our capacity across the entire portfolio with the profitable demand on — particularly on the downstream. But we continue to see strength in ethylene and polyethylene in particular, and in downstream silicones and a number of other ethylene derivatives.
 Everchem Updates Archive
 Sign Up for Email Updates