Urethane Blog
Housing Is Resilient
July 21, 2020
5 Reasons Why US Housing Has Been The “Shining Star” Of The Covid Crisis
by Tyler Durden Tue, 07/21/2020 – 14:27
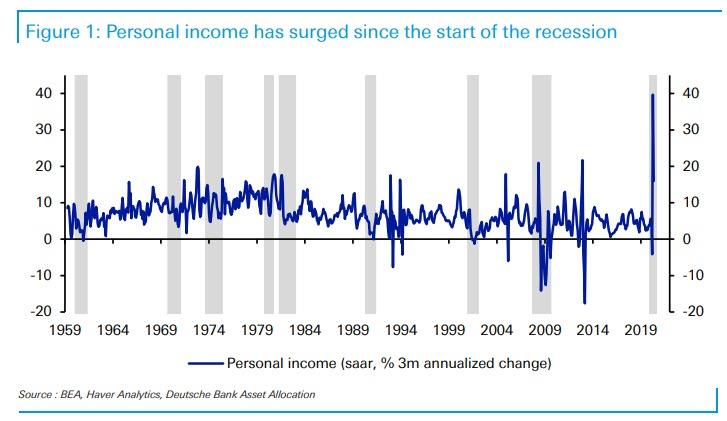
Two weeks ago we posted a chart from Deutsche Bank, which showed that contrary to previous economic contractions, the current one has been a clear outlier in that personal income has surged instead of fallen, as it usually does during slowdowns…

… despite tens of millions of newly unemployed workers, leading to what Deutsche Bank’s Jim Reid called “the strangest recession in history.” This has been almost entirely due to extremely generous government stimulus checks and unemployment benefits, although as we noted previously, the $600 per week in Federal Pandemic Unemployment Compensation (FPUC) is set to expire at the end of July, while the Pandemic Emergency Unemployment Compensation (PEUC) and Pandemic Unemployment Assistance (PUA) will also expire at the end of this year. It is widely expected that these will be replaced with a similar, if perhaps less generous stimulus program to take advantage of the $1.8 trillion in excess cash currently parked at the Treasury which Trump will be eager to spend before the recession.
However, which personal income has truly been a historic outlier, the current recession is also unique for one other reason: a housing market that has been on a tear – the “shining start in the economic recovery” according to BofA economists – and has stubbornly refused to succumb to the economic weakness.
As Bank of America writes, while home sales and construction fell sharply during the national lockdown in the spring, it has since bounced strongly with mortgage purchase applications rising above pre-COVID-19 levels and NAHB homebuilder sentiment flirting with record highs. Meanwhile, new home sales have recovered 49% (May) of the peak-to-trough loss and housing starts 37% (June), and in short order, we should see starts and sales fully recover to pre-COVID-19 levels or beyond.
The natural question is why the housing market was able to bounce so quickly in the face of an historic shock which left 22 million people unemployed? Here BofA offers five explanations:
- An uneven recession: the shock disproportionally impacted the lower income population who are less likely to be homeowners. Consider that 55% of households earning less than $35K a year lost employment income vs. only 40% of those earning $75K and above. According to the NAR, the median household income of recent homebuyers is $93k.
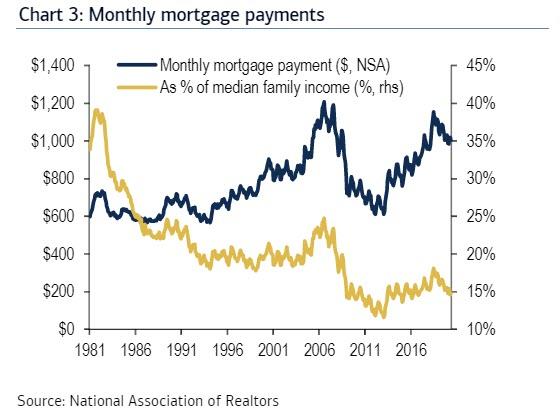
- Record low interest rates: mortgage rates reached a new historic low last week. Average monthly mortgage payments have declined by $80/month relative to this time last year due to lower mortgage rates.
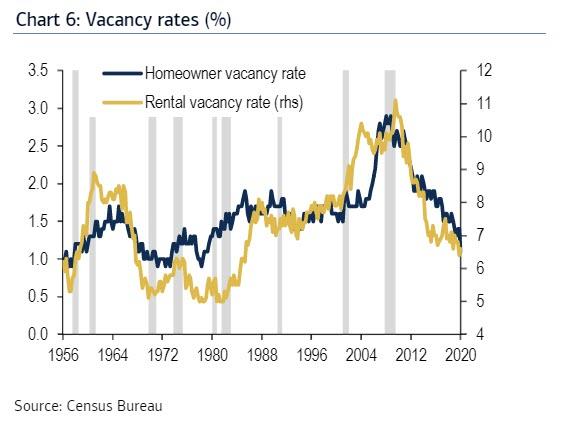
- Running lean pre-crisis: inventory was low, home equity was high and debt levels manageable. The homeowner vacancy rate reached the lows of the mid-1990s.
- Supportive fiscal and monetary policy: forbearance programs reduced potential stress from delinquencies – according to the MBA, 7.8% of all mortgages were in forbearance as of July 12, which amounts to 3.9mn homeowners.
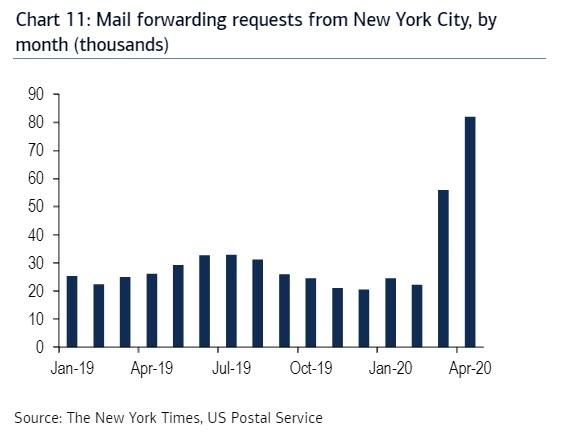
- Pandemic-related relocations: moving to the ‘burbs is a real phenomenon. Take NYC – according to data from USPS, the number of mail forwarding requests from NYC spiked to more than 80,000 in April, 4X the pre-COVID-19 monthly pace.
Below we look at each of these in more detail:
An Uneven Recession

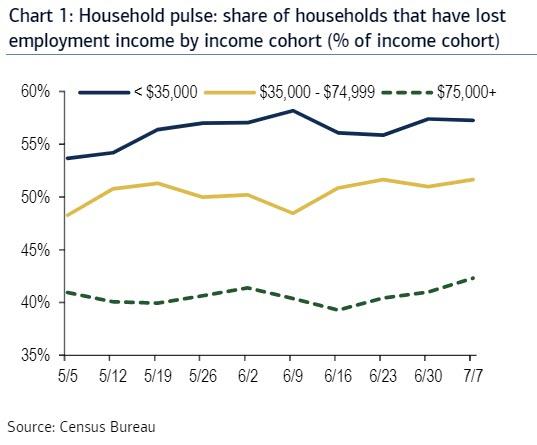
- The COVID-19 pandemic has created pain unevenly with the lower income cohort feeling the brunt of the shock. For those households earning under $35k/year, more than 55% have experienced a loss of employment income.
- For those households making between $35-75k, a little over half have lost employment income. Note that the median household income was $63k in 2018, which falls into this range.
- The median income for new homebuyers is $93k, which means part of a population with more job security-42% of households making above $75k have seen a loss in employment income.
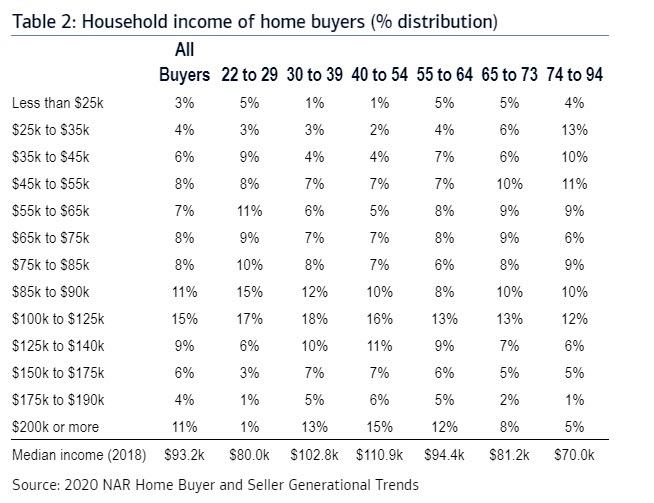
- According to the NAR, the median household income of homebuyers is $93k. The majority are between $75-125k, although 11% of households make more than $200k.
- Even for the youngest homebuyer, aged 22-29, median household income is $80k. This places them above the US median household income of $63k. The oldest homebuyer cohort of 74-94 has the lowest median income of $70k, presumably because they are retired and are not actively earning.
- This income distribution suggests the housing market is more sensitive to the health of the middle- and upper-income population and more immune from strains on lower income cohorts.
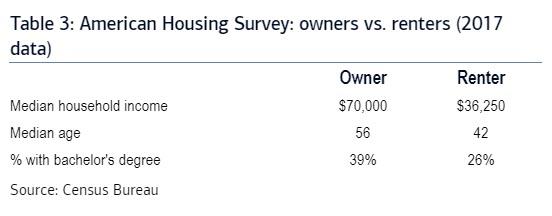
- We can compare the demographic characteristics of homeowners vs. renters using information from the American Housing Survey.
- The median household income of owner-occupied households in 2017 was nearly double that of renters at $70k vs. $36k.
- Homeowners also tended to be older and more highly educated. Once again, the COVID-19 pandemic shock impacted the lower-income population disproportionally, likely keeping the housing market more sheltered than the rental market.
Record low interest rates

- Mortgage rates have plunged, falling roughly 50bp from the February averages, prior to the shock from COVID-19. The 30 year fixed rate mortgage (FRM) has hit a record low.
- Low rates will continue: the Fed has been forceful at providing stimulus and is likely to keep policy accommodative with rates exceptionally low well into the recovery.
- Surveys show that low mortgage rates can push potential homebuyers into the market – according to the University of Michigan survey, 43% of respondents say that it is a good time to buy because rates are low.
- Assuming the median home price of $288k and average mortgage rates, the monthly mortgage payment would be about $1,007/month. This is $80 less than a year ago.
- While wages and salaries have fallen given the strains in the labor market, stimulus checks juiced up incomes resulting in median family income popping higher in April and May, increasing housing affordability.
- Also individuals are making the decision to buy or rent – the decline in mortgage payments is faster than that of rents given that the latter tends to be stickier as landlords have to adapt to higher vacancies. But we expect lower rents to be forthcoming.

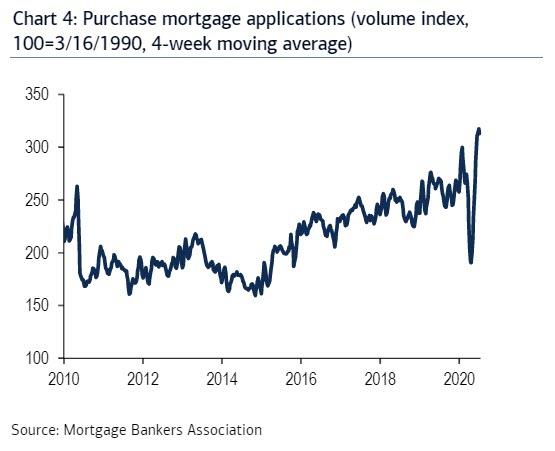
- The decline in mortgage rates has prompted a sharp increase in applications for purchase loans which has exceeded pre-COVID-19 levels and is at the highest since early 2009.
- While not all applications are approved, this measure is a good leading indicator of future home sales.
- Indeed, new home sales bounced back 16.6% mom in May, which reflects almost a 50% recovery of the losses from the January high through April. Pending home sales similarly bounced 44.3% in May. We get data for June in the next few days which should show further gains.
Running lean pre-crisis

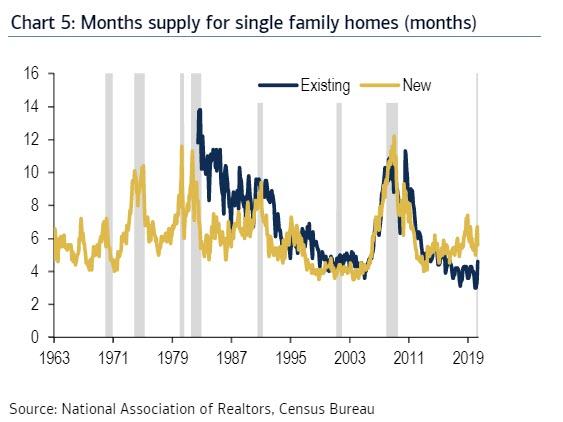
- The housing market was lean heading into this crisis, which is in sharp contrast to the 2008-09 recession where the excesses in the housing market drove the downturn.
- The supply of new homes on the market was running at 5.6 months in May while existing was at 4.6 months.
- After recovering from the 2008-09 recession, builders were much more cautious and limited the degree to which they engaged in speculative building. There were also constraints on supply given limited labor and lots.
- The homeowner vacancy rate stands at 1.1% while the rental vacancy rate is 6.6%. This represents a tight market for homes – home are typically sold or rented quickly and do not sit vacant for long
- The low vacancy rates represent the lack of excess in the market.
- The main trigger for vacancies tend to be foreclosures which were a major challenge in the last recession but have yet to be a factor today.

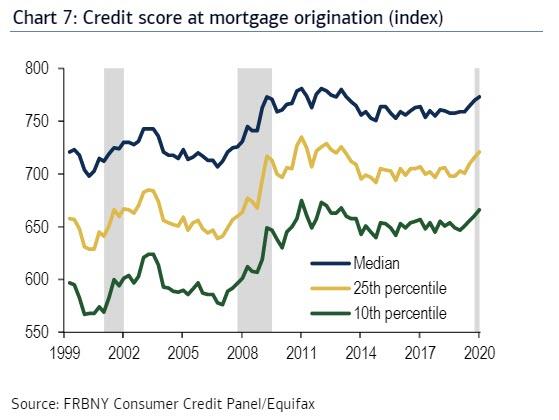
- Little excess can also be seen on the lending side. The median FICO score at the end of the last expansion was 770, showing a responsible lending market and therefore a housing market that is better prepared to weather the storm.
- Even the bottom tiers of the lending spectrum have become more conservative, with the 25th percentile credit score at 716 and 10th percentile at 661 at the end of 2019. Experian typically considers those that have a credit score above 670 as prime.
- This compares to the end of the housing bubble when the median, 25th and 10th percentile credit scores bottomed at 707, 639, and 576, respectively.
Supportive fiscal and monetary policy
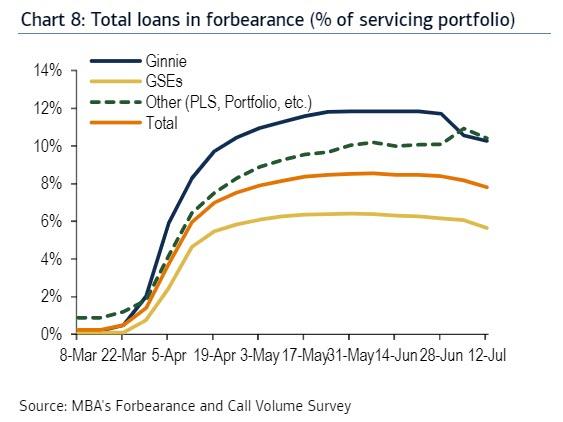
- The CARES Act passed in late April allows for those with federally-backed mortgages to go into forbearance for 12 months without a lump-sum penalty thereafter. Other lenders followed suit to provide relief and similarly expanded forbearance rules.
- According to the MBA, 7.8% of all mortgages were in forbearance as of July 12, which amounts to 3.9mn homeowners. The forbearance share was the highest for private label securities and portfolio loans at 10.41%, while Ginnie was a close second at 10.26%.
- The MBA noted that forbearance has broadly edged lower in recent weeks as homeowners have been able to get back to work. However, there are risks given the virus spread and expiration of unemployment benefits at the end of July.
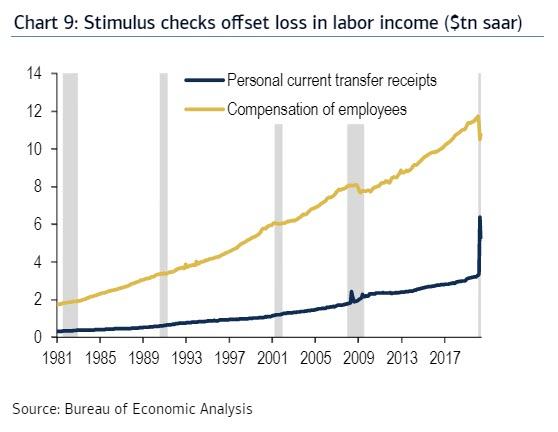
- The CARES Act also provided a large boost to income. Starting in mid-April, checks for up to $1,200 a person were sent out and by early June there were 159mn payments distributed worth more than $267bn.
- Unemployment insurance was also extended and expanded, providing a further boost and helping to augment income for those who became unemployed-many were laid off temporarily and therefore able to remain homeowners.
- Transfer payments from the government averaged $5.8tn saar over May and June, reflecting a spike from $3.4tn in March that more than offset the loss in labor income. However, looking ahead, support will begin to wane with income set to normalize lower.

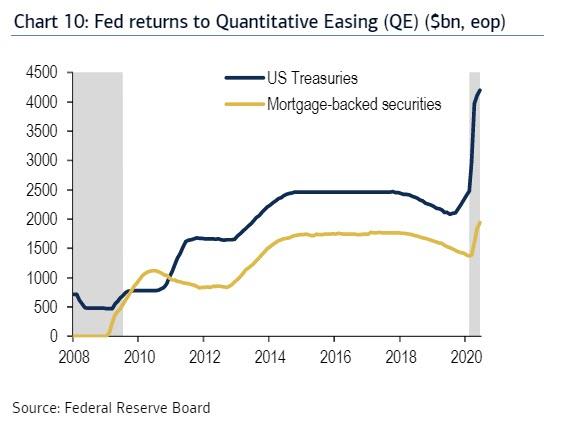
- The Fed has been aggressive at expanding its balance sheet, buying mortgage-backed securities (MBS) and US Treasuries along with creating the credit facilities.
- When the crisis first hit and markets looked unstable, the Fed launched a considerable QE program with purchases of MBS running as high as $50bn/day.
- The pace has since been adjusted to a slower $40bn/month. Since COVID-19 hit, the Fed has expanded its MBS holdings by more than $575bn. This has been a decisive factor in keeping mortgage rates low and housing affordable.
Pandemic-related relocations

- New York City emerged as one of the first pandemic hotspots in the US. Given the risks, many residents left the city for safer destinations, facilitated by a major shift by businesses to have employees work from home.
- Indeed, a New York Times analysis of USPS data found that the number of mail forwarding requests from New York City spiked in March and April, reaching above 80,000 versus around 20,000 in February.
- As businesses have adjusted to work from home, the spike in departures during the pandemic may mark just the beginning of an exodus from urban areas, not just New York but more broadly, towards suburbs.
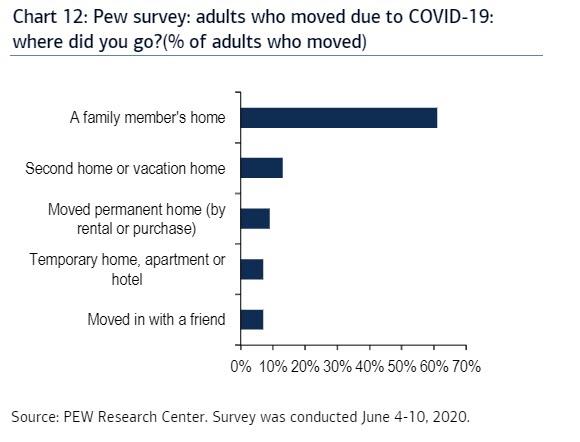
- A recent PEW survey in early June found that 3% of adults moved either permanently or temporarily due to the COVID-19 pandemic.
- Where did those impacted relocate? The survey found that a solid majority (61%) moved to a family member’s home. Digging a little deeper, 41% moved in with parents, 16% with another relative, and 4% with an adult child.
- There were a variety of other options for those relocating: 13% of adults moved to a second home or a vacation home, 9% moved to a different permanent home, 7% moved to a temporary location, and another 7% moved in with a friend.

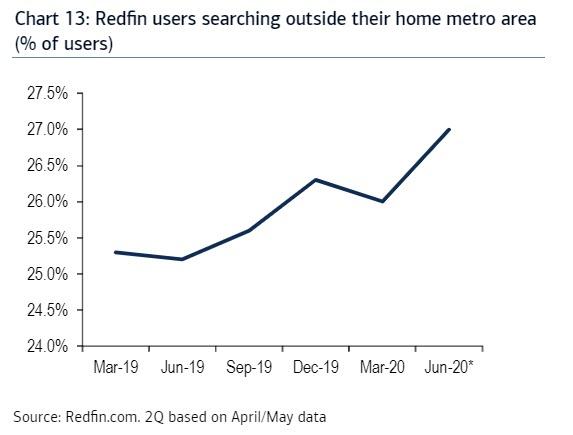
- Another sign that the pandemic has garnered interest in relocating comes from the Redfin.com user data. The share of users searching for homes outside of their home metro area jumped to 27% as of the available 2Q data (April/May)-a record high-after falling to 26% in 1Q.
- Redfin noted that the interest in smaller, less populated towns (<50,000) has spiked to 87% yoy in May while larger cities (>1,000,000) were up a still strong 22% yoy.
- From a regional perspective, New York, San Francisco, and Los Angeles have the greatest number of net outbound searches. Conversely, Phoenix, Sacramento, and Las Vegas were among the most attractive based on net inbound searches.
* * *
Putting it all together, the bank believes there is likely “still more upside for housing activity into the fall but the rate of growth will moderate thereafter.” That said, for now that fundamentals of the housing market remain favorable. Most notably, housing was affected by this recession and not the cause- in stark contrast to 2008-09-so a very different outcome is likely this time.
https://www.zerohedge.com/markets/5-reasons-why-us-housing-has-been-shining-star-covid-crisis