Urethane Blog
Interesting Home Ownership Analysis
August 7, 2019
Young Vs Old, Urban Vs Rural, Home-Buyers Vs Sellers
Authored by Chris Hamilton via Econimica blog,
Summary
- The Quantity of New Potential Homebuyers is Decelerating to a Trickle.
- The Quantity of Potential Sellers is Surging.
- This Mismatch Will Continue to Drive The Federal Reserve to Cut the Federal Funds Rate (& Resultant Mortgage Rates) to Record Lows.
- The Net Result is a National Oversupply of Housing, Particularly in Rural Areas, While Select Urban Markets Continue to Face Housing Shortages.
Just a few charts today to make a simple point regarding the present and future of the housing market.
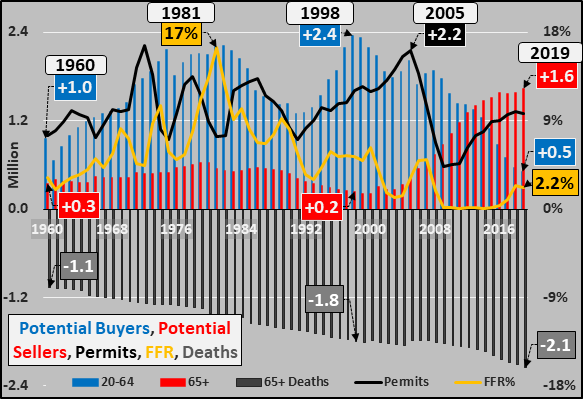
1960 through 2019
Potential Home Sellers
1- 65+ year-olds have the highest homeownership rate, presently 78% of these folks own their own home and they are over-represented in rural areas
2- 65+ year-olds now account for over 75% of the net annual population growth in America (red columns below)…with annual 65+ growth rising from +0.3 million in 1960 up to +1.6 million as of 2019
3- 65+ year-olds also account for 75% of annual deaths (grey negative columns below)…with elderly deaths accelerating from -1.1 million annually in 1960 to -2.1 million as of 2019 (to clarify, in 2019 this means +3.7 million enter the 65+ crowd but 2.1 million exit…leaving a net increase of +1.6 million)
4- When elderly die, there are a couple options for their property…
-A) will it to their heirs
-B) sell it to settle their affairs (as in the case of reverse mortgages)
Generally their heirs either occupy the home themselves (and sell or rent their existing home) or sell or rent the deceased parties property. The net result in all these scenarios is a net addition of housing to the market (either as a rental or property for sale).
Potential Home Buyers
5- 20 to 64 year-old annual population growth has decelerated from the 1998 peak of +2.4 million annually to just +0.5 million, as of 2019 (blue columns, below)…but they are over-represented in select urban areas
6- Those under 35 years-old (entering the 20-64 year-old population) have just a 36% homeownership rate, but the lack of 20-64 year-oid population growth coupled with record student loan debt, record rents as a percentage of income, minimal savings, record delayed marriages (average now over 30yrs/old) and record low birth / fertility rates all continues to undermine rising homeownership rate and total growth of potential buyers
Potential New Homes
7- The annual quantity of new homes (represented below by annual housing permits…black line) varied from 1 million to 2.2 million annually from 1960 through 2005…on the whole driven by the annual growth of potential buyers among the 20 to 65 year-old population with significant short term gyrations due to the impact of changes in the Federal Funds rate (yellow line), driving mortgage rates up/down.
Since 2005, new permits (like the 20-65 year-old annual population growth) collapsed but permits have partly recovered (thanks to a decade of ZIRP and the re-employment of the workforce following the GFC) while potential population growth among home buyers has continued to decelerate.
2019 through 2030
These trends only become more acute over the next decade (chart below, same as above but including projections from 2019 through 2030). The imbalance of miniscule growth among potential buyers (blue columns) versus massive growth among potential sellers (65+ year-olds, red columns) and definite sellers (65+year-old deaths…grey columns).
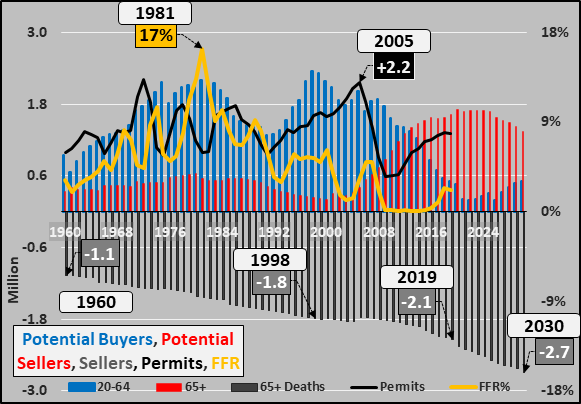
Below, same chart as above but 1980 through 2030 and flipping the annual elderly deaths (grey columns) to put them into perspective against the potential annual change in potential buyers (blue columns), potential sellers (red columns), 30yr mortgage rate (yellow dashed line), and permits (black line). These are the changing ingredients that make up the US housing market (and economy). Just some food for thought.
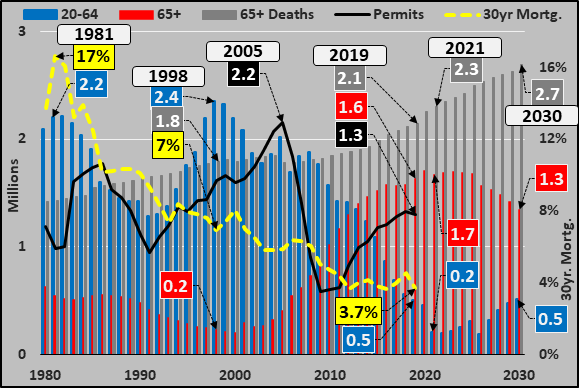
The 2019 through 2030 chart below highlights the discrepancy of minimal potential buyers (blue columns), surging elderly (red columns), accelerating elderly deaths (grey columns), and likely implementation of NIRP (yellow dashed line) versus best guestimate for new housing creation (permits, black dashed line).
By 2023, the growth of potential home buyers will decline to just 0.2 million annually, deaths among elderly will accelerate to -2.4 million annually (bringing up to 1.9 million properties to the market, either as rentals or “for sale”), and population growth among the elderly will peak at +2.4 million annually.
The net-net of this is an absolute mess. 65+ year-olds (who already own homes) are not likely to buy another and are more likely to downsize &/or enter a nursing/memory care home. The accelerating deaths among the property owning elderly will bring significantly more properties to market against a fast decelerating quantity of new buyers. The Federal Reserve is almost sure to push the Federal Funds rate negative (implementing NIRP) to incent the largest segment of the US economy, homebuilding, to continue creating new product. The NIRP is also likely to push mortgage rates to record lows, (perhaps 2% for a 30yr fixed?) continuing to push leverage, speculation, and valuations higher?!? Of course, the lack of working age population growth and the already existing state of full employment means that potential employment growth over the next decade will likewise be a trickle (at best)…again putting secular downward pressure on the potential for new home buyers.

On a fundamental national basis, this means the imbalance only gets more severe with significantly more potential sellers versus just a trickle of growth among potential buyers…and the Fed will do all it can to kick the can as long as possible. Of course, the local realities are very unique and quite different. Simultaneously, urban markets are exhibiting housing shortages (due to relatively positive demographics, population growth, and jobs growth) while rural markets face overwhelming housing surplus’ (due to awful demographics, depopulation, and declining jobs). I previously detailed the urban / rural discrepancies in demographics, population growth, employment, by region South, West, Midwest, Northeast, and National Overview.
Population data via UN 2019 Population Prospects Report
https://www.zerohedge.com/news/2019-08-07/young-vs-old-urban-vs-rural-home-buyers-vs-sellers