Urethane Blog
Inventories
March 21, 2022
Inventory growth hits all-time high as warehouse prices soar in latest LMI
Zach Strickland, FW Market Expert & Market Analyst Follow on Twitter Saturday, March 19, 2022 3 minutes read Listen to this article 0:00 / 4:28 BeyondWords
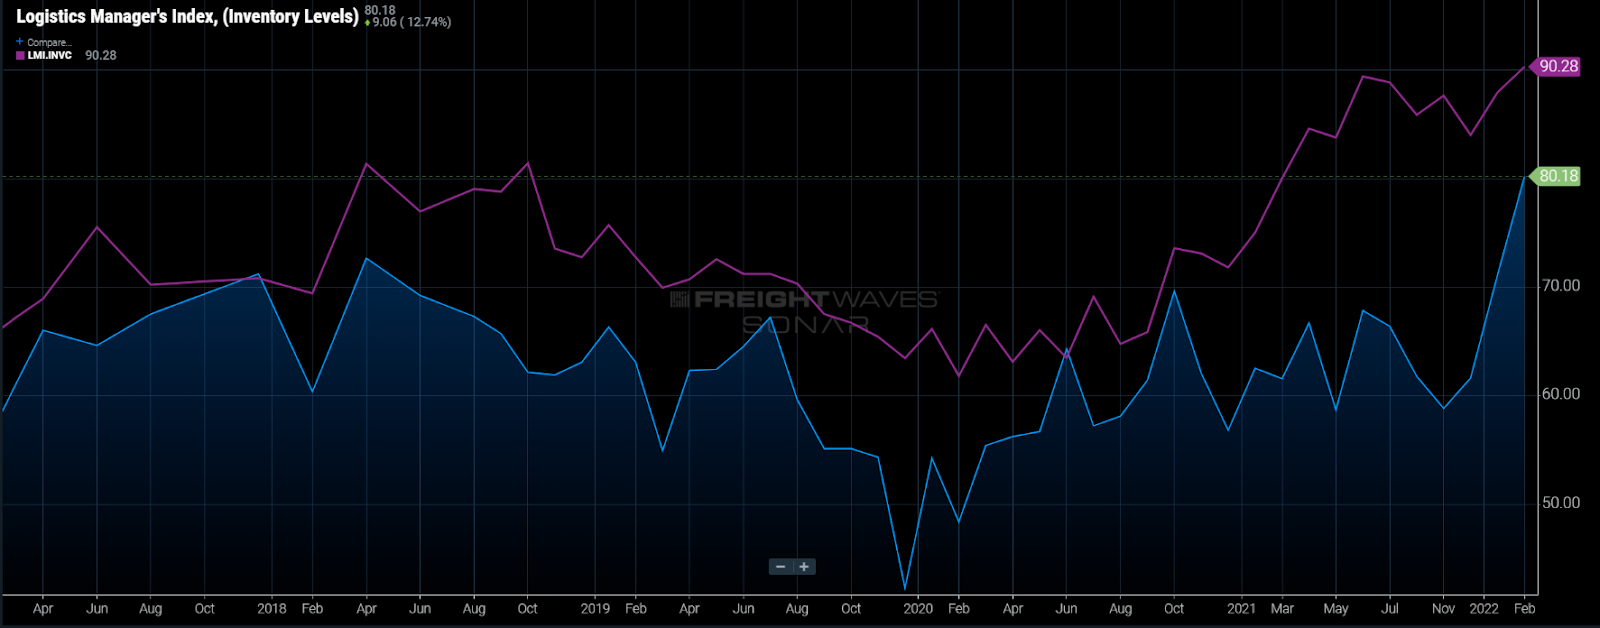
Chart of the Week: Logistics Managers’ Index – Inventory Levels, Inventory Costs, SONAR: LMI.INVL, LMI.INVC
The February Logistics Managers’ Index (LMI), which measures directional changes in transportation and warehousing activity, showed inventories growing at the fastest pace since the index was created in 2016 with a monthly value of 80.16. With companies finally making significant headway in restocking, orders may begin to slow, which may allow for supply chains to stabilize.
Companies have been struggling to replenish depleted inventory levels for the past 18 months thanks in large part to unprecedented surges in demand and production disruptions resulting from the pandemic. Inventory-to-sales ratios have been averaging about 12% lower than pre-pandemic levels over the past year with no sign of improvement, according to the Census Bureau.
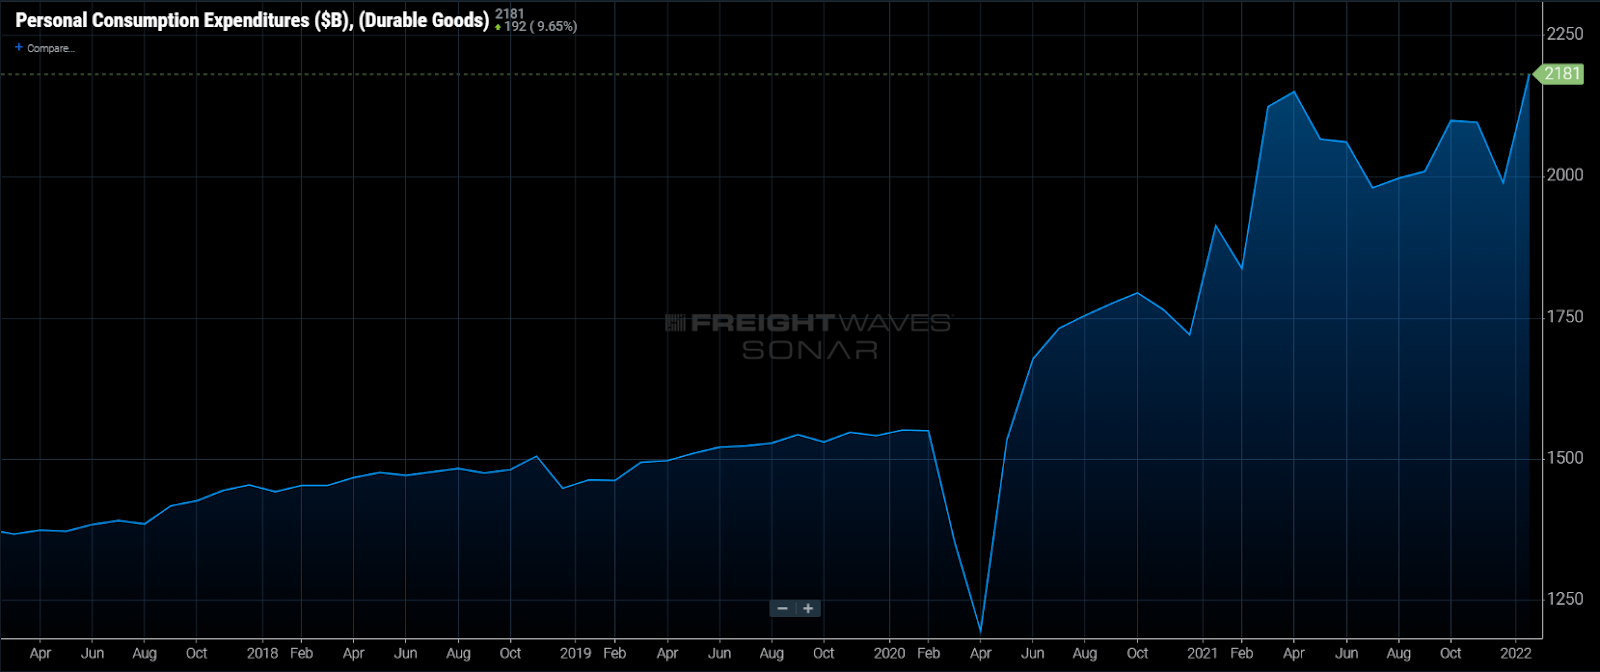
After about a month of sheltering at home in April 2020, consumers got busy ordering items online and revamping their houses. This activity was completely unexpected as many companies stopped ordering goods due to the uncertainty of what was to happen next. The result was a rapid depletion of existing inventory that pushed truckload tender volumes to record levels.
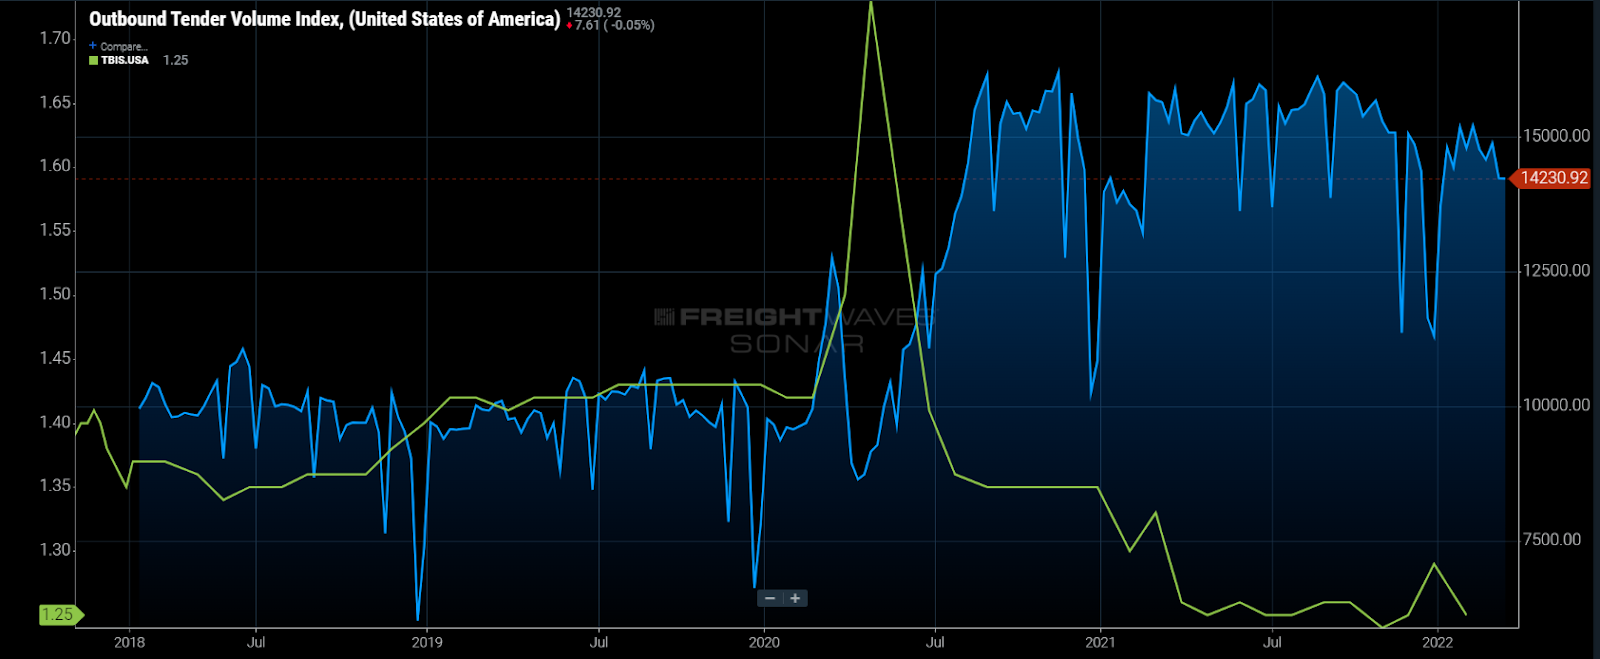
The Outbound Tender Volume Index (OTVI), which measures total truckload tenders from shippers requesting capacity, increased by 70% from May to September as inventory levels plummeted.
With inventories beginning to recover at a much faster pace in January and February, trucking demand appears to be showing early signs of waning in March with the OTVI falling 7.5% through the first three weeks of March — hitting its lowest non-holiday point since February 2021.
On this week’s Freightonomics episode, Zac Rogers, a main contributor to the LMI from Colorado State University, discussed how many large retailers like Amazon and Walmart are holding inventory upstream in the supply chain as demand has waned slightly from peak levels.
It is no secret that inflation is thought to be the primary culprit of eroding demand as the CPI is up nearly 8% over the past year with gas (up 38%) and food being heavy contributors. Consumer debt for credit cards has also rebounded as savings rates have dropped, indicating consumers may not have the discretionary income for goods that they had in 2021.
Rogers states that some demand-side erosion is probably a good thing as the current level of chaos is unsustainable and unhealthy in the long run. The Fed increased interest rates a quarter point this week because it also knows this is true. The main concern is over the “bullwhip effect” to the economy as prices inflate too rapidly leading to a sudden drop in demand — potentially creating a recession.
There is no sign of a recession at this point as there is still plenty of growth arising from a lagging industrial sector, a white-hot construction environment and consumers still spending well beyond pre-pandemic levels on retail goods. Services have also made a comeback.
Rogers used the analogy that a 65-degree day in June feels a lot cooler than a 65-degree day in February, basically stating any cooling of an overheated environment feels substantial even though it is still overheated.
The logistics environment remains unstable regardless of the inventory build. Warehouse vacancies are at or near all-time lows, according to ProLogis, while imports are still flowing into the country. These goods have to go somewhere and inventory and supply chain managers still have a long way to go before they can relax.
About the Chart of the Week
The FreightWaves Chart of the Week is a chart selection from SONAR that provides an interesting data point to describe the state of the freight markets. A chart is chosen from thousands of potential charts on SONAR to help participants visualize the freight market in real time. Each week a Market Expert will post a chart, along with commentary, live on the front page. After that, the Chart of the Week will be archived on FreightWaves.com for future reference.
SONAR aggregates data from hundreds of sources, presenting the data in charts and maps and providing commentary on what freight market experts want to know about the industry in real time.
The FreightWaves data science and product teams are releasing new datasets each week and enhancing the client experience.
To request a SONAR demo, click here.