Urethane Blog
One View of the L&P Acquisition of Elite
September 30, 2022
Leggett & Platt: Limited Financial Benefits From ECS Acquisition
Sep. 30, 2022 1:47 PM ETLeggett & Platt, Incorporated (LEG)
Summary
- In 2019, LEG acquired ECS to propel LEG to greater heights. The post-ECS results show that LEG achieved limited financial benefits from the acquisition.
- LEG growth was driven by high reinvestment rates that on average exceeded 100%. This is not sustainable and will affect its ability to pare down debt.
- I valued LEG based on the post-ECS performance, and assuming a sustainable reinvestment rate. On such a basis there is no margin of safety at the current price in my opinion.

Investment Thesis
In 2019 Leggett & Platt (NYSE:LEG) acquired Elite Comfort Solutions (ECS) for USD 1.2 billion. This was a very substantial acquisition considering that LEG’s Total Assets in 2018 were USD 3.5 billion. Some of the rationales for the acquisition were:
“… supports achievement of the company’s long-term 6-9% revenue growth target… Enables strong cash flow generation…”
LEG achieved limited financial benefits from the acquisition. The performance of LEG post-ECS had deteriorated compared to the pre-ECS period. A valuation of LEG based on the post-ECS results showed that there is no margin of safety at the current price.
Deteriorating performance post-ECS
If my Feb 2021 investment thesis for LEG, I postulated that the acquisition of ECS in 2019 would provide a different growth path for LEG. I assumed that LEG would expand into the polyfoam sector. I thus valued LEG as USD 50 per share on this basis.
Looking at the results over the past 3 years, I would conclude that LEG did not pursue this path. That investment thesis no longer applies. It looked as if ECS serves more like an internal supplier to LEG’s existing businesses rather than growing ECS external customers.
LEG had presented the following as the rationales for the acquisition: (Source: LEG’s press release for the ECS acquisition)
- Establishes a Global Leader in Bedding Technology and Manufacturing.
- Adds R&D Capabilities and Proprietary Foam Technologies.
- Creates Synergies Through Growth of New Hybrid Products.
- Positions the Company to Grow Internationally.
- Supports Achievement of Revenue Growth Target.
- Enables Strong Cash Flow Generation
Did LEG achieve the above-stated goals? The ideal way to answer the question is to compare the post-ECS results for each of the above rationales with the pre-ECS performances.
However, some of the rationales are qualitative in nature. At the same time, LEG did not provide sufficient details for a numerical comparison for many of them.
As such, I looked at several metrics based on growth and returns as per Table 1. Based on these, I would conclude that LEG achieved limited financial benefits from the acquisition.
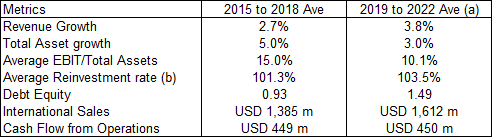
Notes to Table 1:
a) The 2022 performance was based on the doubling the 1H 2022 results.
b) For this metric, Reinvestment rate = Reinvestment / PAT. The post-ECS rate was from 2020 to 2022 i.e. it excluded the year with the ECS acquisition.
c) The analysis was based on data from LEG Excel worksheet. Refer to the segment growth section.
Of the 7 metrics in Table 1, only 2 – Revenue growth and International sales – can be considered as better performances post-ECS. Even then, while there was better Revenue growth post-ECS, this was below the 6-9 % target.
The bigger concern was the reduction in the return as measured by EBIT / Total Assets. The post-ECS return was 2/3 that of the pre-ECS return.
Note that Reinvestment rate is linked to growth via the fundamental equation of Growth = Return X Reinvestment rate. The challenge for LEG is that its Reinvestment rate of greater than 100% is not sustainable.
Growth profile
LEG’s business model appears to be one where there is annual closure or sale of business units as well as new acquisitions. The revenue growth is the net effect of these acquisitions and business closures. From 2010 to 2021:
- 14 business units were discontinued or sold.
- There were 32 (including ECS) acquisitions. Except for ECS, all these were within the existing LEG businesses and/or products.
- At USD 1.2 billion, ECS was the biggest acquisition over the past decade. Excluding ECS, LEG only spent USD 0.67 billion over the past 11 years for the other 31 acquisitions.
I would consider the acquisitions and disposal as part of the “normal” CAPEX. On such a basis, LEG incurred an average net CAPEX of USD 111 million per year from 2015 to 2021. Note that the net CAPEX is after accounting for the disposal of PPE and/or businesses and included the ECS acquisition.
Segment growth
In 2020, LEG restructured its business into 3 segments. This makes it difficult to compare the current segment performance with those before 2020.
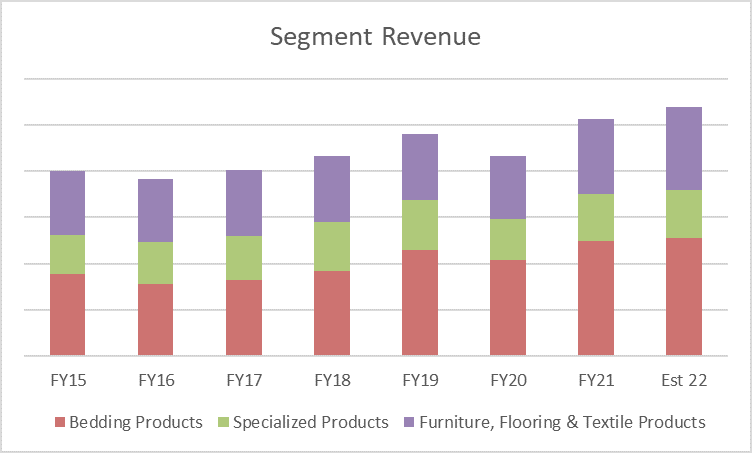
However, LEG provided Excel worksheets on segment financials under the new structure backdating it to 2015. Based on this, I charted the segment revenue trends as shown in Chart 1 assuming 2022 to be double the 1H 2022 performance.
LEG total revenue grew at 4.3% CAGR from 2015 to 2022.
The Excel worksheet also provided the annual organic growth rates for the various segments. The organic growth post-ECS for 2 segments seemed to be lower than those pre-ECS. Refer to Table 2.
The Bedding Products and Specialized Products segments together accounted for about 2/3 of the total revenue. As such I would consider that the post-ECS organic growth was lower than the pre-ECS one.
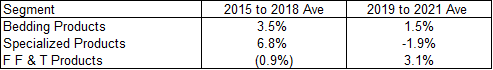
Note to Table 2:
a) F F & T Products = Furniture, Flooring, and Textile Products.
Note that the lower organic growth post-ECS makes it more challenging for LEG to fulfil one of the ECS acquisition rationales i.e. to be a global leader in bedding technology and manufacturing.
Growth prospects
The 3 business sectors that LEG operates in are not exactly growth sectors. I would consider them as mature ones.
- The US bedding (mattresses and foundations) market grew at a CAGR of 5.6% from 1997 to 2017. The forward growth projections are below the long-term US GDP growth rate of 4%. The non-US market is projected to grow at a slightly higher rate than that of the US. I have a comprehensive write-up on this sector in my Tempur-Sealy post that you can refer to.
- According to Statista, revenue in the US furniture market amounted to USD 230 billion in 2022. The market is expected to grow annually by 4.5% (CAGR 2022-2026). On a global basis, most of the revenue is generated in the United States.
- According to Grand View Research, the global flooring market size was valued at USD 257 billion in 2021. It is expected to grow at a compound annual growth rate of 5.6% from 2022 to 2030.
- In the Specialized products segment, the Automotive group accounted for about ¾ of the segment revenue. Statista projected global auto sales to grow from USD 2,755 billion in 2020 to USD 3,800 billion in 2030. This is equal to a CAGR of 3.3%.
Given the above, the 4.3% CAGR achieved by LEG from 2015 to 2022 appears to be within the various sectors’ growths. If nothing else, LEG did not perform like a growth company in the various mature sectors.
Reinvestments
You can see from Table 1 that the Reinvestment rates post-ECS and pre-ECS were about the same.
I defined Reinvestment rate = Reinvestment / Net Income
Where:
Reinvestments = CAPEX + Net Acquisitions – Depreciation & Amortization + Changes in Working Capital.
The concern here is not the comparative rates. Rather it is that the average rates for both periods exceeded 100%. Table 3 tabulates the annual Reinvestment rates for LEG from 2015 to 2022. You can see that for most of the years, it is greater than 100%.
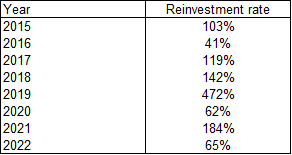
Notes to Table 3:
a) The extraordinarily high rate in 2019 was because of the acquisition of ECS.
b) The 2022 rate was based on the 1H 2022 results.
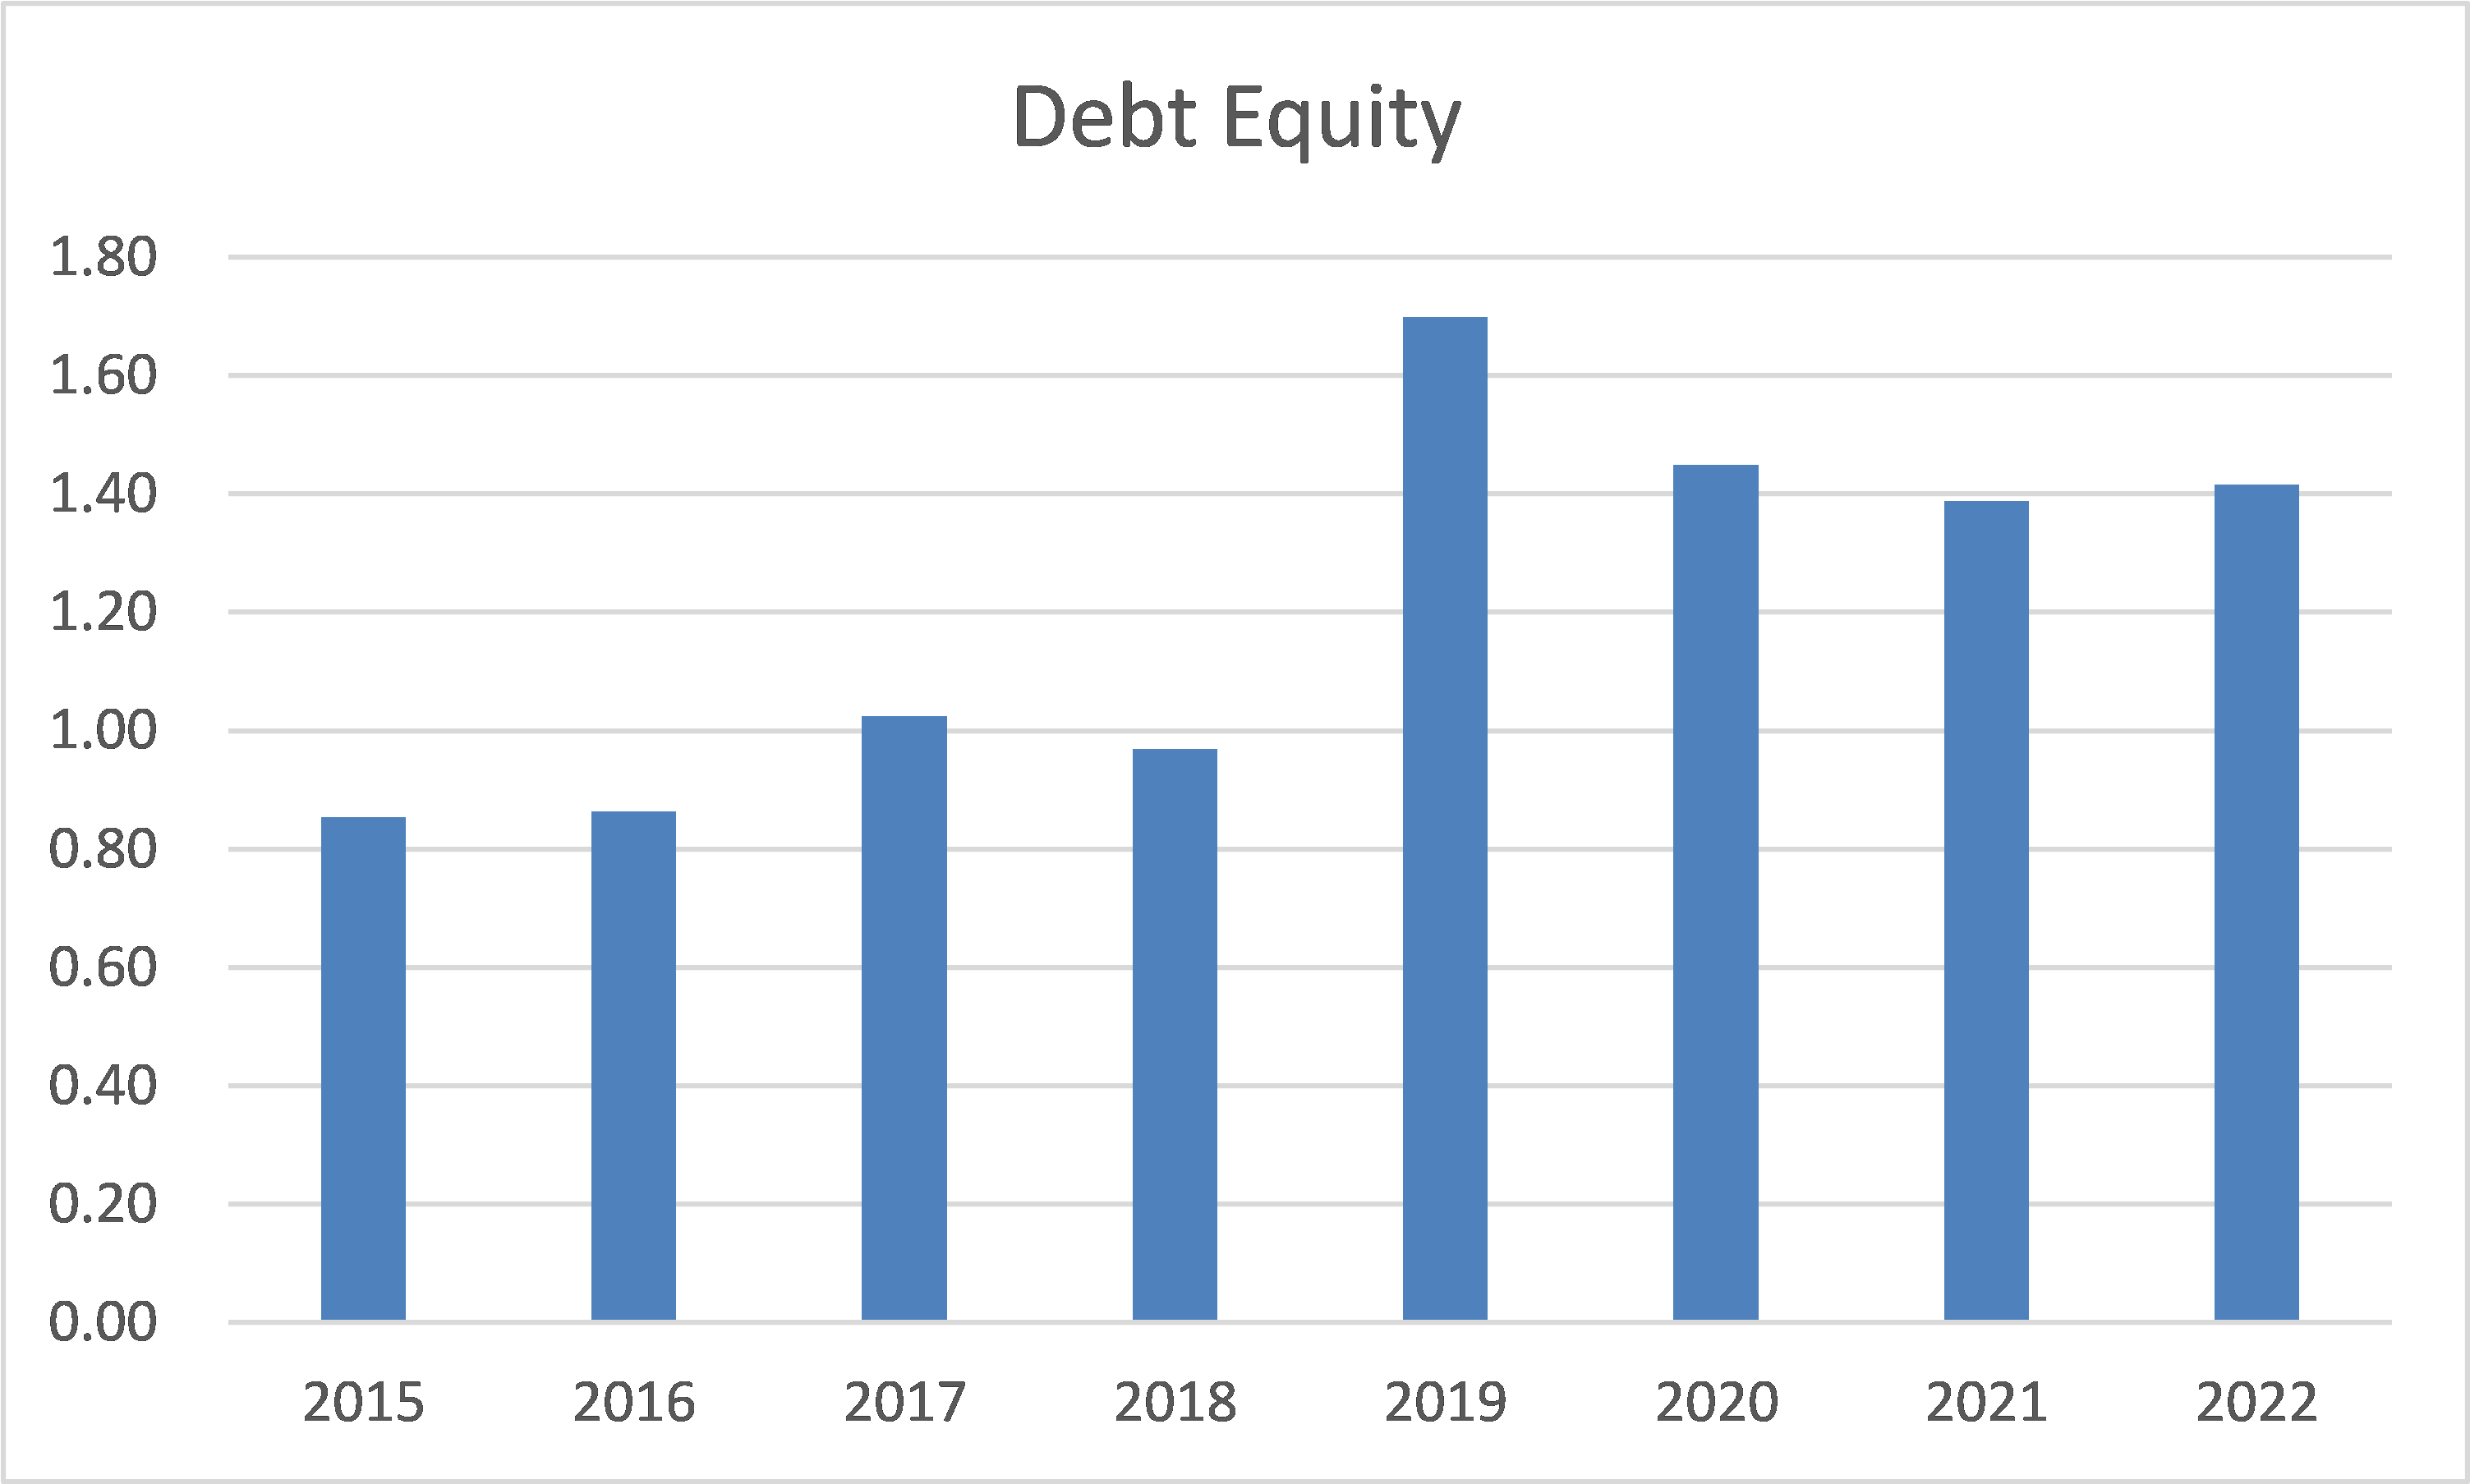
The 100% Reinvestment rate is not a sustainable rate as it meant that LEG was not able to generate sufficient net income to fund the growth. It had to increase its Debt. This is supported by the high Debt Equity levels as shown in Chart 2.
Can LEG achieve a sustainable Reinvestment Rate?
To lower its Reinvestment rate, LEG needs to either:
- Improve its Profits for the same quantum of Reinvestments. The Reinvestment rate can be a metric to assess this.
- Have more effective Reinvestments. One way to assess this is to see whether there were lower Reinvestments for the same quantum of changes in Revenue or Total Assets.
As can be seen from Table 3, there is no reducing trend in the Reinvestment rate. In other words, there was no improvement in profits for the same quantum of Reinvestment.
Chart 3 shows the past 12 years of Reinvestments as ratios of the changes in Revenue and changes in Total Assets. There does not seem to be any trend. This suggests that LEG did not manage to improve the effectiveness of its Reinvestments.
These are back-of-envelop analyses, but it does show that it would be challenging to reduce the Reinvestment rates.

Financial position
I have concerns about LEG’s financial position. I have earlier shown that LEG has a high Debt Equity ratio post-ECS.
The more worrisome point is that LEG had not been able to generate sufficient Cash Flow from Operations to reduce this Debt in a significant way.
- From 2012 to 2021 it generated an average of USD 477 million in Cash Flow from Operations per year.
- During this period, it paid out an average of USD 195 million in annual dividends and spent USD 100 million annually on share buybacks.
- The average CAPEX was 111 million.
- This leaves a balance of USD 71 million per year for reducing the current USD 2.3 billion Debt.
Something has to be reduced if Debt needs to be pared down. This does not paint a good future for dividends, share buyback or CAPEX.
Valuation
I based the valuation of LEG on its performance post-ECS. At the same time, I assumed that it had managed to bring down its Reinvestment rate to a level based on Growth = Return X Reinvestment rate.
I valued LEG based on the single-stage Free Cash Flow to the Firm (‘FCFF’) model of:
Value = FCFF X (1 + growth rate) / (WACC – growth rate).
Where FCFF = EBIT X (1 – tax rate) X (1 – Reinvestment rate).
I looked at 2 scenarios:
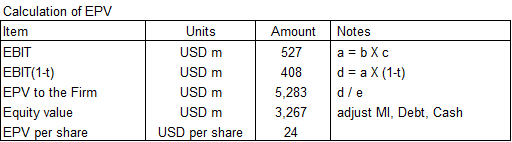
- Earnings Power Value (‘EPV’) where there is no growth and zero Reinvestment rate.
- Earnings Value with growth. The Reinvestment rate here was derived from the fundamental growth equation.
The value of Equity = Value of Firm – Minority Interests (‘MI’) – Debt + Cash
Based on the above, the value of LEG was estimated as follows:
- Asset Value = USD 12 per share.
- EPV = USD 24 per share.
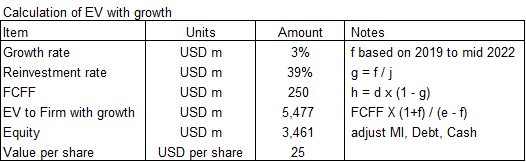
- Earnings Value with 3% growth = USD 25 per share
- Market price as of 28 Sep 2022 = USD 34 per share.
The details of my computation and the assumptions used are shown in the following tables. The key points to note are:
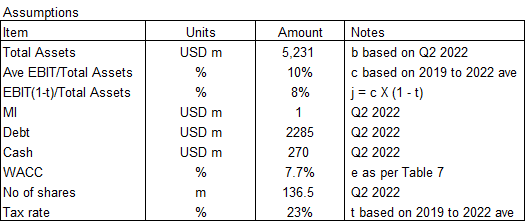
- I use Total Assets and EBIT / Total Assets as the key metrics. The EBIT was derived based on the average 2019 to 2022 EBIT / Total Assets of 10%. Refer to Table 4.
- The 3% growth as per Table 5 was also based on the growth in the Total Assets. The Reinvestment rate here was derived based on the fundamental growth equation.
- I derived the values of many of the metrics based on the 2019 to 2022 performances. Refer to Table 6. I took the 2022 performance as doubling the first half-year 2022 results.
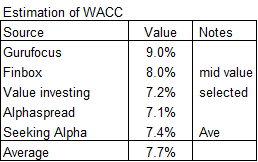
- I estimated the WACC by taking the average of the values that I found. These were based on the first page results of a Google search for “Leggett and Platt WACC”. Refer to Table 7.
Notes to Table 4 and 5:
a) I have provided the formula under the Notes column.
b) Refer to the Assumptions as per Table 6 for the meaning of some of the “alphabet” items.
Valuation risk
I valued LEG from a long-term perspective assuming that the average 2019 to 2022 EBIT as derived represented the post-ECS “steady state”.
It is a conservative perspective as the 2019 to 2022 average EBIT / Total Assets of 10% is very much lower than the average 15 % achieved from 2015 to 2018. I have taken the conservative approach because LEG had not been able to repeat this return post-ECS.
It is obvious that with a 15% return, the estimated EPV would increase by about 80% while the Earnings with growth would be more than double.
In its August 2022 Updates, management has presented its growth framework to increase total shareholder returns. But I rather rely on what had been achieved rather than what management wants to achieve. This is especially given the current economic situation of high inflation and possible recession.
Conclusion
The performance of LEG post-ECS has deteriorated compared to that pre-ECS.
Despite spending an equivalent of about 1/3 of the 2021 Total Assets on acquisitions, its revenue growth rate was not double digits. With 4.3% CAGR revenue growth from 2015 to 2022, I would consider LEG a mature company in a mature sector.
LEG achieved the low growth rate with an unsustainable Reinvestment rate. This resulted in a high Debt Equity position so there are concerns about its financial strengths.
While there is no evidence that LEG can bring down the Reinvestment rate, I have assumed that it can do so. On such a basis, I estimated that there is no margin of safety based on either the EPV or the Earnings with 3% historical growth.
In mid-2021, the market price of LEG exceeded USD 50 per share. This price can only be justified if LEG performance is based on the pre-ECS one. Since there is no evidence for this, at USD 34 per share, LEG is more than fully valued. I would sell at this price given the concerns about inflation and the economy.
I am a long-term value investor looking for bargains. I would not buy LEG until there is evidence that it can deliver the pre-ECS level of performance.
“Editor’s Note: This article was submitted as part of Seeking Alpha’s best contrarian investment competition which runs through October 10. With cash prizes and a chance to chat with the CEO, this competition – open to all contributors – is not one you want to miss. Click here to find out more and submit your article today!”
This article was written by

229 Followers
BSc (Eng), MBA. Self-taught value investor with 2 decades of investing experience. Blogger at i4value.asia. The blog is on value investing through case studies where I analyze and value listed companies in the ASEAN and US regions. I have an exceptional perspective having served as a Board member of a Malaysia listed company for several decades. I have value investing book “Do you really want to master value investing?” on Amazon