Urethane Blog
Stumbled Onto This Website
August 13, 2020
Current year-to-date ( YTD ) data is through June 2020.
Imports: Mattresses and other bedding products
Mattresses and other bedding products, the No. 111 import by value totaled $322.55 million for the month of June, $1.84 billion through June of 2020, and $4.29 billion for all of 2019, the latest annual data available, according to U.S. Census Bureau data analyzed by WorldCity. Need more details? Read more
Top Sources
| Rank | Country | YTD |
|---|---|---|
| 1 | China | $850.84 M |
| 2 | Indonesia | $191.79 M |
| 3 | Vietnam | $184.49 M |
| 4 | India | $105.1 M |
| 5 | Mexico | $92.07 M |
| 6 | Malaysia | $82.29 M |
| 7 | Turkey | $60.44 M |
| 8 | Thailand | $51.49 M |
| 9 | Cambodia | $38.47 M |
| 10 | Serbia | $38.32 M |
Top Gateways
| Rank | Port | YTD |
|---|---|---|
| 1 | Port of Los Angeles | $481.32 M |
| 2 | Port of Newark | $212.4 M |
| 3 | Port of Savannah, Ga. | $204.42 M |
| 4 | Port of Long Beach | $165.78 M |
| 5 | Port of Virginia | $108.47 M |
| 6 | Port of Oakland, Calif. | $107.83 M |
| 7 | Port of Charleston | $99.56 M |
| 8 | Port of Tacoma, Wash. | $74.07 M |
| 9 | Port of Houston | $53.06 M |
| 10 | Port of Seattle, Wash. | $51.48 M |
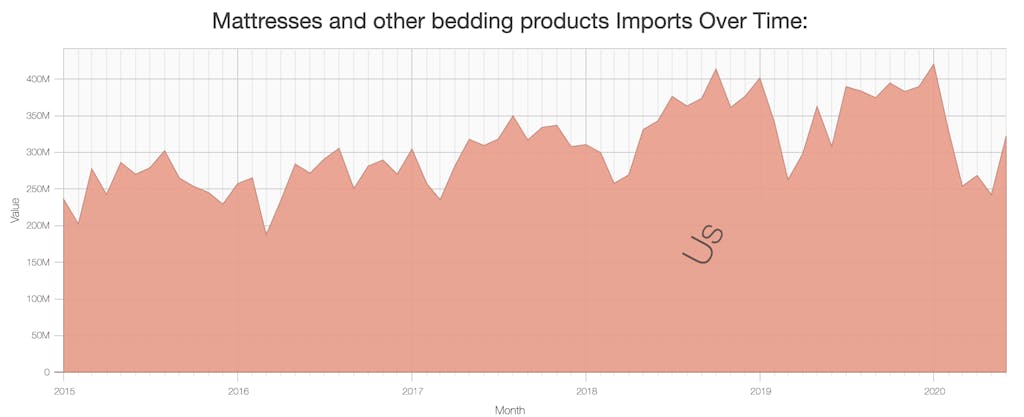
U.S. imports of Mattresses and other bedding products decreased 6.90 percent through June to $1.84 billion
U.S. imports of Mattresses and other bedding products decreased 6.90 percent from $1.97 billion to $1.84 billion through the first six months of 2020 when compared to the same period the previous year, according to WorldCity analysis of the latest U.S. Census Bureau data.
The category ranked 111 through June among the roughly 1,265 import commodity groupings as classified by Census. It ranked No. 114 for the last full year with a total value of $4.29 billion, a $212.11 million, 5.20 percent increase from the 2018 total.
Through June of this year the leading sources were No. 1 China, No. 2 Indonesia, No. 3 Vietnam, No. 4 India and No. 5 Mexico. The leading gateways were No. 1 Port of Los Angeles, No. 2 Port of Newark, No. 3 Port of Savannah, Ga., No. 4 Port of Long Beach and No. 5 Port of Virginia.
In the last previous full year, the leading sources were No. 1 China, No. 2 Mexico, No. 3 India, No. 4 Vietnam and No. 5 Canada. The leading gateways were No. 1 Port of Los Angeles, No. 2 Port of Newark, No. 3 Port of Savannah, Ga., No. 4 Port of Long Beach and No. 5 Port of Oakland, Calif..
Looking at specific airports, seaports and border crossings, the top five through through the first six months of the year were:
Highlights for the top five ports:
- Port of Los Angeles fell 22.15 percent compared to last year to $481.32 million.
- Port of Newark fell 4.55 percent compared to last year to $212.4 million.
- Port of Savannah, Ga. rose 19.52 percent compared to last year to $204.42 million.
- Port of Long Beach rose 35.69 percent compared to last year to $165.78 million.
- Port of Virginia rose 1.92 percent compared to last year to $108.47 million.
There are several hundred airports, seaports and border crossings that handle international trade; they are, in turn, part of the roughly four dozen U.S. Customs districts.
Highlights for the top five foreign markets:
- U.S. imports from No. 1 China decreased $600.28 million, 41.37 percent, (46.3 percent market share).
- U.S. imports from No. 2 Indonesia increased $166.25 million, 650.94 percent, (10.44 percent market share).
- U.S. imports from No. 3 Vietnam increased $125.57 million, 213.14 percent, (10.04 percent market share).
- U.S. imports from No. 4 India decreased $13.57 million, 11.43 percent, (5.72 percent market share).
- U.S. imports from No. 5 Mexico decreased $46.6 million, 33.61 percent, (5.01 percent market share).
All totaled, 77.5 percent of all these Mattresses and other bedding products imports to the United States were shipped from the top five markets through June of this year. That is equal to $1.42 billion of the $1.84 billion total.
All totaled, 63.79 percent of all these Mattresses and other bedding products imports to the United States were shipped to the top five Ports through June of this year. That is equal to $1.17 billion of the $1.84 billion total