The Urethane Blog
Everchem Updates
VOLUME XXI

September 14, 2023
Everchem’s exclusive Closers Only Club is reserved for only the highest caliber brass-baller salesmen in the chemical industry. Watch the hype video and be introduced to the top of the league: — read more
August 11, 2020
“More Robust Than Expected”: Promising Preliminary Class 8 Data For July Has Analysts Cautiously Optimistic
by Tyler Durden Tue, 08/11/2020 – 05:30
Preliminary data for July shows that Class 8 commercial truck sales may have finally started to rebound.
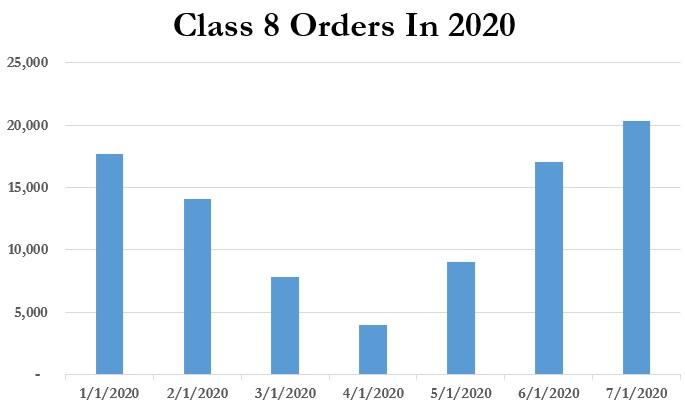
Stung by both the pandemic and a legacy backlog dating back almost two years that has acted as a constant drag on new orders for the last 18 months, preliminary Class 8 orders were 20,300 units for July, up 27% sequentially and up 98% from 2019’s numbers.
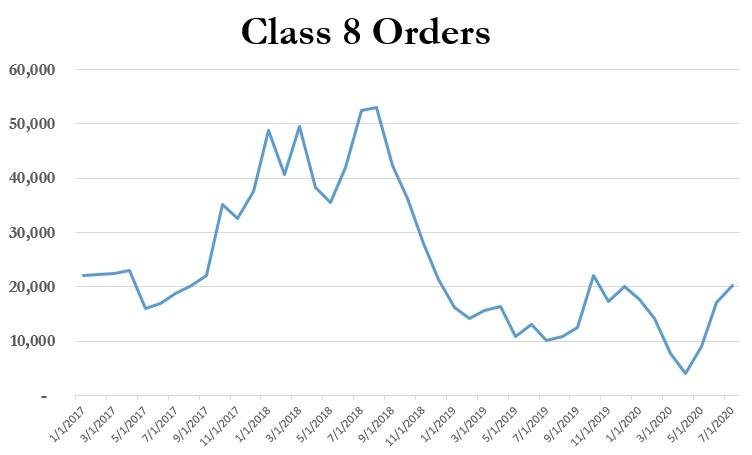
Despite the numbers being nowhere near 2017 and 2018 peak levels, July looks to mark the strongest month of the year for Class 8 orders so far, possibly telegraphing an optimistic second half of the year.
In an August 4 release reported by The Trucker, ACT Research’s Kenny Vieth, president and senior analyst, said: “Preliminary data show that July orders for medium- and heavy-duty vehicles jumped to a six-month high.”
He continued: “The context of rising rates and improving carrier profits adds perspective to what is now occurring in Class 8 orders: Supply matters. With many drivers (and trucks) sidelined, there is now insufficient available capacity for rebounding freight volumes. There is a strong relationship historically between carrier profits and equipment demand.”
He also noted that the positive shift in numbers came despite the additional headwind of a slowing economy during the end of the month:
Vieth noted that during the last week of July, reports showed the U.S. economy for the second quarter of 2020 had dropped 9.5% from the first quarter and was 10.6% below the ending level for 2019.
Jonathan Starks, chief intelligence officer for FTR, says that despite the good month, he is still forecasting a slow recovery: “As we hit the height of summer demand, the freight markets showed strength and resilience and that led to additional orders for trucks. The order activity for both June and July was more robust than expected and is good news for the equipment producers. However, despite the increasing orders, FTR still expects the Class 8 market to maintain a slow, steady recovery.”

He continued: “The freight markets sustained a traumatic decline of volumes at the start of the pandemic and consumer demand, on an absolute basis, will remain weaker as we deal with high levels of unemployment and a Congress that has been unable to foster a bi-partisan solution to stimulate demand. The OEMs received a needed boost from July orders, activity that will help keep the industry moving in an upward direction.”
We will update this article when finalized July data becomes available, which should be in several days.
August 11, 2020
“More Robust Than Expected”: Promising Preliminary Class 8 Data For July Has Analysts Cautiously Optimistic
by Tyler Durden Tue, 08/11/2020 – 05:30
Preliminary data for July shows that Class 8 commercial truck sales may have finally started to rebound.
Stung by both the pandemic and a legacy backlog dating back almost two years that has acted as a constant drag on new orders for the last 18 months, preliminary Class 8 orders were 20,300 units for July, up 27% sequentially and up 98% from 2019’s numbers.
Despite the numbers being nowhere near 2017 and 2018 peak levels, July looks to mark the strongest month of the year for Class 8 orders so far, possibly telegraphing an optimistic second half of the year.
In an August 4 release reported by The Trucker, ACT Research’s Kenny Vieth, president and senior analyst, said: “Preliminary data show that July orders for medium- and heavy-duty vehicles jumped to a six-month high.”
He continued: “The context of rising rates and improving carrier profits adds perspective to what is now occurring in Class 8 orders: Supply matters. With many drivers (and trucks) sidelined, there is now insufficient available capacity for rebounding freight volumes. There is a strong relationship historically between carrier profits and equipment demand.”
He also noted that the positive shift in numbers came despite the additional headwind of a slowing economy during the end of the month:
Vieth noted that during the last week of July, reports showed the U.S. economy for the second quarter of 2020 had dropped 9.5% from the first quarter and was 10.6% below the ending level for 2019.
Jonathan Starks, chief intelligence officer for FTR, says that despite the good month, he is still forecasting a slow recovery: “As we hit the height of summer demand, the freight markets showed strength and resilience and that led to additional orders for trucks. The order activity for both June and July was more robust than expected and is good news for the equipment producers. However, despite the increasing orders, FTR still expects the Class 8 market to maintain a slow, steady recovery.”
He continued: “The freight markets sustained a traumatic decline of volumes at the start of the pandemic and consumer demand, on an absolute basis, will remain weaker as we deal with high levels of unemployment and a Congress that has been unable to foster a bi-partisan solution to stimulate demand. The OEMs received a needed boost from July orders, activity that will help keep the industry moving in an upward direction.”
We will update this article when finalized July data becomes available, which should be in several days.
August 10, 2020
Gross Domestic Product
Q2 GDP Releases:
The size of the Covid-19 Crater
Allianz SE | Munich | Jul 31, 2020
The Covid-19-related trough has been reached. GDP figures for the second quarter confirmed the expected historic slump in economic activity in the Eurozone and the U.S. According to the
Eurostat flash estimate, real GDP declined by -12.1% q/q in Q2 2020.
All major Eurozone economies registered a hitherto unseen quarterly decline in real GDP: Germany -10.1% (after -2.0%), France -13.8% (after -5.9%) and Spain -18.5% (after -5.2%). The U.S. economy shrank at a quarterly rate of -9.5% (after -1.2%.), i.e. an annualized rate of -32.9%. The biggest surprise was Italy, where the GDP contraction was far less than expected at -12.4% (after -5.3%), even outperforming France.
The GDP figures confirm the different recovery speeds across advanced economies: Germany and the U.S. are in the pole position, France and Italy are the chasing group and Spain is the laggard. The main reason for both leaders is a massive fiscal response.
After a historic slump, a historic rebound. For the next quarter, we expect economic activity in the Eurozone to increase by +12.8% q/q.
The most important stage of the recovery is now ahead. The underlying rhythm will be moderate. No sustained impulse is to be expected from foreign trade because of the asynchronous opening of the global economy. Yet, the recovery of domestic demand is not happening at full speed either. Heightened economic uncertainty (insolvency risk) still weighs on investment, while some sectors are still affected by restrictions (major events). Consumers are likely to stay rather cautious, whether out of contagion fears or job insecurity.
GDP figures remain in line with our baseline scenario of a decline in real economic output of -9.0% in the Eurozone and -5.3% in the U.S. in 2020.
August 6, 2020
A nice review of Huntsman presented at a recent Jefferies virtual event

View the presentation here: