Global propylene markets will continue to see healthy supply availability in the second half of 2019 as fresh capacity comes online in Asia and US inventory levels remain strong.
Pricing and Markets
July 15, 2019
Second Half Propylene Update
H2 Outlook: Global propylene supply to remain healthy on extra capacity, strong inventories
Highlights
H2 Outlook: Global propylene supply to remain healthy on extra capacity, strong inventories
US inventories establish records in 2019
US-Europe arbitrage under pressure, but outlook mixed
Asia likely to stay stable-to-soft as a result of additional PDH plants
- Author
- Lara Berton
- Editor
- Keiron Greenhalgh
As supply improved, alongside a slowdown in derivatives demand, global propylene spot prices fell this year from the multi-year highs seen in 2018, and the US market has taken the steepest dive.
US propylene supply has recovered in the first half of 2019, as production from propane dehydrogenation units has improved. This was in line with expectations for the front half of the year, and eventually led to record high inventory levels of 6.459 million barrels in March, according to the US Energy Information Administration.
Trade participants have said this is something they expect to continue for the remainder of the year.
Inventory levels have gradually come down since March, but are still well above inventory levels a year ago. At the end of June, US inventories stood at 4.960 million barrels, compared with 2.324 million barrels at the end of June 2018. Market participants have said stocks should build again following mid-year turnarounds at some heavy cracker units. But sources added that all three US PDH units are still expected to have see type of turnaround between October and February 2020.
The overall increase in inventories has pressured US propylene spot prices, leaving them well below 2018 levels. Polymer-grade propylene spot prices hit a low of 32 cents/lb ($705/mt) FD USG in late February before rebounding and then receding again to 32 cents/lb FD USG in mid-June.
US EXPORTS INCREASE, BUT ARBITRAGE TO EUROPE CHALLENGED IN H2
As supply length pushed spot prices to levels not seen since the end of 2016, US propylene exports have increased through the first four months of 2019, according to data from the US International Trade Commission. Volumes mainly headed to Latin America, and market participants have said they expect this to continue throughout 2019.
Europe has also seen an increase in shipments of US molecules as players anticipated supply tightness amid a heavy steam cracker turnaround schedule in the second quarter.
According to Eurostat data, imports from the US in the first four months of 2019 averaged 13,600 mt/month, compared with 920 mt/month in the same period in 2018. Meanwhile, imports reached an all-time high in February of 63,760 mt, the data show.
Since the beginning of 2019, Europe polymer grade propylene has traded at a premium to other regions before falling below $1,000/mt FD NWE, close to levels in Asia and narrowing the gap with the US.
With that recent relative weakness, market players have started questioning if arbitrage opportunities still exist, already anticipating a decline in imports from the US.
The premium of the European PGP spot price over its US equivalent was calculated at between $150/mt and $200/mt at the beginning of July, meaning the arbitrage was closed on paper.
“The arbitrage has been challenged, but from a volume perspective there is enough propylene for July and August,” one European player said.
However, more planned maintenance is expected in Europe between August and October, meaning supply could turn tighter if the current trend continues.
ATTENTION IN ASIA TURNS TO NEW CAPACITY
Meanwhile, the Asian market will focus on startups, with more than 1.2 million mt/year of extra propylene production capacity expected to come online in China by H2.
This includes China’s Fujian Meide Petrochemical’s 660,000 mt/year PDH plant in September and Dongguan Juzhengyuan’s 600,000 mt/year PDH plant by the end of H2. The additional capacity could reduce Chinese reliance on imported cargoes and exert pressure on spot price.
“We imported 600,000 mt of propylene feedstock for our two 500,000 mt/year polypropylene plants last year and will reduce the imports by 400,000 mt once our PDH plant is operating at full rate,” said a company source at Fujian Meide Petrochemical.
As for the rest of Southeast Asia, Northeast Asia and South Korea, there will be less turnarounds in H2 compared with the front half of the year, ensuring a relatively stable supply of propylene, especially in the final three months of the year. Three steam crackers in the region with a total propylene capacity of over 1.5 million mt/year were heard to have plans for turnarounds in the current quarter. Chandra Asia, the major player in Indonesia, is expected to shut down its cracker for turnaround by August 1, while Formosa Petrochemical’s No. 2 steam cracker unit will carry out scheduled maintenance by mid-August. Lotte Chemical is scheduled to shut its Daesan cracker by October 14.
Other market participants were keeping a close watch on the Malaysia’s Petronas-Aramco RAPID project, which has experienced delays in the startup of the cracker and refinery. The complex’s RFCC is now scheduled to produce 600,000 mt/year of propylene by the end of Q3, but is only due to produce on-spec propylene in Q4, according to a source with direct knowledge of the matter.
— Lara Berton, Lara.Berton@spglobal.com
— Edited by Keiron Greenhalgh, newsdesk@spglobal.com
July 15, 2019
Second Half Propylene Update
H2 Outlook: Global propylene supply to remain healthy on extra capacity, strong inventories
Highlights
H2 Outlook: Global propylene supply to remain healthy on extra capacity, strong inventories
US inventories establish records in 2019
US-Europe arbitrage under pressure, but outlook mixed
Asia likely to stay stable-to-soft as a result of additional PDH plants
- Author
- Lara Berton
- Editor
- Keiron Greenhalgh
Global propylene markets will continue to see healthy supply availability in the second half of 2019 as fresh capacity comes online in Asia and US inventory levels remain strong.
As supply improved, alongside a slowdown in derivatives demand, global propylene spot prices fell this year from the multi-year highs seen in 2018, and the US market has taken the steepest dive.
US propylene supply has recovered in the first half of 2019, as production from propane dehydrogenation units has improved. This was in line with expectations for the front half of the year, and eventually led to record high inventory levels of 6.459 million barrels in March, according to the US Energy Information Administration.
Trade participants have said this is something they expect to continue for the remainder of the year.
Inventory levels have gradually come down since March, but are still well above inventory levels a year ago. At the end of June, US inventories stood at 4.960 million barrels, compared with 2.324 million barrels at the end of June 2018. Market participants have said stocks should build again following mid-year turnarounds at some heavy cracker units. But sources added that all three US PDH units are still expected to have see type of turnaround between October and February 2020.
The overall increase in inventories has pressured US propylene spot prices, leaving them well below 2018 levels. Polymer-grade propylene spot prices hit a low of 32 cents/lb ($705/mt) FD USG in late February before rebounding and then receding again to 32 cents/lb FD USG in mid-June.
US EXPORTS INCREASE, BUT ARBITRAGE TO EUROPE CHALLENGED IN H2
As supply length pushed spot prices to levels not seen since the end of 2016, US propylene exports have increased through the first four months of 2019, according to data from the US International Trade Commission. Volumes mainly headed to Latin America, and market participants have said they expect this to continue throughout 2019.
Europe has also seen an increase in shipments of US molecules as players anticipated supply tightness amid a heavy steam cracker turnaround schedule in the second quarter.
According to Eurostat data, imports from the US in the first four months of 2019 averaged 13,600 mt/month, compared with 920 mt/month in the same period in 2018. Meanwhile, imports reached an all-time high in February of 63,760 mt, the data show.
Since the beginning of 2019, Europe polymer grade propylene has traded at a premium to other regions before falling below $1,000/mt FD NWE, close to levels in Asia and narrowing the gap with the US.
With that recent relative weakness, market players have started questioning if arbitrage opportunities still exist, already anticipating a decline in imports from the US.
The premium of the European PGP spot price over its US equivalent was calculated at between $150/mt and $200/mt at the beginning of July, meaning the arbitrage was closed on paper.
“The arbitrage has been challenged, but from a volume perspective there is enough propylene for July and August,” one European player said.
However, more planned maintenance is expected in Europe between August and October, meaning supply could turn tighter if the current trend continues.
ATTENTION IN ASIA TURNS TO NEW CAPACITY
Meanwhile, the Asian market will focus on startups, with more than 1.2 million mt/year of extra propylene production capacity expected to come online in China by H2.
This includes China’s Fujian Meide Petrochemical’s 660,000 mt/year PDH plant in September and Dongguan Juzhengyuan’s 600,000 mt/year PDH plant by the end of H2. The additional capacity could reduce Chinese reliance on imported cargoes and exert pressure on spot price.
“We imported 600,000 mt of propylene feedstock for our two 500,000 mt/year polypropylene plants last year and will reduce the imports by 400,000 mt once our PDH plant is operating at full rate,” said a company source at Fujian Meide Petrochemical.
As for the rest of Southeast Asia, Northeast Asia and South Korea, there will be less turnarounds in H2 compared with the front half of the year, ensuring a relatively stable supply of propylene, especially in the final three months of the year. Three steam crackers in the region with a total propylene capacity of over 1.5 million mt/year were heard to have plans for turnarounds in the current quarter. Chandra Asia, the major player in Indonesia, is expected to shut down its cracker for turnaround by August 1, while Formosa Petrochemical’s No. 2 steam cracker unit will carry out scheduled maintenance by mid-August. Lotte Chemical is scheduled to shut its Daesan cracker by October 14.
Other market participants were keeping a close watch on the Malaysia’s Petronas-Aramco RAPID project, which has experienced delays in the startup of the cracker and refinery. The complex’s RFCC is now scheduled to produce 600,000 mt/year of propylene by the end of Q3, but is only due to produce on-spec propylene in Q4, according to a source with direct knowledge of the matter.
— Lara Berton, Lara.Berton@spglobal.com
— Edited by Keiron Greenhalgh, newsdesk@spglobal.com
June 28, 2019
Cars are Lasting Longer
Carmageddon Craves Cash-For-Clunkers 2.0 As Average Vehicle Age Soars To Record High
Authored by Wolf Richter via WolfStreet.com,
The average age of passenger cars and trucks on the road in the US ticked up again in 2019, to another record of 11.8 years, IHS Markit reported today.
When I entered the car business in 1985, the average age had just ticked up to 7.8 years, and the industry was fretting over it and thought the trend would have to reverse, and customers would soon come out of hiding and massively replace those old clunkers with new vehicles, and everyone would sell more and make more. But those industry hopes for a sustained reversal of the trend of the rising average age have been bitterly disappointed:

This rising average age is largely driven by vehicles lasting longer – an unintended consequence of relentless improvements in overall quality, forced upon automakers by finicky customers in an ultra-competitive market where automakers struggle to stay alive. To make it in the US, they have to constantly improve their products, and stragglers that can’t compete are left unceremoniously by the wayside. US consumers are brutal.
This unintended consequence of rising overall quality contributes to the dreadful industry problem: The US, despite constant population growth, is a horribly mature auto market.
In 1999, so 20 years ago, new vehicle sales reached a record of 16.9 million units. This record was broken in 2000, with 17.3 million units. Then sales tapered off. By 2007, they’d dropped to 16.1 million units. Then the Financial Crisis hit, GM and Chrysler went bankrupt, Ford almost did, and peak-to-trough, sales plunged 40% to 10.4 million units by 2009.
The recovery has been steep, and in 2015, finally the old record of the year 2000 was broken, but barely with 17.48 million units, and in 2016, the industry eked out another record of 17.55 million units. And that was it. Sales have fizzled since then. So far in 2019, the data indicates that sales are likely to fall below 17 million units, according to my own estimates, bringing the industry right back where it had been 20 years ago in 1999:
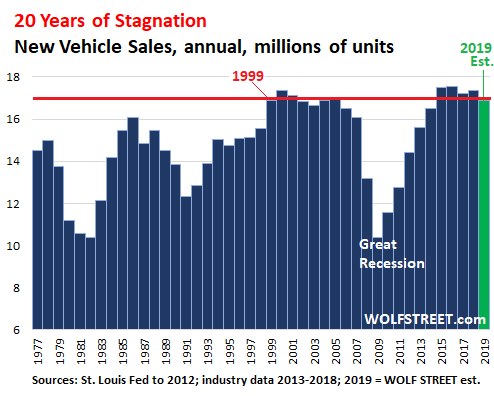
Yet, given the longer average age of the vehicles on the road across the entire fleet, even stagnating sales produce a rising number of vehicles in operation. So it’s not that Americans as a whole have fewer cars – far from it: They have more cars, and those cars are on average older.
The number of vehicles in operation (VIO) in 2019 rose by 5.9 million units from 2018, to a new record of 278.3 million vehicles, according to IHS Markit. In other words, during the 12-month period, about 17 million new vehicles were added to the national fleet; and about 11 million units were removed from the fleet, either by being sent to the salvage yard or by being exported to other countries.
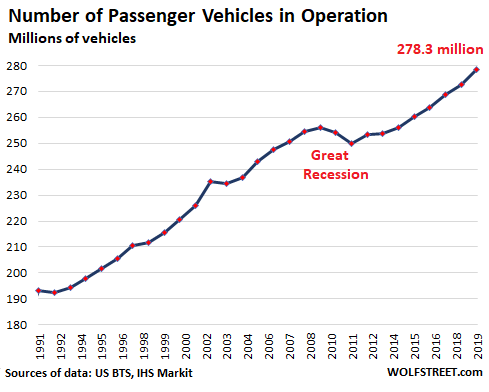
What you see in the chart above is the future supply for the used vehicle market. Used vehicle sales will likely come in just under 40 million units this year – so about 2.3 times the sales volume of new vehicle sales.
The fact that the average age of the vehicles in operation is rising doesn’t mean that all people hang on to their cars longer. On the contrary.
Sure, we drive a car we bought new 12 years ago; it’s in great shape, looks good, the six-figure odometer reading is just a blip, and we’re going to hang on to it because there is no reason to get rid of it. We know other people on the same program. Millions of Americans do that.
But other people have two-year or three-year leases, and this is a booming business. More and more people lease. And when the lease ends, their old vehicle is returned to the leasing company, which owns the vehicle, and which then sells it at auction, where a dealer buys it and then sells it as a used vehicle to a retail customer. These vehicles are only two or three years old, and often in mint condition.
Then there is the huge fleet or rental cars of about 2.2 million vehicles that are turned over every couple of years or so to enter the used-vehicle market, much of it via auctions held around the country.
In addition, there are corporate and government fleets that get turned over at different intervals, and those units end up on the used vehicle market.
So the rising average age doesn’t mean that Americans drive the same vehicle for a longer period of time – though they can, and many do – but that there is a strong market and demand for good older vehicles, and people buy them and drive them for a few more years.
But it is an issue for automakers. They could sell a lot more vehicles – and I mean a whole bunch more – if their vehicles on average reached the end of their life after eight years. But our finicky consumers don’t go for this program anymore. Quality is one of the factors that decides whether an automaker is going to make it or whether it will die.
What’s left for automakers to do to increase revenues in this environment of two decades of stagnating unit sales? A three-pronged industry strategy has emerged: Shift customers to more expensive vehicles, such as from cars to trucks and SUVs; load the vehicles with more goodies each year, such as driving-assist features; and jack up the prices pure and simple.
And automakers have been doing it across the board, which has the effect that for many Americans, new vehicles have become too expensive, and they stopped buying them, which puts further downward pressure on unit sales. But Wall Street, which keeps pushing automakers to go further and further upscale – because that’s where the money is – hasn’t figured this out yet.
https://www.zerohedge.com/news/2019-06-28/carmageddon-craves-cash-clunkers-20-average-vehicle-age-soars-record-high
June 28, 2019
Cars are Lasting Longer
Carmageddon Craves Cash-For-Clunkers 2.0 As Average Vehicle Age Soars To Record High
Authored by Wolf Richter via WolfStreet.com,
The average age of passenger cars and trucks on the road in the US ticked up again in 2019, to another record of 11.8 years, IHS Markit reported today.
When I entered the car business in 1985, the average age had just ticked up to 7.8 years, and the industry was fretting over it and thought the trend would have to reverse, and customers would soon come out of hiding and massively replace those old clunkers with new vehicles, and everyone would sell more and make more. But those industry hopes for a sustained reversal of the trend of the rising average age have been bitterly disappointed:
This rising average age is largely driven by vehicles lasting longer – an unintended consequence of relentless improvements in overall quality, forced upon automakers by finicky customers in an ultra-competitive market where automakers struggle to stay alive. To make it in the US, they have to constantly improve their products, and stragglers that can’t compete are left unceremoniously by the wayside. US consumers are brutal.
This unintended consequence of rising overall quality contributes to the dreadful industry problem: The US, despite constant population growth, is a horribly mature auto market.
In 1999, so 20 years ago, new vehicle sales reached a record of 16.9 million units. This record was broken in 2000, with 17.3 million units. Then sales tapered off. By 2007, they’d dropped to 16.1 million units. Then the Financial Crisis hit, GM and Chrysler went bankrupt, Ford almost did, and peak-to-trough, sales plunged 40% to 10.4 million units by 2009.
The recovery has been steep, and in 2015, finally the old record of the year 2000 was broken, but barely with 17.48 million units, and in 2016, the industry eked out another record of 17.55 million units. And that was it. Sales have fizzled since then. So far in 2019, the data indicates that sales are likely to fall below 17 million units, according to my own estimates, bringing the industry right back where it had been 20 years ago in 1999:
Yet, given the longer average age of the vehicles on the road across the entire fleet, even stagnating sales produce a rising number of vehicles in operation. So it’s not that Americans as a whole have fewer cars – far from it: They have more cars, and those cars are on average older.
The number of vehicles in operation (VIO) in 2019 rose by 5.9 million units from 2018, to a new record of 278.3 million vehicles, according to IHS Markit. In other words, during the 12-month period, about 17 million new vehicles were added to the national fleet; and about 11 million units were removed from the fleet, either by being sent to the salvage yard or by being exported to other countries.
What you see in the chart above is the future supply for the used vehicle market. Used vehicle sales will likely come in just under 40 million units this year – so about 2.3 times the sales volume of new vehicle sales.
The fact that the average age of the vehicles in operation is rising doesn’t mean that all people hang on to their cars longer. On the contrary.
Sure, we drive a car we bought new 12 years ago; it’s in great shape, looks good, the six-figure odometer reading is just a blip, and we’re going to hang on to it because there is no reason to get rid of it. We know other people on the same program. Millions of Americans do that.
But other people have two-year or three-year leases, and this is a booming business. More and more people lease. And when the lease ends, their old vehicle is returned to the leasing company, which owns the vehicle, and which then sells it at auction, where a dealer buys it and then sells it as a used vehicle to a retail customer. These vehicles are only two or three years old, and often in mint condition.
Then there is the huge fleet or rental cars of about 2.2 million vehicles that are turned over every couple of years or so to enter the used-vehicle market, much of it via auctions held around the country.
In addition, there are corporate and government fleets that get turned over at different intervals, and those units end up on the used vehicle market.
So the rising average age doesn’t mean that Americans drive the same vehicle for a longer period of time – though they can, and many do – but that there is a strong market and demand for good older vehicles, and people buy them and drive them for a few more years.
But it is an issue for automakers. They could sell a lot more vehicles – and I mean a whole bunch more – if their vehicles on average reached the end of their life after eight years. But our finicky consumers don’t go for this program anymore. Quality is one of the factors that decides whether an automaker is going to make it or whether it will die.
What’s left for automakers to do to increase revenues in this environment of two decades of stagnating unit sales? A three-pronged industry strategy has emerged: Shift customers to more expensive vehicles, such as from cars to trucks and SUVs; load the vehicles with more goodies each year, such as driving-assist features; and jack up the prices pure and simple.
And automakers have been doing it across the board, which has the effect that for many Americans, new vehicles have become too expensive, and they stopped buying them, which puts further downward pressure on unit sales. But Wall Street, which keeps pushing automakers to go further and further upscale – because that’s where the money is – hasn’t figured this out yet.
https://www.zerohedge.com/news/2019-06-28/carmageddon-craves-cash-clunkers-20-average-vehicle-age-soars-record-high
June 28, 2019
CertiPUR and PFA in the News
Learn More About the Best Mattresses of 2019

Foam mattresses have evolved significantly in the last five years, with mattress manufacturers introducing proprietary foams that integrate cooling gel pods, gel swirls, latex and plant-based ingredients. Foam can be engineered with an open-cell structure to improve breathability, addressing a common concern consumers express before purchasing a foam mattress – sleeping hot.
According to the Polyurethane Foam Association, more than 1.5 billion pounds of foam per year are produced and used in the United States. It’s a fast-growing mattress market, as well. “Most consumers are shocked by the research and technology that goes into today’s foam,” Rogers says. “When people think of a foam bed, they might imagine a block of foam, and that’s not how it is. There are many different layers – a support layer, a comfort layer, some include latex or gel.”
Get a feel for the cross section of a foam mattress before making a purchase. This construction “view” illustrates a foam mattress’s capabilities. Foam mattresses often incorporate three layers: a top comfort layer, a transition layer of foam that might include cooling properties, and a high-density support foam base.
Foam comfort level is basically determined by density, firmness and resilience. Foam density is related to its construction and affects its ability to provide long-lasting support, with higher density related to firmness and more support. The Polyurethane Foam Association says that firmness is measured using the force in pounds required to indent a foam sample by 25% of its original height to get the indentation force deflection, or IFD. Firmness and density are not the same, though higher-density foams are often firmer. As for resilience – a springy feel – this is gauged by dropping a steel ball onto foam and measuring the rebound height. Foam resilience ranges from 20% to 80% rebound, according to the foam association.
Is a foam mattress for you? “Foam does best for people who like the hug or cradle feel vs. a floating-on-top feel,” Magnuson says. Foam mattresses have little, if any, bounce. While cooling gel-infused foams help prevent heat entrapment, other mattress types like innerspring sleep cooler than memory foam. “Foam has the least airflow capability,” he says.
Foam is a petroleum-based product, so consumers might want to seek out foams that are certified by the nonprofit organization CertiPUR-US to not contain ozone-depleting materials, phthalates, formaldehyde or heavy metals, and that are low in emissions of volatile organic compounds, or VOCs. “We have an aggressive compliance effort, and we urge consumers to use our website as a guide,” says Helen Sullivan, communications counsel at CertiPUR-US. She says people’s greatest concern about foam mattresses is whether they are low-VOC. All of the Best Foam Mattresses of 2019 contain certified CertiPUR-US foams.
Read more here: https://www.usnews.com/mattress