Current Affairs
October 22, 2021
Import Delays
A Record $22 Billion Worth Of Cargo Is Now Stuck On Container Ships Off California
by Tyler DurdenFriday, Oct 22, 2021 – 08:31 AM
By Greg Miller of FreightWaves,
There was fleeting hope that Southern California port congestion had turned the corner. The number of container ships waiting offshore dipped to the low 60s and high 50s from a record high of 73 on Sept. 19, trans-Pacific spot rates plateaued, the Biden administration unveiled aspirations for 24/7 port ops, and electricity shortages curbed Chinese factory output.
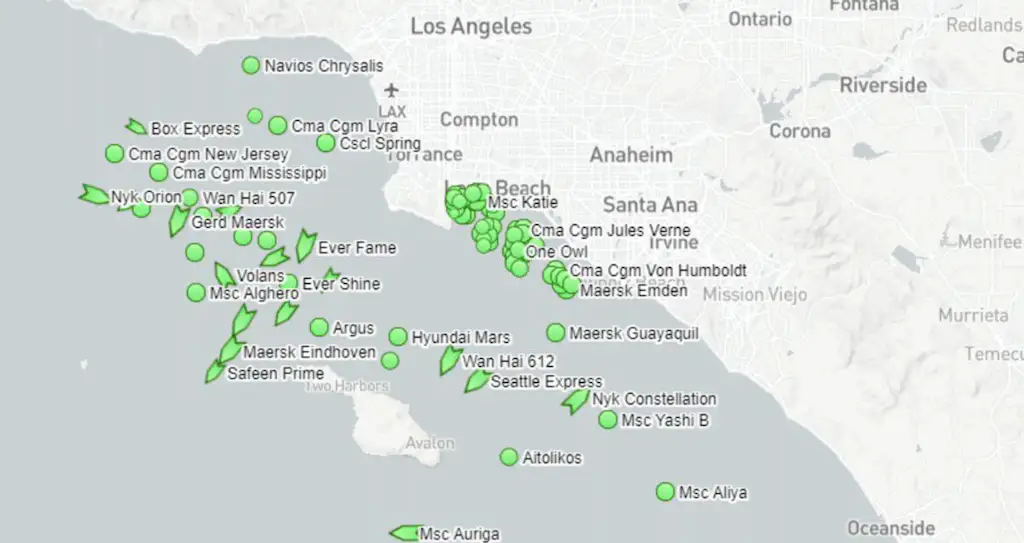
The reality is that the port congestion crisis in Southern California is not getting any better.Container ships off Los Angeles/Long Beach on Wednesday. Map: MarineTraffic
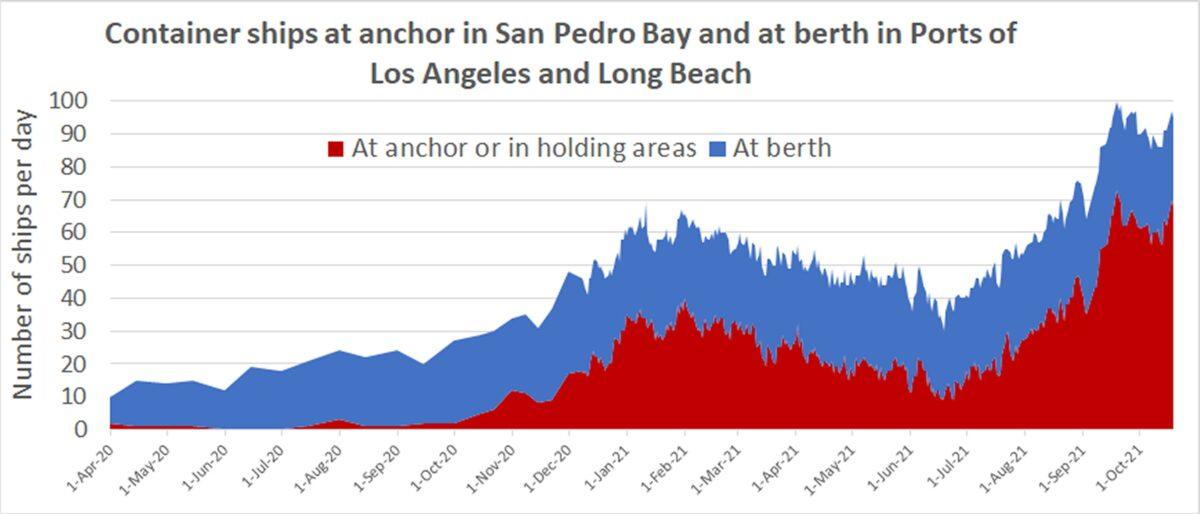
The time ships are stuck waiting offshore continues to lengthen. There are simply too many vessels arriving with too much cargo for terminals, trucks, trains and warehouses to handle. There were 103 container ships at Los Angeles/Long Beach terminals or waiting offshore on Wednesday, an all-time high.
Offshore, the number of ships at anchor or in holding patterns is once again nearing record territory. According to the Marine Exchange of Southern California, 70 container ships were waiting off Los Angeles and Long Beach on Monday, 67 on Tuesday and 71 Wednesday (not including other cargo ships that are loaded with boxes).Chart: American Shipper based on data from Marine Exchange of Southern California. Data bi-monthly April-Nov 2020; daily Dec 2020-present
Massive value of cargo stuck offshore
Marine Exchange data shows that ships waiting offshore on Tuesday — including container ships, general cargo vessels and other ships carrying containers — had aggregate capacity of 512,843 twenty-foot equivalent units. To put that in perspective, that is 10% more than the Port of Los Angeles imported during the entire month of September.
Assuming ships are at capacity, how much cargo value is out there in the “floating warehouse”? What’s in each box, and its value, varies dramatically — it can be worth a few thousand dollars or several hundred thousand dollars. But Port of Los Angeles stats provide a good guide.
The total customs value of the Port of Los Angeles’ containerized imports in 2020 was $211.9 billion. Given that imports totaled 4,827,040 TEUs, this equates to an average of $43,899 per import TEU. (Several other sources also estimated average cargo value at around $40,000 per TEU.)
This suggests that the cargo currently waiting off the ports of Los Angeles and Long Beach is worth around $22 billion, roughly the equivalent of the annual revenues of McDonald’s or the GDP of Iceland.
Imports trapped on ships for over a month
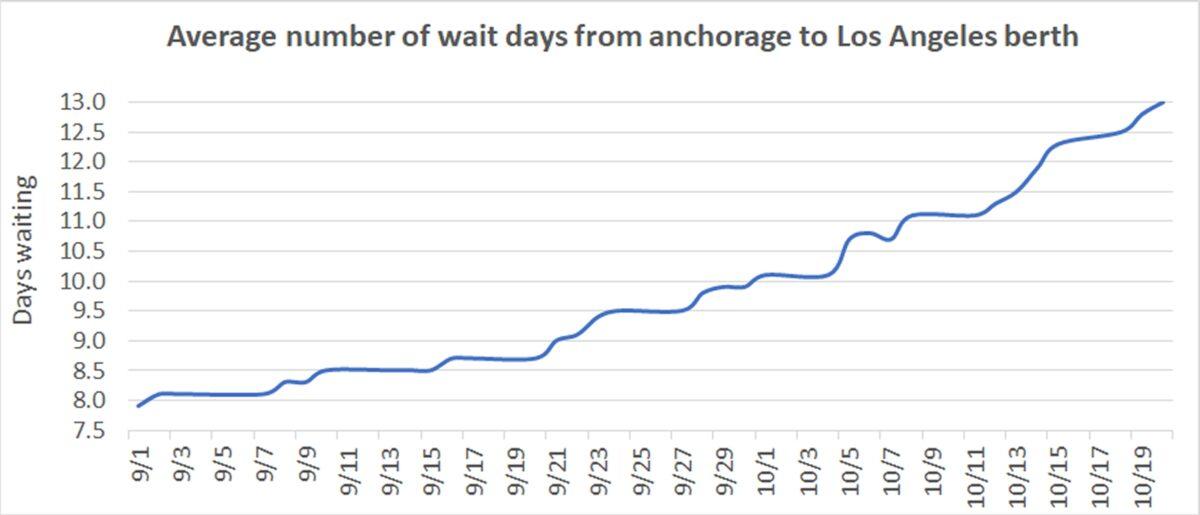
Data from the Signal platform shows that wait time from anchorage to a berth in Los Angeles rose to an all-time high 13 days on Wednesday, up 65% from the beginning of September.Chart: American Shipper based on data from Los Angeles Signal. Note: Average is 30-day trailing average.
But the average wait time doesn’t tell the full story. Ships have been sitting in San Pedro Bay for more than twice that long.
Most of the vessels that still have no terminal berth assignments despite extended wait times are small ships operated by Chinese players such as BAL Container Line that entered the trans-Pacific market for the first time this year. Some of the ships stuck in the queue have been chartered at exorbitant rates, raising the question of whether charterers accounted for such lengthy delays.
American Shipper was contacted by a U.S. manufacturer who has over 100 containers of goods trapped aboard the Chinese-owned Zhong Gu Jiang Su. The ship has been waiting offshore for over five weeks, since Sept. 13, and has yet to obtain a berth assignment, according to the Marine Exchange master queuing list.
The U.S. manufacturer, who booked through a freight forwarder, spoke on condition of anonymity. “This is really impacting our production,” he said, noting that the trapped goods are “a major component” in his company’s manufacturing process.
“We can’t get any type of help or get any type of escalation from anyone,” he said. He was told that the ship operator “hadn’t negotiated with the terminals for a berth” before arrival, which led to the extended delay.
Among the Chinese-linked ships with no berth assignment stuck in the queue, the Martinique has been waiting the longest, since Sept. 9. Loadstar reported that it is on charter to Transfer, which is owned by a Chinese logistics provider that is in turn partially owned by Chinese e-commerce giant Alibaba.
The BAL Peace has been waiting without a berth assignment since Sept. 25, as has the S Santiago.
According to Alphaliner, BAL is chartering the S Santiago for around $125,000 a day. An industry source told American Shipper the rate was $135,000 per day. So far, that ship has been waiting — and not loading any more revenue-generating cargo — for 26 days straight.
https://www.zerohedge.com/economics/22-billion-worth-cargo-now-stuck-container-ships-california
October 22, 2021
Import Delays
A Record $22 Billion Worth Of Cargo Is Now Stuck On Container Ships Off California
by Tyler DurdenFriday, Oct 22, 2021 – 08:31 AM
By Greg Miller of FreightWaves,
There was fleeting hope that Southern California port congestion had turned the corner. The number of container ships waiting offshore dipped to the low 60s and high 50s from a record high of 73 on Sept. 19, trans-Pacific spot rates plateaued, the Biden administration unveiled aspirations for 24/7 port ops, and electricity shortages curbed Chinese factory output.
The reality is that the port congestion crisis in Southern California is not getting any better.Container ships off Los Angeles/Long Beach on Wednesday. Map: MarineTraffic
The time ships are stuck waiting offshore continues to lengthen. There are simply too many vessels arriving with too much cargo for terminals, trucks, trains and warehouses to handle. There were 103 container ships at Los Angeles/Long Beach terminals or waiting offshore on Wednesday, an all-time high.
Offshore, the number of ships at anchor or in holding patterns is once again nearing record territory. According to the Marine Exchange of Southern California, 70 container ships were waiting off Los Angeles and Long Beach on Monday, 67 on Tuesday and 71 Wednesday (not including other cargo ships that are loaded with boxes).Chart: American Shipper based on data from Marine Exchange of Southern California. Data bi-monthly April-Nov 2020; daily Dec 2020-present
Massive value of cargo stuck offshore
Marine Exchange data shows that ships waiting offshore on Tuesday — including container ships, general cargo vessels and other ships carrying containers — had aggregate capacity of 512,843 twenty-foot equivalent units. To put that in perspective, that is 10% more than the Port of Los Angeles imported during the entire month of September.
Assuming ships are at capacity, how much cargo value is out there in the “floating warehouse”? What’s in each box, and its value, varies dramatically — it can be worth a few thousand dollars or several hundred thousand dollars. But Port of Los Angeles stats provide a good guide.
The total customs value of the Port of Los Angeles’ containerized imports in 2020 was $211.9 billion. Given that imports totaled 4,827,040 TEUs, this equates to an average of $43,899 per import TEU. (Several other sources also estimated average cargo value at around $40,000 per TEU.)
This suggests that the cargo currently waiting off the ports of Los Angeles and Long Beach is worth around $22 billion, roughly the equivalent of the annual revenues of McDonald’s or the GDP of Iceland.
Imports trapped on ships for over a month
Data from the Signal platform shows that wait time from anchorage to a berth in Los Angeles rose to an all-time high 13 days on Wednesday, up 65% from the beginning of September.Chart: American Shipper based on data from Los Angeles Signal. Note: Average is 30-day trailing average.
But the average wait time doesn’t tell the full story. Ships have been sitting in San Pedro Bay for more than twice that long.
Most of the vessels that still have no terminal berth assignments despite extended wait times are small ships operated by Chinese players such as BAL Container Line that entered the trans-Pacific market for the first time this year. Some of the ships stuck in the queue have been chartered at exorbitant rates, raising the question of whether charterers accounted for such lengthy delays.
American Shipper was contacted by a U.S. manufacturer who has over 100 containers of goods trapped aboard the Chinese-owned Zhong Gu Jiang Su. The ship has been waiting offshore for over five weeks, since Sept. 13, and has yet to obtain a berth assignment, according to the Marine Exchange master queuing list.
The U.S. manufacturer, who booked through a freight forwarder, spoke on condition of anonymity. “This is really impacting our production,” he said, noting that the trapped goods are “a major component” in his company’s manufacturing process.
“We can’t get any type of help or get any type of escalation from anyone,” he said. He was told that the ship operator “hadn’t negotiated with the terminals for a berth” before arrival, which led to the extended delay.
Among the Chinese-linked ships with no berth assignment stuck in the queue, the Martinique has been waiting the longest, since Sept. 9. Loadstar reported that it is on charter to Transfer, which is owned by a Chinese logistics provider that is in turn partially owned by Chinese e-commerce giant Alibaba.
The BAL Peace has been waiting without a berth assignment since Sept. 25, as has the S Santiago.
According to Alphaliner, BAL is chartering the S Santiago for around $125,000 a day. An industry source told American Shipper the rate was $135,000 per day. So far, that ship has been waiting — and not loading any more revenue-generating cargo — for 26 days straight.
https://www.zerohedge.com/economics/22-billion-worth-cargo-now-stuck-container-ships-california
October 21, 2021
China Conundrum
No Surprises in China’s Slowdown
Q3 GDP growth was largely in line with long-running trends.
By Fisher Investments Editorial Staff, 10/18/2021 Share
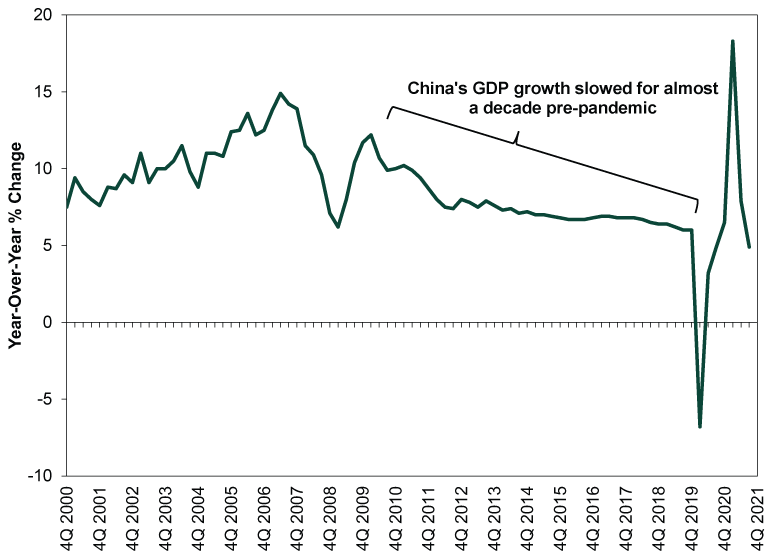
Chinese GDP growth slowed to 4.9% y/y in Q3, with most pundits agreeing the problems at Evergrande and associated real estate woes, combined with September’s electricity shortage, took a big bite out of the economy. While we agree those issues did have some negative effects, most of today’s coverage overstated them and ignored a simple but important point: Q3’s growth rate is right in line with the long-running trend. In our view, that makes these results a return to pre-pandemic normal, not a sign of sudden big problems in the world’s second-largest economy—a fine backdrop for stocks.
Also lost in most coverage: Chinese GDP is so far on track to meet the government’s full-year target of at least 6%, as it is up 9.8% year to date from 2020’s first three quarters.[i] Obviously there is some COVID skew there, but according to China’s National Bureau of Statistics’ (NBS) press release, the compound growth rate over the past two years is 5.2%.[ii] That is very much in line with pre-pandemic growth rates. So is Q3’s 4.9% growth, as Exhibit 1 shows—it largely extends the decade-long slowdown from the double-digit growth rates of old.
Exhibit 1: Slowing Growth Is the Norm in China
Source: FactSet, as of 10/18/2021.
Much of the sour sentiment today stemmed not from the headline GDP figure, but from September data—specifically industrial production and real estate. The former slowed to 3.1% y/y, the lowest rate since last year’s lockdowns, which pundits interpreted as a sign that the energy crunch is taking a big toll on factories.[iii] Yet slow growth isn’t contraction. Take this with a grain of salt or two, as the accuracy of seasonal adjustments is an open question, but industrial production was about flat month-over-month (up 0.05%, according to the NBS).[iv] Even if reality was a bit worse than that, it doesn’t point to electricity shortages sucker punching heavy industry. Rather, it points to the sector overall doing what it could in the face of a stiff headwind.
Reading into any one month as a sign of things to come is generally an error, but we think that is especially true of September’s industrial production. The electricity crunch is a one-off negative, not a permanent state. Over the past several days, the government has taken a number of steps to ease the electricity shortage, including easing price controls and beefing up coal production. That suggests the power shortage should ease sooner rather than later, giving factories a shot in the arm.
In our view, reading too much into September’s real estate data is similarly shortsighted. Yes, home sales fell -16.9% y/y in the month.[v] But is that any wonder, what with uncertainty over Evergrande and other property developers weighing on sentiment? And with regulators directing banks to restrict credit for developers and home buyers? Those restrictions are already easing, which should help sales stabilize looking forward. Plus, even with the late-summer swoon, home sales are up a whopping 17.8% year to date through September versus 2020’s first 9 months.[vi] Meanwhile, residential real estate investment fell a much milder -1.6% y/y in the month and is up 10.9% year to date.[vii] Here too, we wouldn’t read into one month, but the sharp divide between September’s sales and investment activity shows Evergrande’s woes aren’t representative of the property sector as a whole. The central bank’s recent measures easing liquidity for property developers should further support stability.
At a philosophical level, we think the heightened focus on heavy industry and real estate shows that the West broadly has an inaccurate view of China’s economy. Several outlets have claimed real estate is responsible for 29% of Chinese GDP, which they calculate by folding in furniture sales, construction and anything tangentially related to the sale of a home. In our view, all the assumptions folded into that figure are debatable, making it more accurate to look at pure real estate only. That figure—real estate, renting and leasing activities—was just north of 10% of GDP pre-pandemic, which is bigger than the US but not the driving economic force.[viii] Even if you fold construction into that—which includes a lot of things unrelated to residential and commercial real estate—you wind up at 17%, not nearly 30%.
Similarly, while manufacturing is more important economically in China than in more developed countries, it was still only about 39% of pre-pandemic GDP.[ix] Services, which gets far less attention, now generates the majority of Chinese GDP—53.1% pre-pandemic and in 2020.
China’s economy isn’t in perfect shape, but last we checked, no economy in the history of the world was ever perfect. All economies have pockets of strength and weakness at any given time. China’s weaker pockets are getting all the attention right now, but the stronger areas are more than offsetting them and helping the world’s second-largest economy continue adding to global GDP. That is a just-fine economic environment for stocks globally, in our view.
https://www.fisherinvestments.com/en-us/marketminder/no-surprises-in-chinas-slowdown
October 21, 2021
China Conundrum
No Surprises in China’s Slowdown
Q3 GDP growth was largely in line with long-running trends.
By Fisher Investments Editorial Staff, 10/18/2021 Share
Chinese GDP growth slowed to 4.9% y/y in Q3, with most pundits agreeing the problems at Evergrande and associated real estate woes, combined with September’s electricity shortage, took a big bite out of the economy. While we agree those issues did have some negative effects, most of today’s coverage overstated them and ignored a simple but important point: Q3’s growth rate is right in line with the long-running trend. In our view, that makes these results a return to pre-pandemic normal, not a sign of sudden big problems in the world’s second-largest economy—a fine backdrop for stocks.
Also lost in most coverage: Chinese GDP is so far on track to meet the government’s full-year target of at least 6%, as it is up 9.8% year to date from 2020’s first three quarters.[i] Obviously there is some COVID skew there, but according to China’s National Bureau of Statistics’ (NBS) press release, the compound growth rate over the past two years is 5.2%.[ii] That is very much in line with pre-pandemic growth rates. So is Q3’s 4.9% growth, as Exhibit 1 shows—it largely extends the decade-long slowdown from the double-digit growth rates of old.
Exhibit 1: Slowing Growth Is the Norm in China
Source: FactSet, as of 10/18/2021.
Much of the sour sentiment today stemmed not from the headline GDP figure, but from September data—specifically industrial production and real estate. The former slowed to 3.1% y/y, the lowest rate since last year’s lockdowns, which pundits interpreted as a sign that the energy crunch is taking a big toll on factories.[iii] Yet slow growth isn’t contraction. Take this with a grain of salt or two, as the accuracy of seasonal adjustments is an open question, but industrial production was about flat month-over-month (up 0.05%, according to the NBS).[iv] Even if reality was a bit worse than that, it doesn’t point to electricity shortages sucker punching heavy industry. Rather, it points to the sector overall doing what it could in the face of a stiff headwind.
Reading into any one month as a sign of things to come is generally an error, but we think that is especially true of September’s industrial production. The electricity crunch is a one-off negative, not a permanent state. Over the past several days, the government has taken a number of steps to ease the electricity shortage, including easing price controls and beefing up coal production. That suggests the power shortage should ease sooner rather than later, giving factories a shot in the arm.
In our view, reading too much into September’s real estate data is similarly shortsighted. Yes, home sales fell -16.9% y/y in the month.[v] But is that any wonder, what with uncertainty over Evergrande and other property developers weighing on sentiment? And with regulators directing banks to restrict credit for developers and home buyers? Those restrictions are already easing, which should help sales stabilize looking forward. Plus, even with the late-summer swoon, home sales are up a whopping 17.8% year to date through September versus 2020’s first 9 months.[vi] Meanwhile, residential real estate investment fell a much milder -1.6% y/y in the month and is up 10.9% year to date.[vii] Here too, we wouldn’t read into one month, but the sharp divide between September’s sales and investment activity shows Evergrande’s woes aren’t representative of the property sector as a whole. The central bank’s recent measures easing liquidity for property developers should further support stability.
At a philosophical level, we think the heightened focus on heavy industry and real estate shows that the West broadly has an inaccurate view of China’s economy. Several outlets have claimed real estate is responsible for 29% of Chinese GDP, which they calculate by folding in furniture sales, construction and anything tangentially related to the sale of a home. In our view, all the assumptions folded into that figure are debatable, making it more accurate to look at pure real estate only. That figure—real estate, renting and leasing activities—was just north of 10% of GDP pre-pandemic, which is bigger than the US but not the driving economic force.[viii] Even if you fold construction into that—which includes a lot of things unrelated to residential and commercial real estate—you wind up at 17%, not nearly 30%.
Similarly, while manufacturing is more important economically in China than in more developed countries, it was still only about 39% of pre-pandemic GDP.[ix] Services, which gets far less attention, now generates the majority of Chinese GDP—53.1% pre-pandemic and in 2020.
China’s economy isn’t in perfect shape, but last we checked, no economy in the history of the world was ever perfect. All economies have pockets of strength and weakness at any given time. China’s weaker pockets are getting all the attention right now, but the stronger areas are more than offsetting them and helping the world’s second-largest economy continue adding to global GDP. That is a just-fine economic environment for stocks globally, in our view.
https://www.fisherinvestments.com/en-us/marketminder/no-surprises-in-chinas-slowdown
October 21, 2021
Driver Issues
ILMA ’21: US trucking issues here to stay
Author: Amanda Hay
2021/10/12
PHOENIX (ICIS)–Trucking issues topped a long list of supply-chain concerns at the Independent Lubricant Manufacturers Association (ILMA) annual meeting and there are few signs of relief.
“This is a challenge like we’ve never seen before,” Bob Costello, chief economist and senior vice president at the American Trucking Associations (ATA), told delegates at Tuesday’s Managing Shipping and Transportation Challenges session.
Costello pointed to year-on-year strength in three main drivers of truck freight: Retail sales (up 20.6%), single-family housing starts (up 23.2%) and manufacturing output (up 7.6%).
“These are not only increasing, they’re increasing nicely,” Costello said, adding that inventories at the retail level are near historic lows.
Manufacturing output is slowing a bit and Costello’s forecast is just under 7% for the year.
How are loads down?
“Supply, supply, supply,” Costello said, meaning availability of both trucks and truck drivers.
Total for-hire contract revenue per mile is up 17.5% in August/September.
“We’ve never seen this,” he said, adding that spot market rates are up by 25.5% for those two months.
Yet fleet counts are declining, with a 5.5% decline in 2021 compared with 2020, which itself was down 2.4% from 2019, according to ATA data.
Trucking lines are reducing truck counts because of the inability to add drivers, selling parked trucks and independent contractors going to the spot market.
“If you were to go back in time and show me this slide (5.5% reduction in 2021), I’d say we’re in a recession,” Costello said. “Obviously, we’re not. We can’t get enough drivers.”
Costello said one ATA member typically buys 100 new trucks every year, but this year they will get none.
Part of the issue is chip shortages, but Costello said that a large original equipment manufacturer (OEM) said that the chip shortage is masking several other supply-chain issues.
“I’ve got fleets telling me they can sell a three-year-old tractor for almost as much as they bought it for new,” Costello said.
Additionally, companies are taking parts from other trucks to keep fleets moving, he said.
Costello said the driver shortage is not new, but is getting worse and driven by demographics and lifestyle.
The average age of long-haul truck drivers is well over 50 and predominantly male, despite females accounting for 47% of the US workforce. New trainees average 35 years old, so the age issue is not improving.
Lifestyle is growing as an inhibitor to attracting drivers, who would rather spend more time at home and be freer in their downtime – meaning they would rather not be drug and alcohol tested – Costello said.
With drivers leaving the industry, the average weekly earnings are increasing at five times the historical average, Costello said, but it goes only so far.
“The best we have done is stop the hemorrhaging,” he said.
Long-haul drivers were down by 21,200 in 2020 and another 200 in 2021, while local truck drivers rose by 5,000 in 2020 and 11,700 in 2021, according to the ATA.
E-commerce delivery workers have grown from 555,000 in 2017 to nearly a million in 2021. These jobs allow workers to be at home every night and they do not randomly drug test like long-haul companies, Costello said.
Jim Mancini, vice president of North American surface transportation for CH Robinson, echoed Costello in saying supply is the main driver.
The trucking market is seeing high fleet utilisation and when that happens, any disruption has an exponential impact on shippers.
Weather and other disruptions, particularly on the Gulf Coast, take months to improve compared with a couple of days previously when the market was not as tight.
Moving to other modes, like rail, does not help as the interdependency creates further disruption, he said, adding that labour shortages result in load/unload times ballooning to two to three hours.
Neither speaker sees improvement in the near term.
“The only way this gets better is the economy slows down, but I don’t see that happening,” Costello said.
Mancini stressed the importance of being flexible, spreading out shipments through the week and optimising your equipment’s use in a day.
“Do everything you can to eliminate waste in load/unload times,” he said.
Asked about driverless technology, Costello said it is moving along and he expects to see an autopilot option for highway trucking in three to five years.
“If any of you are waiting for autonomous trucks, you’ll be out of business. You are not going to take the driver out of the seat for a very, very long time.”
The ILMA annual meeting runs through Tuesday in Phoenix, Arizona.
Focus article by Amanda Hay
 Everchem Updates Archive
 Sign Up for Email Updates