Epoxy
February 13, 2021
Container Traffic in CA
New Video Shows Massive California Container Ship Traffic Jam
by Tyler DurdenFriday, Feb 12, 2021 – 19:40
By Greg Miller of American Shipper
Newly released U.S. Coast Guard video offers visceral proof of just how extreme the congestion has become at the ports of Los Angeles and Long Beach. The new view from above reveals a vast armada of container ships scattered at anchor across California’s San Pedro Bay.
As the Coast Guard footage paints the picture, the latest data from the Port of Los Angeles and from the Marine Exchange of Southern California tells the story behind those images.
The data confirms that there has been no real let-up in the historic container-ship traffic jam off California’s coast.
As of Thursday, there were 25 container ships at berth in Los Angeles and Long Beach. Thirty-two container ships were at anchorage. That’s roughly the same level that has been at anchor since the beginning of this year. (The record of 40 container ships at anchor was hit on Feb. 1).
The Port of Los Angeles, via its platform, The Signal, recently began disclosing the number of days at anchor for specific container ships. The numbers confirm that some vessels are spending almost as much time at anchor as it takes to traverse the Pacific Ocean.
As of Thursday, the Ever Envoy, with a capacity of 6,332 twenty-foot equivalent units (TEUs), had been at anchor for 11 days. Other ships that had just gone to berth had been waiting just as long: As of Tuesday , the 9,400-TEU MSC Romane had been at anchor for 12 days. The 11,356-TEU CMA CGM Andromeda, 8,452-TEU Ever Liven and 4,888-TEU NYK Nebula for 11 days.
The Signal indicated that the average time at anchor for ships calling in Los Angeles was 8 days as of Thursday, up from 6.9 days on Tuesday. The Signal has provided information on ship waiting times since Jan. 27. Waiting time has remained at an average of around one week since then.
What’s Causing the Traffic Jam
Extended anchorage times have forced some ocean carriers to cancel multiple sailings this month. Not due to lack of cargo demand, but rather, due to lack of available ships to handle those services.
Delays on the landside are causing the logjam at sea. Extremely high inbound volumes combined with logistical complications both inside and outside the ports are causing the landside delays. One of the challenges inside the ports involves COVID infections among dockworkers. The International Longshore and Warehouse Union (ILWU) reported 694 of its members had tested positive as of Jan. 17. By Jan. 25, the number had jumped to 803.
Charting the course of congestion
As previously reported by American Shipper, the number of container ships at anchor already exceeds the number during the labor dispute between the ILWU and their employers in 2014-15.
The Marine Exchange provided American Shipper with historical data starting in January 2019 to put the current backlog of container ships into perspective.
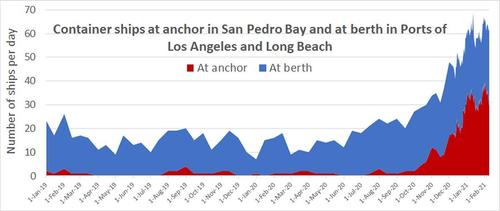
The data shows that the number of container ships at berth started to ramp up in July. A steady rise in the number of ships at anchor began in November. By year end, the number of container ships at anchor had risen to 30. It has remained between the high 20s and up to 40 ships ever since. Meanwhile, the number of ships at the berths in Los Angeles and Long Beach has remained in the high 20s and low 30s.
Kip Louttit, executive director of the Marine Exchange of Southern California, told American Shipper: “We seem to have settled into a new, new normal of roughly 30 container ships at anchor. Whether that will continue or not, I don’t know.”
Consumers to see emptier shelves
That new, new normal will be increasingly felt by consumers. Lauren Brand, president of the National Association of Waterfront Employers, testified at a House subcommittee hearing on Tuesday that ships currently offshore hold around 190,000 truckloads of goods.
“Right now, there are containers holding parts for manufacturing and assembly sites in the United States. We’re going to see some of those start to falter in their schedules the longer this goes on.
“I asked one of my local retailers, Chico’s, if they had certain spring colors. They said ‘no,’ because they were stuck at the port,” said Brand.
“We’re seeing a decline in the fashion market. Maybe some Valentine’s Day goods are stuck. We’ll see Easter goods getting stuck. And we’ll see things that are actually arriving too late to go to market. So, there will be an economic impact, from consumer goods to manufacturing.”
https://www.zerohedge.com/commodities/new-video-shows-massive-california-container-ship-traffic-jam
February 12, 2021
Trucking Costs Keep Rising, Availability Shrinks
Trucking contract rates up 12% year-over-year
Zach Strickland, FW Market Expert & Market Analyst Follow on Twitter Saturday, February 6, 20211 1,911 3 minutes read


Chart of the Week: Van Contract Base Rate per Mile, Van Outbound Tender Rejection Index, Truckstop.com 7-day rate per mile Van– USA SONAR: VCRPMF.USA, VOTRI.USA, TSTOPVRPM.USA
Shippers spent 12% more per mile for dry van truckloads on average through most of the fourth quarter of 2020 than they did in 2019. That is according to FreightWaves’ newest dataset that measures trends in long-term rates (not spot rates) between shippers and van carriers, Van Contract Base Rate Rate per Mile (VCRPMF).
Trucking costs have been trending higher since late June, following a dramatic increase in the Van Outbound Tender Reject Index (VOTRI). The tender rejection indices measure the rate at which carriers reject shippers’ requests for capacity. Higher rejection rates indicate less capacity, which leads to shippers moving down their carrier lists — also known as route guides — looking for coverage. As they move down the list, rates tend to be higher and service deteriorates.
A large portion of these rate increases represented in the chart are the result of shippers moving down their route guide searching for coverage. Many of these loads do not appear on the spot market, which has long been the main barometer for measuring truckload rate fluctuations. Most loads that end up on the spot market are last resorts for larger companies that rely heavily on contracted agreements.
Spot rates, represented by Truckstop.com’s seven-day average in the chart, move wildly compared to the long-term contract rates and represent, by many estimates, less than 15% of the overall for-hire van truckload market in an average year. It can be difficult to discern how representative spot rates can be of the much larger underlying contracted market.
A wave of consumer demand fueled by an unprecedented stimulus package and a surprising economic recovery for durable goods strained trucking networks in the second half of 2020. Many companies reportedly went to carriers with self-implemented rate increases in attempts to lock down more capacity. This is not a standard practice as shippers typically hold the upper hand in negotiating with carriers due to the highly competitive trucking environment. Carriers bid for shippers’ freight in most cases, not the other way around.
The mechanic shippers use to establish long-term rate agreements, known as contract rates inside the industry, is called a bid or request for pricing (RFP). Companies send their bids out to carriers asking for them to offer their best price for each lane. Most of this activity occurs between Thanksgiving and March as budgets are being established.
Knowing many new contracts have not been implemented, it is safe to assume a large portion of the recent implied rate increase will stick. Tender rejection rates remain over 20% and spot rates are still well above contract by a large amount in what is typically considered the off-season.
Increasing contract rates should help encourage increasing carrier acceptances and lower spot rates, but there are still plenty of potential disrupting factors available.
Not out of the woods yet
On the demand side, the industrial sector is slowly making a comeback, which was largely absent from the volumes in 2020. A massive restocking event is taking place with shippers having sourcing issues thanks to COVID limiting production.
The maritime shipping industry is more out of balance than the domestic trucking space as container shortages and record shipping rates are persisting through the normally slow Chinese New Year holiday in Asia, where most of the U.S. consumer products are made. The result is a very uneven flow of freight into the country, which is difficult for carriers to manage.
The supply side of the equation is not as healthy as it was in 2018, when carriers placed record orders of equipment and quickly oversupplied the market in 2019. Driver schools remain half full and the recently implemented Drug and Alcohol Clearinghouse is doing its job by limiting the available pool of drivers who have drug and/or alcohol violations. Many who fail do not return.
The nor’easter that hit the East Coast this week pushed national rejections higher, illustrating just how fragile carrier networks are in the slower part of the year. There may be room to grow yet.
About the Chart of the Week
The FreightWaves Chart of the Week is a chart selection from SONAR that provides an interesting data point to describe the state of the freight markets. A chart is chosen from thousands of potential charts on SONAR to help participants visualize the freight market in real time. Each week a Market Expert will post a chart, along with commentary, live on the front page. After that, the Chart of the Week will be archived on FreightWaves.com for future reference.
SONAR aggregates data from hundreds of sources, presenting the data in charts and maps and providing commentary on what freight market experts want to know about the industry in real time.
The FreightWaves data science and product teams are releasing new data sets each week and enhancing the client experience.
To request a SONAR demo, click here.
February 12, 2021
Trucking Costs Keep Rising, Availability Shrinks
Trucking contract rates up 12% year-over-year
Zach Strickland, FW Market Expert & Market Analyst Follow on Twitter Saturday, February 6, 20211 1,911 3 minutes read
Chart of the Week: Van Contract Base Rate per Mile, Van Outbound Tender Rejection Index, Truckstop.com 7-day rate per mile Van– USA SONAR: VCRPMF.USA, VOTRI.USA, TSTOPVRPM.USA
Shippers spent 12% more per mile for dry van truckloads on average through most of the fourth quarter of 2020 than they did in 2019. That is according to FreightWaves’ newest dataset that measures trends in long-term rates (not spot rates) between shippers and van carriers, Van Contract Base Rate Rate per Mile (VCRPMF).
Trucking costs have been trending higher since late June, following a dramatic increase in the Van Outbound Tender Reject Index (VOTRI). The tender rejection indices measure the rate at which carriers reject shippers’ requests for capacity. Higher rejection rates indicate less capacity, which leads to shippers moving down their carrier lists — also known as route guides — looking for coverage. As they move down the list, rates tend to be higher and service deteriorates.
A large portion of these rate increases represented in the chart are the result of shippers moving down their route guide searching for coverage. Many of these loads do not appear on the spot market, which has long been the main barometer for measuring truckload rate fluctuations. Most loads that end up on the spot market are last resorts for larger companies that rely heavily on contracted agreements.
Spot rates, represented by Truckstop.com’s seven-day average in the chart, move wildly compared to the long-term contract rates and represent, by many estimates, less than 15% of the overall for-hire van truckload market in an average year. It can be difficult to discern how representative spot rates can be of the much larger underlying contracted market.
A wave of consumer demand fueled by an unprecedented stimulus package and a surprising economic recovery for durable goods strained trucking networks in the second half of 2020. Many companies reportedly went to carriers with self-implemented rate increases in attempts to lock down more capacity. This is not a standard practice as shippers typically hold the upper hand in negotiating with carriers due to the highly competitive trucking environment. Carriers bid for shippers’ freight in most cases, not the other way around.
The mechanic shippers use to establish long-term rate agreements, known as contract rates inside the industry, is called a bid or request for pricing (RFP). Companies send their bids out to carriers asking for them to offer their best price for each lane. Most of this activity occurs between Thanksgiving and March as budgets are being established.
Knowing many new contracts have not been implemented, it is safe to assume a large portion of the recent implied rate increase will stick. Tender rejection rates remain over 20% and spot rates are still well above contract by a large amount in what is typically considered the off-season.
Increasing contract rates should help encourage increasing carrier acceptances and lower spot rates, but there are still plenty of potential disrupting factors available.
Not out of the woods yet
On the demand side, the industrial sector is slowly making a comeback, which was largely absent from the volumes in 2020. A massive restocking event is taking place with shippers having sourcing issues thanks to COVID limiting production.
The maritime shipping industry is more out of balance than the domestic trucking space as container shortages and record shipping rates are persisting through the normally slow Chinese New Year holiday in Asia, where most of the U.S. consumer products are made. The result is a very uneven flow of freight into the country, which is difficult for carriers to manage.
The supply side of the equation is not as healthy as it was in 2018, when carriers placed record orders of equipment and quickly oversupplied the market in 2019. Driver schools remain half full and the recently implemented Drug and Alcohol Clearinghouse is doing its job by limiting the available pool of drivers who have drug and/or alcohol violations. Many who fail do not return.
The nor’easter that hit the East Coast this week pushed national rejections higher, illustrating just how fragile carrier networks are in the slower part of the year. There may be room to grow yet.
About the Chart of the Week
The FreightWaves Chart of the Week is a chart selection from SONAR that provides an interesting data point to describe the state of the freight markets. A chart is chosen from thousands of potential charts on SONAR to help participants visualize the freight market in real time. Each week a Market Expert will post a chart, along with commentary, live on the front page. After that, the Chart of the Week will be archived on FreightWaves.com for future reference.
SONAR aggregates data from hundreds of sources, presenting the data in charts and maps and providing commentary on what freight market experts want to know about the industry in real time.
The FreightWaves data science and product teams are releasing new data sets each week and enhancing the client experience.
To request a SONAR demo, click here.
February 12, 2021
Huntsman Posts Solid Quarter
Huntsman Announces Fourth Quarter and Full Year 2020 Earnings; Strong Recovery with Solid Cash Flow
Download as PDF February 12, 2021 6:00am EST
THE WOODLANDS, Texas, Feb. 12, 2021 /PRNewswire/ —
Fourth Quarter Highlights
- Fourth quarter 2020 net income of $360 million compared to net income of $308 million in the prior year period; fourth quarter 2020 diluted earnings per share of $1.54 compared to diluted earnings per share of $1.34 in the prior year period.
- Fourth quarter 2020 adjusted net income of $113 million compared to adjusted net income of $65 million in the prior year period; fourth quarter 2020 adjusted diluted earnings per share of $0.51 compared to adjusted diluted earnings per share of $0.29 in the prior year period.
- Fourth quarter 2020 adjusted EBITDA of $240 million compared to adjusted EBITDA of $182 million in the prior year period.
- Fourth quarter 2020 net cash provided by operating activities from continuing operations was $167 million. Free cash flow from continuing operations was $88 million for the fourth quarter 2020 and adjusted free cash flow from continuing operations was $157 million.
- Balance sheet remains strong with a net leverage of 0.8x and total liquidity is approximately $3 billion. On January 15, 2021 we redeemed in full €445 million (approximately $541 million) in aggregate principle amount of our 5.125% Senior notes due 2021 at par from available cash.
- Completed the sale of Venator Materials PLC ordinary shares to funds advised by SK Capital on December 23, 2020. Together with estimated cash tax savings of approximately $150 million, which this transaction facilitated, secured an aggregate total cash benefit of approximately $250 million.
- Announced the acquisition of Gabriel Performance Products within our Advanced Materials segment for $250 million on December 7, 2020, which was completed on January 15, 2021.
- In our Company wide optimization efforts, we are now targeting annualized savings and acquisition integration synergies in excess of $120 million, to be achieved by mid-2023. $27 million of targeted annualized savings achieved in 2020.
Peter R. Huntsman, Chairman, President and CEO, commented:
“In the midst of a very challenging 2020, our commitment was to emerge stronger and better. I am very pleased to report that we were able to exceed our expectations. Our fourth quarter adjusted EBITDA significantly exceeded our fourth quarter of a year ago, even despite a lagging recovery in Aerospace. We also delivered a solid fourth quarter and full year free cash flow, beyond what we anticipated. We had added three highly complementary, differentiated businesses to our core portfolio, and are on track to deliver on over $40 million of annualized related synergies. Together with our cost realignment and business optimization plans, we target in excess of $120 million of annualized benefits by mid-2023. Our balance sheet remains very strong. While we are prepared for macro uncertainties to continue in 2021, we see steady improvements over 2020 in most of our core markets and we remain totally committed to creating value for our shareholders.”
Segment Analysis for 4Q20 Compared to 4Q19
Polyurethanes
The increase in revenues in our Polyurethanes segment for the three months ended December 31, 2020 compared to the same period in 2019 was primarily due to higher MDI average selling prices, partially offset by lower sales volumes. Both differentiated and component MDI average selling prices increased primarily in China and Europe. MDI sales volumes decreased primarily due to unplanned supplier outages. The increase in segment adjusted EBITDA was primarily due to higher MDI margins driven by higher MDI pricing, partially offset by lower MDI sales volumes.
Advanced Materials
The decrease in revenues in our Advanced Materials segment for the three months ended December 31, 2020 compared to the same period in 2019 was primarily due to lower sales volumes, predominantly due to weakness in our aerospace and commodity markets. Sales volumes decreased across most markets primarily due to economic slowdown and customer destocking. Segment adjusted EBITDA decreased due to lower sales volumes, partially offset by lower fixed costs. The adjusted EBITDA contribution from our recent acquisition of CVC Thermoset Specialties was offset by the lost adjusted EBITDA from the divestiture of our India-based DIY consumer adhesives business.