The Urethane Blog
November 23, 2022
New Home Sales Unexpectedly Jump In October, Prices Surged To Record Highs
by Tyler Durden
Wednesday, Nov 23, 2022 – 10:18 AM
After existing home sales tumbled, new home sales were expected to follow suit amid soaring borrowing costs and ever-higher prices (despite building inventories and incentives by homebuilders). They didn’t…
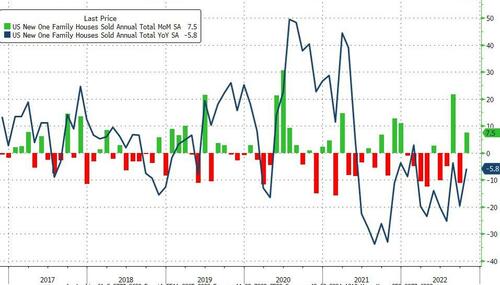
The magical numbers from NAR showed new home sales rose 7.5% MoM (massively different from the 5.5% decline expected) which leaves new home sales down 5.8% YoY…
Source: Bloomberg
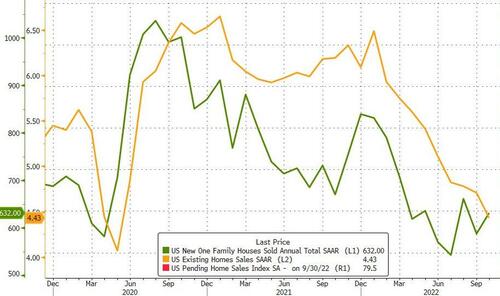
The total new home sales SAAR is hovering around the COVID lockdown lows…
Source: Bloomberg
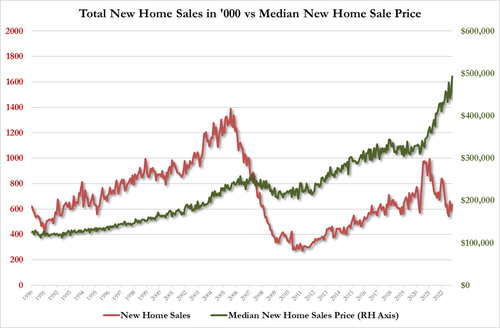
Analysts suggest massive incentive programs drove this surprise jump in sales but median new home prices shot up to a record $493,000!!
Sales in the South rebounded after a sharp retreat a month earlier when Hurricane Ian slammed into Florida and parts of Georgia and South Carolina. The October pace in the South was still slower than in August.
There were 470,000 new homes for sale as of the end of last month, though the overwhelming majority remain under construction or not yet started. The number of for-sale dwellings under construction, however, was the smallest in six months. At the current sales pace, it would take 8.9 months to exhaust the supply of new homes.
Earlier this month, Michael Murray, co-chief operating officer at D.R. Horton Inc., one of the largest US homebuilders, said the company closed fewer homes than expected in the latest quarter due to slower sales, more cancellations and continued construction delays.
Finally, given the total collapse in homebuilder confidence (about future sales), which still has a long way to go to catch down to the collapse in homebuyer confidence, we would suggest real estate agents ‘brace, brace, brace’…

Source: Bloomberg
November 23, 2022
New Home Sales Unexpectedly Jump In October, Prices Surged To Record Highs
by Tyler Durden
Wednesday, Nov 23, 2022 – 10:18 AM
After existing home sales tumbled, new home sales were expected to follow suit amid soaring borrowing costs and ever-higher prices (despite building inventories and incentives by homebuilders). They didn’t…
The magical numbers from NAR showed new home sales rose 7.5% MoM (massively different from the 5.5% decline expected) which leaves new home sales down 5.8% YoY…
Source: Bloomberg
The total new home sales SAAR is hovering around the COVID lockdown lows…
Source: Bloomberg
Analysts suggest massive incentive programs drove this surprise jump in sales but median new home prices shot up to a record $493,000!!
Sales in the South rebounded after a sharp retreat a month earlier when Hurricane Ian slammed into Florida and parts of Georgia and South Carolina. The October pace in the South was still slower than in August.
There were 470,000 new homes for sale as of the end of last month, though the overwhelming majority remain under construction or not yet started. The number of for-sale dwellings under construction, however, was the smallest in six months. At the current sales pace, it would take 8.9 months to exhaust the supply of new homes.
Earlier this month, Michael Murray, co-chief operating officer at D.R. Horton Inc., one of the largest US homebuilders, said the company closed fewer homes than expected in the latest quarter due to slower sales, more cancellations and continued construction delays.
Finally, given the total collapse in homebuilder confidence (about future sales), which still has a long way to go to catch down to the collapse in homebuyer confidence, we would suggest real estate agents ‘brace, brace, brace’…
Source: Bloomberg
November 19, 2022
Visualizing America’s Changing Demographics Over The Past 100 Years
by Tyler Durden
Friday, Nov 18, 2022 – 08:00 PM
The United States has famously been called a melting pot, due its demographic makeup of various cultures, races, religions, and languages. But what shape does that mixture take? And how has it changed over time?
Beginning over 100 years ago, this video from Kaj Tallungs assesses how America’s demographics have changed from 1901 to 2020. It uses data from multiple sources including the U.S. Census Bureau, the National Center for Health Statistics, and the Human Mortality Database.
A Look at the Total Population
As Visual Capitalist’s Avery Koop notes, the most obvious takeaway from this animation is that America’s population has soared over the last century. America’s population grew from 77 million in 1901 to over 330 million in 2020—or total growth of 330% over the 119 years.
And the U.S. has continued to add to its population totals. Here’s a brief look at at the population in 2021 by regional breakdowns:

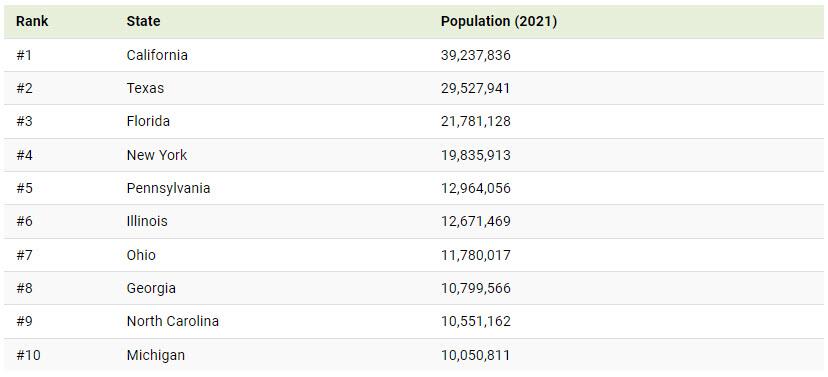
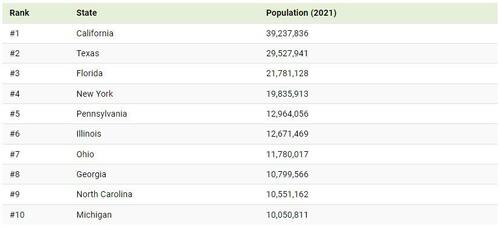
And here’s a glance at how some of the population shakes out, across the top 10 most populous states in the country:
Demographic Breakdowns
Diving a little deeper, the country’s demographic breakdowns have also changed significantly over the last 100+ years. While the share of men and women is an obvious near-even split, age and race distributions have changed drastically.
For starters, though birth rates have remained fairly strong in the U.S., they have been slowing over time. This is similar to many other Western countries, and can eventually result in a larger share of elderly people as well as an increased financial cost of subsidizing their care. Additionally, fewer births results in a depleting workforce as the young population shrinks.
The shares of Black, Asian, Hispanic, and people of two or more races have also been growing. In fact, between 2010–2020 the population of people identifying as two races or more increased by a whopping 276%.
Here’s a glance at some of the other demographic growth rates over the 2010-2020 period:
- Black or African American alone population: +5.6%
- Asian alone population: +35.5%
- Hispanic or Latino alone population: +23%
- White population: -9%
Looking Ahead
Like many countries, a “graying” of the population will become a concern in the United States.
By 2060, it is expected that 95 million Americans will be over 65. But the share of those 18 and under will also continue to grow (albeit at a much slower pace) from 74 million people in 2020 to 80 million in 2060.
Another interesting insight from the Census Bureau is that from 2016–2060, the American-born population is expected to grow by only 20%, whereas the foreign-born population—the share of population who will immigrate to the U.S.—is expected to rise 58%.
True to the melting pot moniker, America’s demographics will continue to change dramatically over the coming decades.
https://www.zerohedge.com/economics/visualizing-americas-changing-demographics-over-past-100-years
November 19, 2022
Visualizing America’s Changing Demographics Over The Past 100 Years
by Tyler Durden
Friday, Nov 18, 2022 – 08:00 PM
The United States has famously been called a melting pot, due its demographic makeup of various cultures, races, religions, and languages. But what shape does that mixture take? And how has it changed over time?
Beginning over 100 years ago, this video from Kaj Tallungs assesses how America’s demographics have changed from 1901 to 2020. It uses data from multiple sources including the U.S. Census Bureau, the National Center for Health Statistics, and the Human Mortality Database.
A Look at the Total Population
As Visual Capitalist’s Avery Koop notes, the most obvious takeaway from this animation is that America’s population has soared over the last century. America’s population grew from 77 million in 1901 to over 330 million in 2020—or total growth of 330% over the 119 years.
And the U.S. has continued to add to its population totals. Here’s a brief look at at the population in 2021 by regional breakdowns:
And here’s a glance at how some of the population shakes out, across the top 10 most populous states in the country:
Demographic Breakdowns
Diving a little deeper, the country’s demographic breakdowns have also changed significantly over the last 100+ years. While the share of men and women is an obvious near-even split, age and race distributions have changed drastically.
For starters, though birth rates have remained fairly strong in the U.S., they have been slowing over time. This is similar to many other Western countries, and can eventually result in a larger share of elderly people as well as an increased financial cost of subsidizing their care. Additionally, fewer births results in a depleting workforce as the young population shrinks.
The shares of Black, Asian, Hispanic, and people of two or more races have also been growing. In fact, between 2010–2020 the population of people identifying as two races or more increased by a whopping 276%.
Here’s a glance at some of the other demographic growth rates over the 2010-2020 period:
- Black or African American alone population: +5.6%
- Asian alone population: +35.5%
- Hispanic or Latino alone population: +23%
- White population: -9%
Looking Ahead
Like many countries, a “graying” of the population will become a concern in the United States.
By 2060, it is expected that 95 million Americans will be over 65. But the share of those 18 and under will also continue to grow (albeit at a much slower pace) from 74 million people in 2020 to 80 million in 2060.
Another interesting insight from the Census Bureau is that from 2016–2060, the American-born population is expected to grow by only 20%, whereas the foreign-born population—the share of population who will immigrate to the U.S.—is expected to rise 58%.
True to the melting pot moniker, America’s demographics will continue to change dramatically over the coming decades.
https://www.zerohedge.com/economics/visualizing-americas-changing-demographics-over-past-100-years
November 17, 2022
LyondellBasell Evaluates Propylene Expansion Project
HOUSTON, Nov. 17, 2022 /PRNewswire/ — LyondellBasell (NYSE: LYB) today announced it is evaluating the expansion of its propylene production capacity at its Channelview Complex near Houston, TX. The potential expansion would involve building a new propylene facility using LyondellBasell’s existing technology to convert ethylene into propylene for use in the production of polypropylene and propylene oxide. The related product lines are used to make everyday items such as flexible foam for mattresses, cosmetic packaging, electrical covering for 5G network infrastructure, plastic wrap for food packaging, medical syringes, vehicle bumpers, furniture upholstery and pipe for home plumbing, to name a few.
“In addition to the lower carbon emissions than competing technologies, we believe the project has more favorable economics compared to other production methods,” said Ken Lane, Executive Vice President Global Olefins & Polyolefins. “The products offered through this investment will be an important element to helping our value chain partners achieve their long-term sustainability ambitions. Additionally, this upstream investment would allow us to be less dependent on propylene market supply and demand, providing us with the opportunity to serve growing customer needs better.”
A final investment decision on this 400 kiloton propylene expansion project is expected towards the end of next year. The project would have an annual capacity of 950 million pounds per year. It would increase the company’s propylene capacity at the Channelview Complex by more than 35 percent and would create approximately 10-15 new jobs.
https://lyondellbasell.mediaroom.com/index.php?s=43&item=1423
 Everchem Updates Archive
 Sign Up for Email Updates