The Urethane Blog
Everchem Updates
VOLUME XXI

September 14, 2023
Everchem’s exclusive Closers Only Club is reserved for only the highest caliber brass-baller salesmen in the chemical industry. Watch the hype video and be introduced to the top of the league: — read more
December 20, 2023
BASF completes its capacity expansion for key specialty amines in the Americas
- Focus on polyetheramines and amine catalysts
- BASF continues to be a reliable supplier to our customers
FLORHAM PARK, NJ, December 12, 2023 – BASF has completed its capacity expansion for key specialty amines manufactured at its Geismar, Louisiana site. As a result, BASF will be able to produce more of its key polyetheramines and amine catalysts marketed under the Baxxodur® and LupragenTM brands.
“This project represents our commitment to growth in the Americas market,” said Kevin Anderson, Vice President, Business Management Amines, Acetylenics and Carbonyl Derivatives, Chemical Intermediates, North America for BASF. “Our Geismar site was the ideal location for this expansion thanks to its existing infrastructure and skilled workforce.”
BASF’s Baxxodur portfolio is utilized by customers as highly efficient curing agents and chain extenders in epoxy and polyurea applications for the wind, electrical, composites, adhesives and flooring industries. The usage of Baxxodur products allows customers to achieve a wide range of benefits in their formulation, including improved curing time, hardness, flexibility, peel strength and chemical and temperature resistance.
BASF’s Lupragen products are highly efficient amine catalysts for Polyurethanes (PU). Those catalysts are typically tertiary amines, which are required to facilitate the reaction of the main components – isocyanate and polyol. Depending on the choice of catalyst, the polyurethane forming process can be controlled to enhance the gelling or blowing reaction. BASF’s Lupragen portfolio includes several low-VOC catalysts which offer support to address the increasing target of sustainable emission reductions.
With about 300 different amines, BASF has one of the world’s most diverse portfolio of chemical intermediates. Along with alkyl-, alkanol- and alkoxyalkylamines, BASF offers heterocyclic and aromatic as well as specialty amines. The versatile products are utilized mainly to manufacture process chemicals, pharmaceuticals and crop protection products, as well as cosmetic products and detergents. They also are used to produce coatings, special plastics, composites and special fibers.
Baxxodur® andLupragenTM are trademarks of BASF SE.
December 19, 2023
How companies are responding to attacks on ships in the Red Sea

Listen to this article
3 min
about:blank
New: You can now listen to articles. 
This audio is generated by an AI tool.
19 Dec 2023 08:35PM
WhatsApp Telegram Facebook Twitter Email LinkedIn
Attacks on vessels by Iranian-backed Houthi militants in Yemen have disrupted international commerce on the shortest shipping route between Europe and Asia.
The attacks, targeting a route that accounts for about 15 per cent of the world’s shipping traffic, have pushed several shipping companies to re-route their vessels.
Below are companies’ (in alphabetical order) responses to the disturbances:
BASF
The German chemical company does not see disruptions to raw material supply or product distribution, but it is closely monitoring the situation, a company spokesperson said.
BP
The oil major on Dec. 18 said it had temporarily paused all transits through the Red Sea.
COVESTRO
The German chemicals maker said any possible increases in transit times due to shipping lines avoiding the “Bab-el-Mandeb” passage would not impact its product supply. Covestro expects its ocean shipping line partners to continue shipping through the passage as soon as it can be operated safely.
DANONE
The French food group said most of its shipments had been diverted, which will increase transit times. Should the situation continue in the mid to long-term and last beyond 2-3 months, the group will activate mitigation plans, including using alternate routes via sea or road wherever possible, a Danone spokesperson said.
ELECTROLUX
The Swedish home appliances maker has set up a task force to reduce the impact of maritime attacks. The measures include identifying particularly time-sensitive deliveries and finding alternative routes if required, the company told Reuters.
EQUINOR
The Norwegian oil and gas firm on Dec. 18 said it had re-routed vessels that had been heading towards the Red Sea.
ESSITY
The Swedish hygiene products maker is monitoring the situation and staying in contact with impacted suppliers to ensure continued flow of goods, but sees a limited impact as only a low percentage of its supplies move through the Suez Canal, the company told Reuters.
MOSAIC
The U.S. fertilizer company said on Dec. 18 it had re-routed a couple of U.S.-bound shipments around the Cape of Good Hope rather than through the Red Sea.
TSMC,
TSMC, the world’s top contract chipmaker, said on Tuesday it had a long-established enterprise risk management system in place, and after an assessment it did not anticipate a significant impact on its operations.
(Compiled by Izabela Niemiec in Gdansk; editing by Milla Nissi and Ed Osmond)
https://www.channelnewsasia.com/business/how-companies-are-responding-attacks-ships-red-sea-3999041
December 18, 2023
Adnoc is said to prepare higher bid for Covestro
Dec. 18, 2023 1:38 PM ETCovestro AG (CVVTF) Stock, COVTY StockBy: Rob Williams NY, SA News Editor

- Abu Dhabi National Oil Co. is readying a higher bid for Covestro (OTCPK:CVVTF) (OTCPK:COVTY) and is prepared to offer concessions to begin detailed due diligence, Bloomberg News reported Monday, citing people with knowledge of the matter.
- State-owned Adnoc is prepared to offer €60 a share as soon as the coming days, the people said. That price would value Covestro (OTCPK:CVVTF) (OTCPK:COVTY) at about €11.3 billion ($12.3 billion). Adnoc also is willing to offer job guarantees for several years and $8 billion of investments after closing the deal, Bloomberg News reported, citing its sources.
- Talks between the two companies started in September after informal bids of €55 and €57 a share that Covestro (OTCPK:CVVTF) (OTCPK:COVTY) rejected as too low. Covestro’s (OTCPK:CVVTF) (OTCPK:COVTY) stock has risen about 45% this year to €53 a share, valuing the petrochemical company at €10 billion.
December 18, 2023
Truckload supply and demand on collision course in 2024
Data gives reason for optimism for economy and transportation market next year
Zach Strickland, FW Market Expert & Market Analyst
· Saturday, December 16, 2023

Listen to this article
4 min
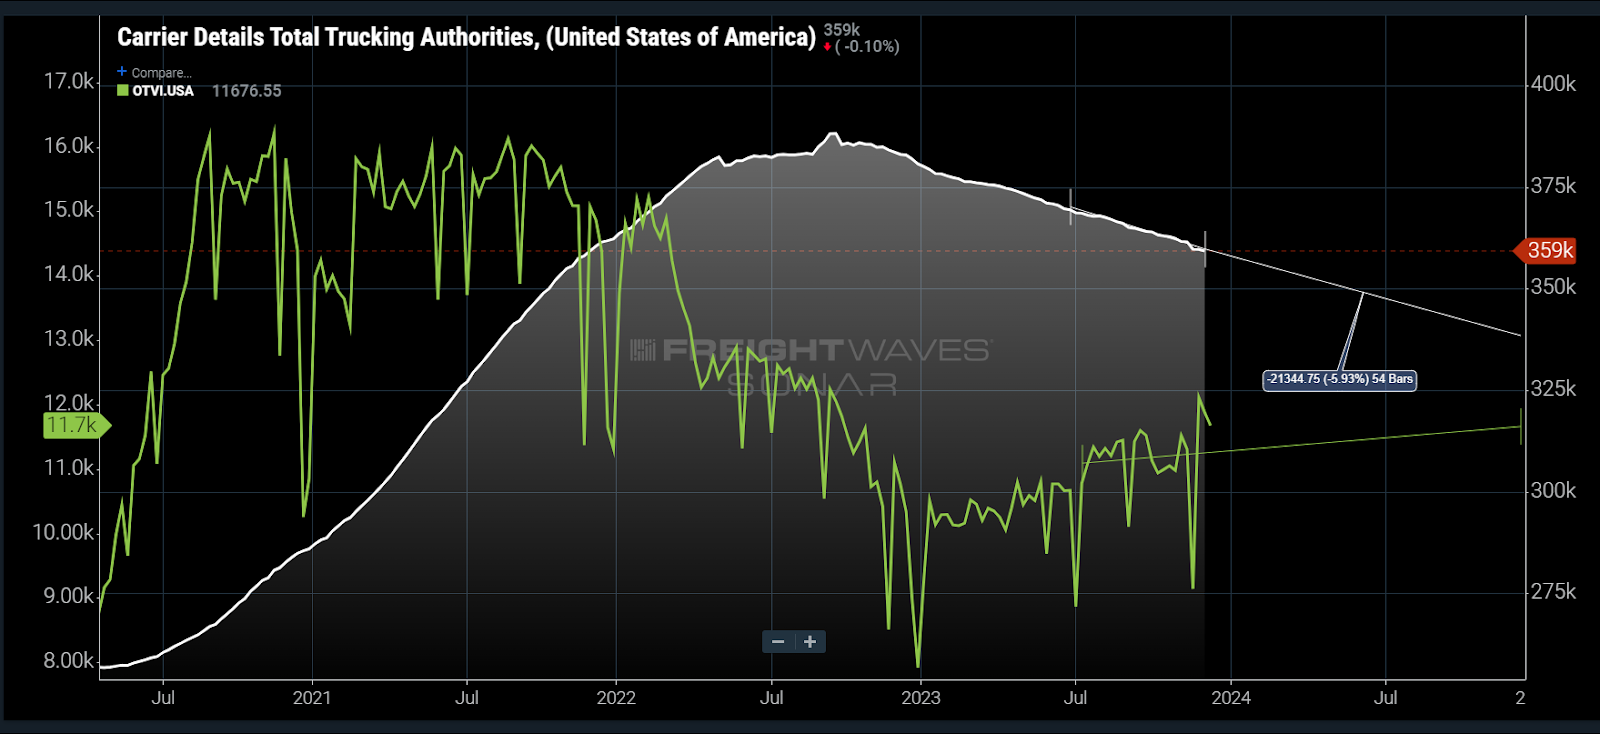
Chart of the Week: Carrier Details Total Trucking Authorities, Outbound Tender Volume Index – USA SONAR: CDTTA.USA, OTVI.USA
Trucking demand is up while capacity is down since this time last year. This statement by itself means that the transportation market is healthier, but it also suggests that 2024 should be better in aggregate as the gap between supply and demand narrows quickly.
Truckload demand is barely a shadow of what it was during the pandemic, but it has been growing throughout most of 2023. This fact has been invisible to most carriers and 3PLs, which continue to deal with a massive glut of oversupplied capacity thanks to a record number of entrants in 2020-21 according to Carrier Details Total Trucking Authorities data set.
Tender volumes are averaging over 10% higher year over year this December and have been growing steadily since last winter. Outside of October, daily tender volumes moved higher, suggesting that economic demand for goods has grown.
On this past week’s Freightonomics episode, Zac Rogers, an associate professor of supply chain management at Colorado State and co-author of the Logistics Managers’ Index (LMI), suggested that the demand growth was a product of both inventories having been rightsized versus this time last year and growth in consumption.
While he admits that there is some ongoing concern about consumer health, the numbers are what they are. Anthony Smith, FreightWaves’ chief economist, responded to his concerns with a resounding “never bet against the American consumer.”
Possibly the most shocking revelation was in the LMI outlook of transportation prices by respondents. The LMI is divided up into multiple measures of logistics activity such as transportation and warehousing prices and capacity. Values above 50 indicate expansion while values below 50 are contractionary.
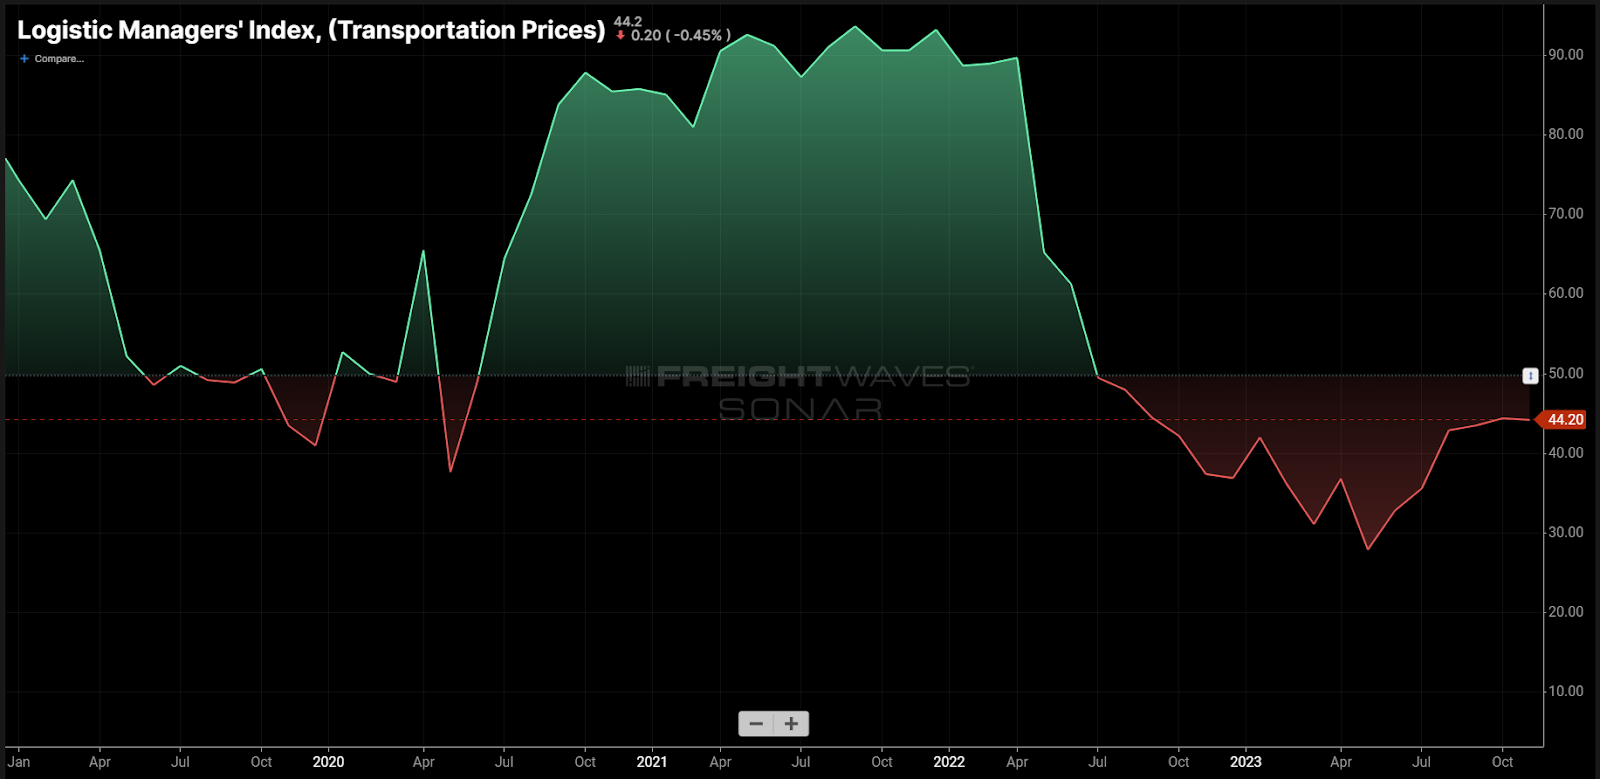
The transportation pricing component has averaged a value of 38 in 2023 and has been showing below 50 since the summer of 2022. Respondents to the November survey showed a reading of around 64 for prices in 2024, indicating that most expect rates to have bottomed.
While every forecast is an opinion on some level, the data does suggest that the supply of capacity and demand for its use is moving back toward equilibrium at a relatively fast clip.
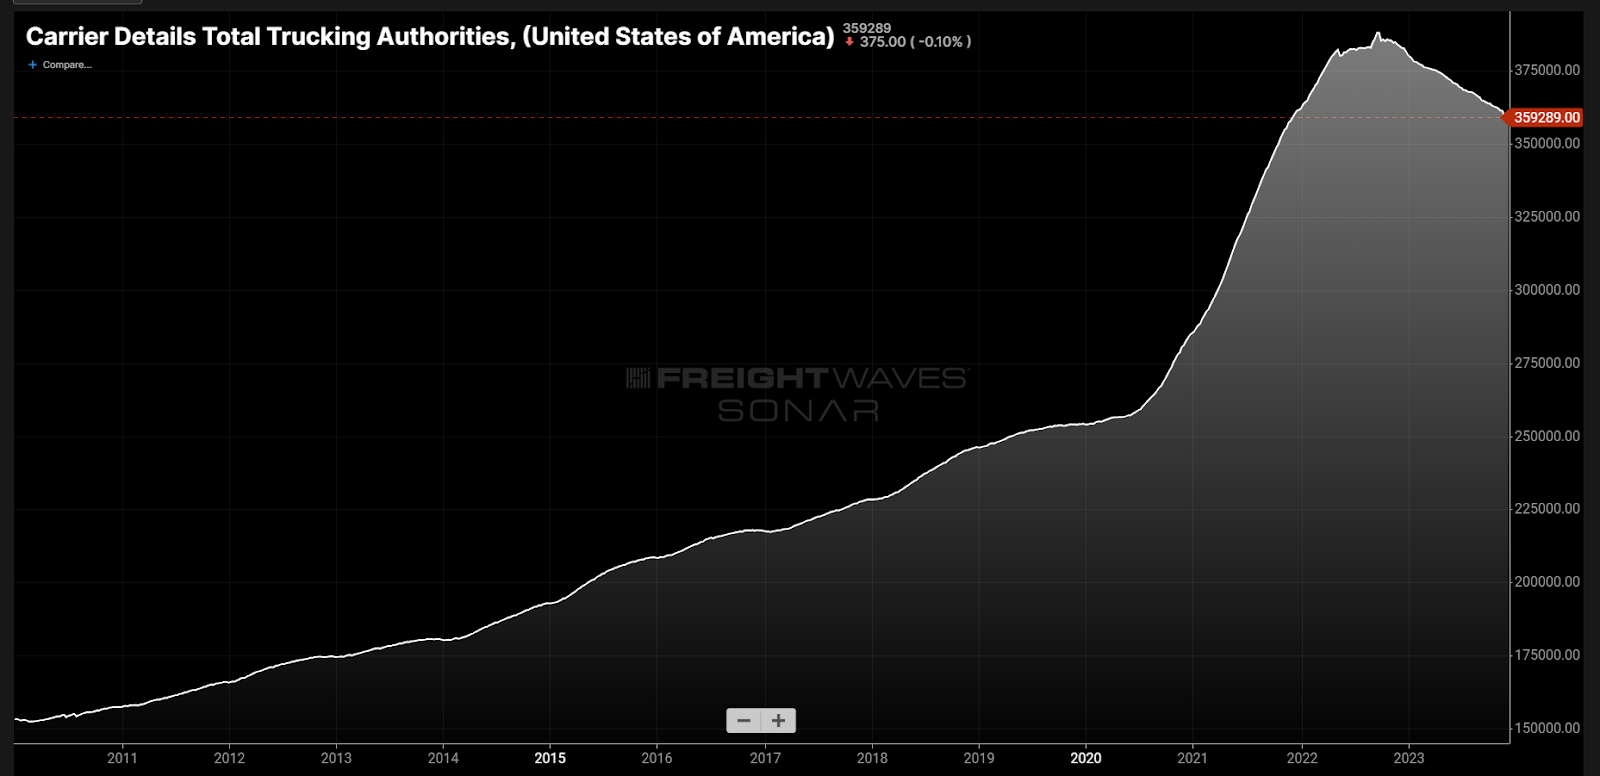
Looking at the past 13 years of Carrier Details Total Trucking Authorities data, there has never been such a strong downward trend. This of course is following the historic growth rate — the definition of an economic bubble.
FreightWaves CEO Craig Fuller stated in this past week’s State of Freight webinar that the risk is growing for shippers in 2024. Taking an overly aggressive approach to cost cutting would be much more risky than last year. No capacity is guaranteed. Even the strongest carriers feel this level of market downturn.
While Fuller admitted that he does not definitively know that the market will turn, there are several LMI respondents that feel similarly that there will be noticeable signs of tightening by the end of next year.
Economically speaking, there are still questions, but the answers are coming into focus with time. At the very least, the U.S. has economically overachieved versus many expectations, which does provide hope for the “soft landing” many have wanted.
Unfortunately, the solution to the freight market means that several first have to lose. This has been the case for many sectors post-pandemic. But this too is passing.
About the Chart of the Week
The FreightWaves Chart of the Week is a chart selection from SONAR that provides an interesting data point to describe the state of the freight markets. A chart is chosen from thousands of potential charts on SONAR to help participants visualize the freight market in real time. Each week a Market Expert will post a chart, along with commentary, live on the front page. After that, the Chart of the Week will be archived on FreightWaves.com for future reference.
SONAR aggregates data from hundreds of sources, presenting the data in charts and maps and providing commentary on what freight market experts want to know about the industry in real time.
The FreightWaves data science and product teams are releasing new datasets each week and enhancing the client experience.
December 18, 2023
Visualizing $97 Trillion Of Global Debt In 2023
by Tyler Durden
Monday, Dec 18, 2023 – 06:55 AM
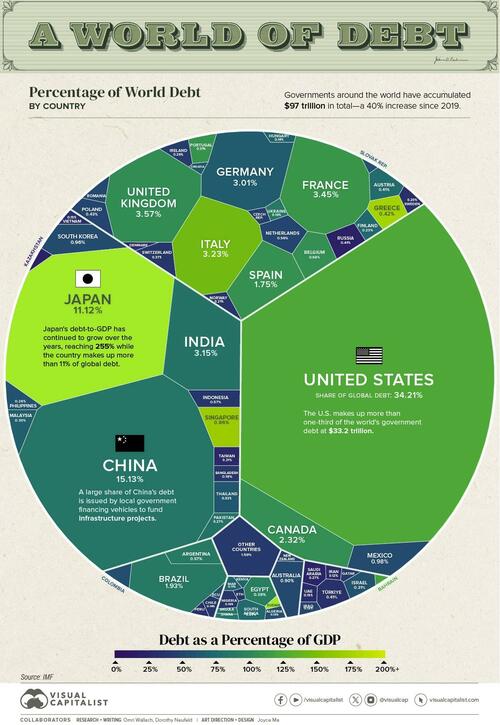
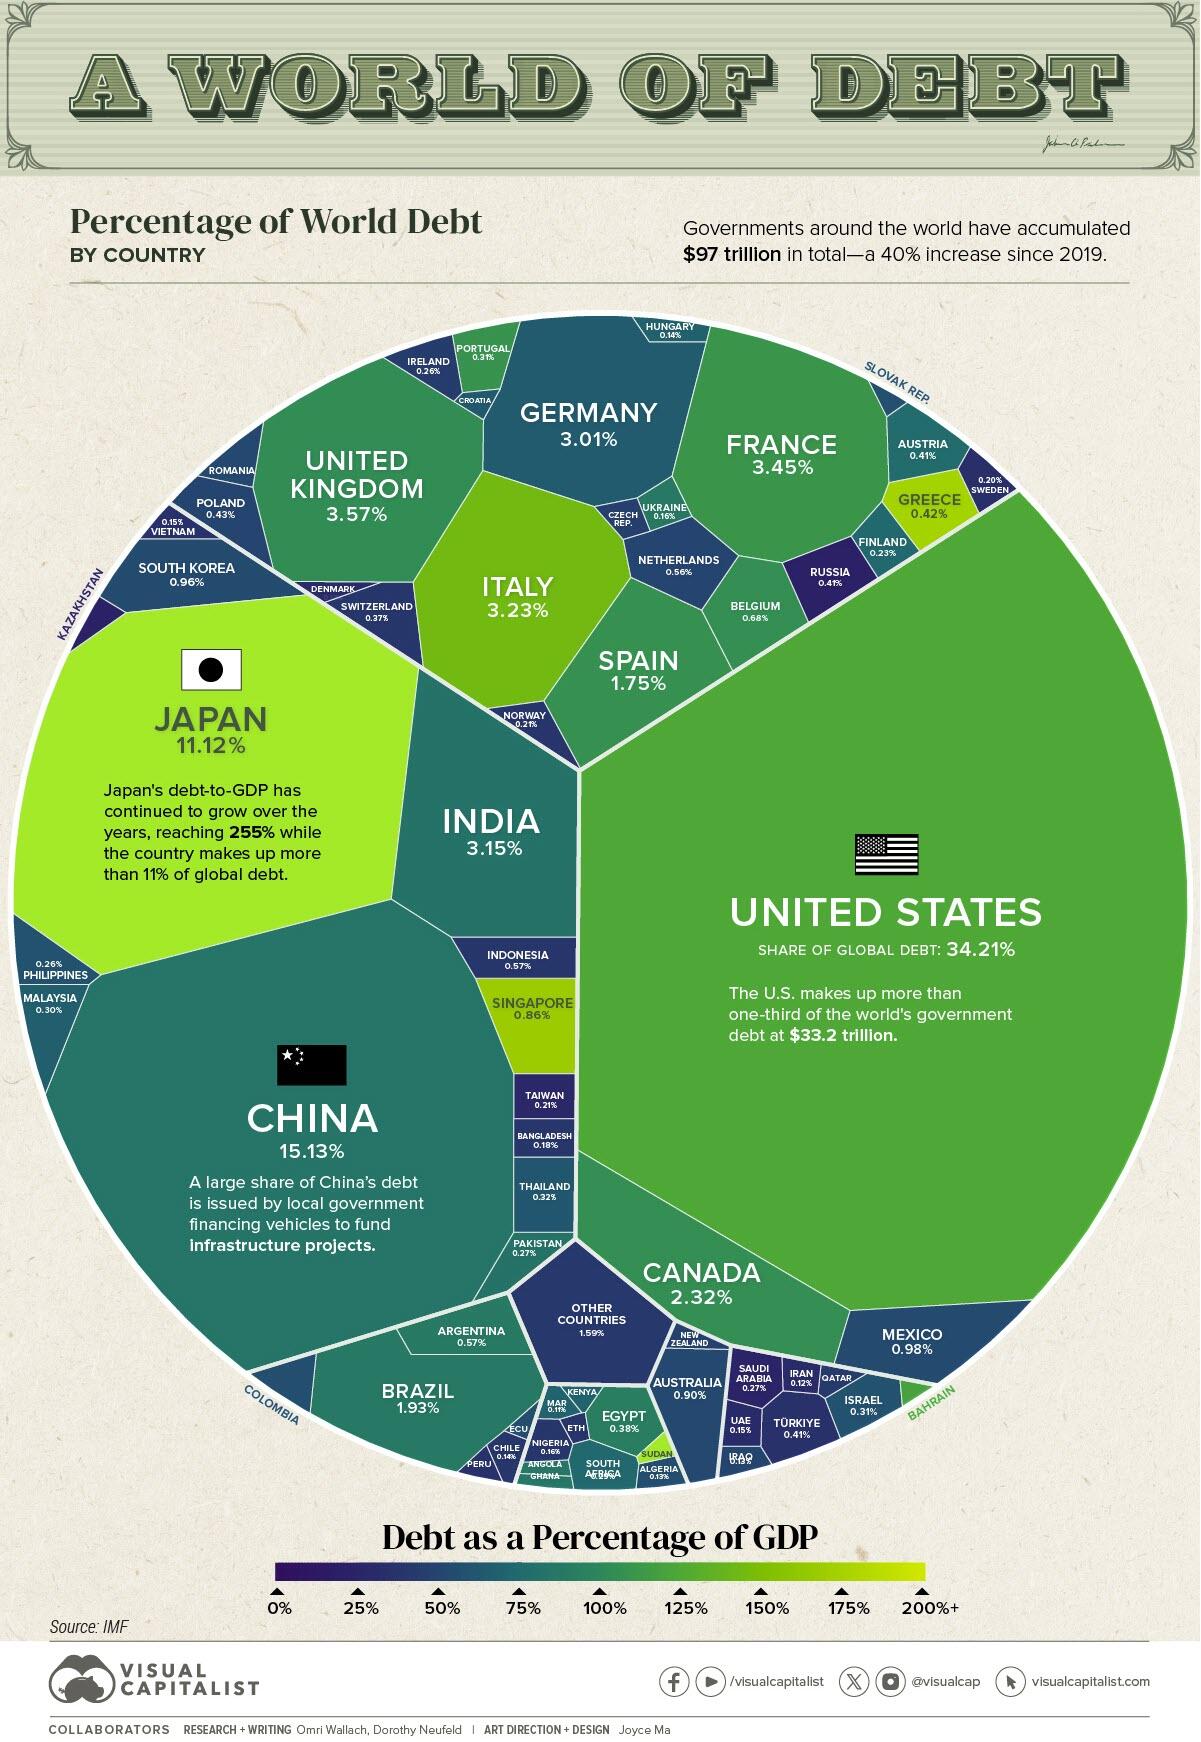
Global government debt is projected to hit $97.1 trillion this year, a 40% increase since 2019.
During the COVID-19 pandemic, governments introduced sweeping financial measures to support the job market and prevent a wave of bankruptcies. However, this has exposed vulnerabilities as higher interest rates are amplifying borrowing costs.
In the graphic below, Visual Capitalist’s Niccolo Conte and Dorothy Neufeld show global debt by country in 2023, based on projections from the International Monetary Fund (IMF).
Debt by Country in 2023
Below, we rank countries by their general government gross debt, or the financial liabilities owed by each country:
| Country | Gross Debt (B) | % of World Total | Debt to GDP |
|---|---|---|---|
| 🇺🇸 U.S. | $33,228.9 | 34.2% | 123.3% |
| 🇨🇳 China | $14,691.7 | 15.1% | 83.0% |
| 🇯🇵 Japan | $10,797.2 | 11.1% | 255.2% |
| 🇬🇧 UK | $3,468.7 | 3.6% | 104.1% |
| 🇫🇷 France | $3,353.9 | 3.5% | 110.0% |
| 🇮🇹 Italy | $3,141.4 | 3.2% | 143.7% |
| 🇮🇳 India | $3,056.7 | 3.1% | 81.9% |
| 🇩🇪 Germany | $2,919.3 | 3.0% | 65.9% |
| 🇨🇦 Canada | $2,253.3 | 2.3% | 106.4% |
| 🇧🇷 Brazil | $1,873.7 | 1.9% | 88.1% |
| 🇪🇸 Spain | $1,697.5 | 1.7% | 107.3% |
| 🇲🇽 Mexico | $954.6 | 1.0% | 52.7% |
| 🇰🇷 South Korea | $928.1 | 1.0% | 54.3% |
| 🇦🇺 Australia | $875.9 | 0.9% | 51.9% |
| 🇸🇬 Singapore | $835.0 | 0.9% | 167.9% |
| 🇧🇪 Belgium | $665.2 | 0.7% | 106.0% |
| 🇦🇷 Argentina | $556.5 | 0.6% | 89.5% |
| 🇮🇩 Indonesia | $552.8 | 0.6% | 39.0% |
| 🇳🇱 Netherlands | $540.9 | 0.6% | 49.5% |
| 🇵🇱 Poland | $419.4 | 0.4% | 49.8% |
| 🇬🇷 Greece | $407.2 | 0.4% | 168.0% |
| 🇹🇷 Türkiye | $397.2 | 0.4% | 34.4% |
| 🇷🇺 Russia | $394.8 | 0.4% | 21.2% |
| 🇦🇹 Austria | $393.6 | 0.4% | 74.8% |
| 🇪🇬 Egypt | $369.3 | 0.4% | 92.7% |
| 🇨🇭 Switzerland | $357.7 | 0.4% | 39.5% |
| 🇹🇭 Thailand | $314.5 | 0.3% | 61.4% |
| 🇮🇱 Israel | $303.6 | 0.3% | 58.2% |
| 🇵🇹 Portugal | $299.4 | 0.3% | 108.3% |
| 🇲🇾 Malaysia | $288.3 | 0.3% | 66.9% |
| 🇿🇦 South Africa | $280.7 | 0.3% | 73.7% |
| 🇵🇰 Pakistan | $260.9 | 0.3% | 76.6% |
| 🇸🇦 Saudi Arabia | $257.7 | 0.3% | 24.1% |
| 🇮🇪 Ireland | $251.7 | 0.3% | 42.7% |
| 🇵🇭 Philippines | $250.9 | 0.3% | 57.6% |
| 🇫🇮 Finland | $225.0 | 0.2% | 73.6% |
| 🇳🇴 Norway | $204.5 | 0.2% | 37.4% |
| 🇨🇴 Colombia | $200.1 | 0.2% | 55.0% |
| 🇹🇼 Taiwan | $200.0 | 0.2% | 26.6% |
| 🇸🇪 Sweden | $192.9 | 0.2% | 32.3% |
| 🇷🇴 Romania | $178.7 | 0.2% | 51.0% |
| 🇧🇩 Bangladesh | $175.9 | 0.2% | 39.4% |
| 🇺🇦 Ukraine | $152.8 | 0.2% | 88.1% |
| 🇨🇿 Czech Republic | $152.2 | 0.2% | 45.4% |
| 🇳🇬 Nigeria | $151.3 | 0.2% | 38.8% |
| 🇦🇪 UAE | $149.7 | 0.2% | 29.4% |
| 🇻🇳 Vietnam | $147.3 | 0.2% | 34.0% |
| 🇭🇺 Hungary | $140.0 | 0.1% | 68.7% |
| 🇨🇱 Chile | $132.2 | 0.1% | 38.4% |
| 🇩🇰 Denmark | $126.7 | 0.1% | 30.1% |
| 🇮🇶 Iraq | $125.5 | 0.1% | 49.2% |
| 🇩🇿 Algeria | $123.5 | 0.1% | 55.1% |
| 🇳🇿 New Zealand | $115.0 | 0.1% | 46.1% |
| 🇮🇷 Iran | $112.1 | 0.1% | 30.6% |
| 🇲🇦 Morocco | $102.7 | 0.1% | 69.7% |
| 🇶🇦 Qatar | $97.5 | 0.1% | 41.4% |
| 🇵🇪 Peru | $89.7 | 0.1% | 33.9% |
| 🇦🇴 Angola | $79.6 | 0.1% | 84.9% |
| 🇰🇪 Kenya | $79.1 | 0.1% | 70.2% |
| 🇸🇰 Slovakia | $75.4 | 0.1% | 56.7% |
| 🇩🇴 Dominican Republic | $72.1 | 0.1% | 59.8% |
| 🇪🇨 Ecuador | $65.9 | 0.1% | 55.5% |
| 🇸🇩 Sudan | $65.5 | 0.1% | 256.0% |
| 🇬🇭 Ghana | $65.1 | 0.1% | 84.9% |
| 🇰🇿 Kazakhstan | $60.7 | 0.1% | 23.4% |
| 🇪🇹 Ethiopia | $59.0 | 0.1% | 37.9% |
| 🇧🇭 Bahrain | $54.5 | 0.1% | 121.2% |
| 🇨🇷 Costa Rica | $53.9 | 0.1% | 63.0% |
| 🇭🇷 Croatia | $51.2 | 0.1% | 63.8% |
| 🇺🇾 Uruguay | $47.0 | 0.0% | 61.6% |
| 🇯🇴 Jordan | $46.9 | 0.0% | 93.8% |
| 🇸🇮 Slovenia | $46.8 | 0.0% | 68.5% |
| 🇨🇮 Côte d’Ivoire | $45.1 | 0.0% | 56.8% |
| 🇵🇦 Panama | $43.5 | 0.0% | 52.8% |
| 🇲🇲 Myanmar | $43.0 | 0.0% | 57.5% |
| 🇴🇲 Oman | $41.4 | 0.0% | 38.2% |
| 🇹🇳 Tunisia | $39.9 | 0.0% | 77.8% |
| 🇷🇸 Serbia | $38.5 | 0.0% | 51.3% |
| 🇧🇴 Bolivia | $37.8 | 0.0% | 80.8% |
| 🇹🇿 Tanzania | $35.8 | 0.0% | 42.6% |
| 🇺🇿 Uzbekistan | $31.7 | 0.0% | 35.1% |
| 🇿🇼 Zimbabwe | $30.9 | 0.0% | 95.4% |
| 🇧🇾 Belarus | $30.4 | 0.0% | 44.1% |
| 🇬🇹 Guatemala | $29.1 | 0.0% | 28.3% |
| 🇱🇹 Lithuania | $28.7 | 0.0% | 36.1% |
| 🇸🇻 El Salvador | $25.8 | 0.0% | 73.0% |
| 🇺🇬 Uganda | $25.3 | 0.0% | 48.3% |
| 🇸🇳 Senegal | $25.2 | 0.0% | 81.0% |
| 🇨🇾 Cyprus | $25.2 | 0.0% | 78.6% |
| 🇱🇺 Luxembourg | $24.6 | 0.0% | 27.6% |
| 🇭🇰 Hong Kong SAR | $23.5 | 0.0% | 6.1% |
| 🇧🇬 Bulgaria | $21.7 | 0.0% | 21.0% |
| 🇨🇲 Cameroon | $20.6 | 0.0% | 41.9% |
| 🇲🇿 Mozambique | $19.7 | 0.0% | 89.7% |
| 🇵🇷 Puerto Rico | $19.6 | 0.0% | 16.7% |
| 🇳🇵 Nepal | $19.3 | 0.0% | 46.7% |
| 🇱🇻 Latvia | $18.9 | 0.0% | 40.6% |
| 🇮🇸 Iceland | $18.7 | 0.0% | 61.2% |
| 🇵🇾 Paraguay | $18.1 | 0.0% | 40.9% |
| 🇱🇦 Lao P.D.R. | $17.3 | 0.0% | 121.7% |
| 🇭🇳 Honduras | $15.7 | 0.0% | 46.3% |
| 🇵🇬 Papua New Guinea | $15.7 | 0.0% | 49.5% |
| 🇹🇹 Trinidad and Tobago | $14.6 | 0.0% | 52.5% |
| 🇦🇱 Albania | $14.5 | 0.0% | 62.9% |
| 🇨🇬 Republic of Congo | $14.1 | 0.0% | 97.8% |
| 🇦🇿 Azerbaijan | $14.1 | 0.0% | 18.2% |
| 🇾🇪 Yemen | $14.0 | 0.0% | 66.4% |
| 🇯🇲 Jamaica | $13.6 | 0.0% | 72.3% |
| 🇲🇳 Mongolia | $13.1 | 0.0% | 69.9% |
| 🇧🇫 Burkina Faso | $12.7 | 0.0% | 61.2% |
| 🇬🇦 Gabon | $12.5 | 0.0% | 64.9% |
| 🇬🇪 Georgia | $11.9 | 0.0% | 39.6% |
| 🇲🇺 Mauritius | $11.8 | 0.0% | 79.7% |
| 🇦🇲 Armenia | $11.8 | 0.0% | 47.9% |
| 🇧🇸 Bahamas | $11.7 | 0.0% | 84.2% |
| 🇲🇱 Mali | $11.0 | 0.0% | 51.8% |
| 🇲🇹 Malta | $11.0 | 0.0% | 54.1% |
| 🇰🇭 Cambodia | $10.9 | 0.0% | 35.3% |
| 🇧🇯 Benin | $10.6 | 0.0% | 53.0% |
| 🇲🇼 Malawi | $10.4 | 0.0% | 78.6% |
| 🇪🇪 Estonia | $9.0 | 0.0% | 21.6% |
| 🇨🇩 Democratic Republic of Congo | $9.0 | 0.0% | 13.3% |
| 🇷🇼 Rwanda | $8.8 | 0.0% | 63.3% |
| 🇳🇦 Namibia | $8.5 | 0.0% | 67.6% |
| 🇲🇬 Madagascar | $8.5 | 0.0% | 54.0% |
| 🇳🇪 Niger | $8.3 | 0.0% | 48.7% |
| 🇲🇰 North Macedonia | $8.2 | 0.0% | 51.6% |
| 🇧🇦 Bosnia and Herzegovina | $7.7 | 0.0% | 28.6% |
| 🇲🇻 Maldives | $7.7 | 0.0% | 110.3% |
| 🇬🇳 Guinea | $7.3 | 0.0% | 31.6% |
| 🇳🇮 Nicaragua | $7.2 | 0.0% | 41.5% |
| 🇧🇧 Barbados | $7.2 | 0.0% | 115.0% |
| 🇹🇬 Togo | $6.1 | 0.0% | 67.2% |
| 🇰🇬 Kyrgyz Republic | $6.0 | 0.0% | 47.0% |
| 🇲🇩 Moldova | $5.6 | 0.0% | 35.1% |
| 🇹🇩 Chad | $5.4 | 0.0% | 43.2% |
| 🇰🇼 Kuwait | $5.4 | 0.0% | 3.4% |
| 🇲🇷 Mauritania | $5.1 | 0.0% | 49.5% |
| 🇭🇹 Haiti | $5.1 | 0.0% | 19.6% |
| 🇬🇾 Guyana | $4.9 | 0.0% | 29.9% |
| 🇲🇪 Montenegro | $4.6 | 0.0% | 65.8% |
| 🇫🇯 Fiji | $4.6 | 0.0% | 83.6% |
| 🇹🇲 Turkmenistan | $4.2 | 0.0% | 5.1% |
| 🇹🇯 Tajikistan | $4.0 | 0.0% | 33.5% |
| 🇧🇼 Botswana | $3.9 | 0.0% | 18.7% |
| 🇬🇶 Equatorial Guinea | $3.8 | 0.0% | 38.3% |
| 🇸🇷 Suriname | $3.8 | 0.0% | 107.0% |
| 🇸🇸 South Sudan | $3.8 | 0.0% | 60.4% |
| 🇧🇹 Bhutan | $3.3 | 0.0% | 123.4% |
| 🇦🇼 Aruba | $3.2 | 0.0% | 82.9% |
| 🇸🇱 Sierra Leone | $3.1 | 0.0% | 88.9% |
| 🇨🇻 Cabo Verde | $2.9 | 0.0% | 113.1% |
| 🇧🇮 Burundi | $2.3 | 0.0% | 72.7% |
| 🇱🇷 Liberia | $2.3 | 0.0% | 52.3% |
| 🇽🇰 Kosovo | $2.2 | 0.0% | 21.3% |
| 🇸🇿 Eswatini | $2.0 | 0.0% | 42.4% |
| 🇧🇿 Belize | $1.9 | 0.0% | 59.3% |
| 🇱🇨 Saint Lucia | $1.8 | 0.0% | 74.2% |
| 🇬🇲 Gambia | $1.7 | 0.0% | 72.3% |
| 🇩🇯 Djibouti | $1.6 | 0.0% | 41.8% |
| 🇦🇬 Antigua and Barbuda | $1.6 | 0.0% | 80.5% |
| 🇸🇲 San Marino | $1.5 | 0.0% | 74.0% |
| 🇬🇼 Guinea-Bissau | $1.5 | 0.0% | 73.9% |
| 🇱🇸 Lesotho | $1.5 | 0.0% | 61.3% |
| 🇦🇩 Andorra | $1.4 | 0.0% | 37.7% |
| 🇨🇫 Central African Republic | $1.4 | 0.0% | 50.1% |
| 🇸🇨 Seychelles | $1.3 | 0.0% | 60.8% |
| 🇻🇨 Saint Vincent and the Grenadines | $0.9 | 0.0% | 86.2% |
| 🇬🇩 Grenada | $0.8 | 0.0% | 60.2% |
| 🇩🇲 Dominica | $0.7 | 0.0% | 93.9% |
| 🇰🇳 Saint Kitts and Nevis | $0.6 | 0.0% | 53.2% |
| 🇻🇺 Vanuatu | $0.5 | 0.0% | 46.8% |
| 🇰🇲 Comoros | $0.5 | 0.0% | 33.3% |
| 🇸🇹 São Tomé and Príncipe | $0.4 | 0.0% | 58.5% |
| 🇸🇧 Solomon Islands | $0.4 | 0.0% | 22.2% |
| 🇧🇳 Brunei Darussalam | $0.3 | 0.0% | 2.3% |
| 🇼🇸 Samoa | $0.3 | 0.0% | 36.2% |
| 🇹🇱 Timor-Leste | $0.3 | 0.0% | 16.4% |
| 🇵🇼 Palau | $0.2 | 0.0% | 85.4% |
| 🇹🇴 Tonga | $0.2 | 0.0% | 41.1% |
| 🇫🇲 Micronesia | $0.1 | 0.0% | 12.5% |
| 🇲🇭 Marshall Islands | $0.1 | 0.0% | 18.1% |
| 🇳🇷 Nauru | <$0.1 | 0.0% | 29.1% |
| 🇰🇮 Kiribati | <$0.1 | 0.0% | 13.1% |
| 🇹🇻 Tuvalu | <$0.1 | 0.0% | 8.0% |
| 🇲🇴 Macao SAR | <$0.1 | 0.0% | 0.0% |
| 🌐 World | $97,129.8 | 100% | 93.0% |
With $33.2 trillion in government debt, the U.S. makes up over a third of the world total.
Given the increasing debt load, the cost of servicing this debt now accounts for 20% of government spending. It is projected to reach $1 trillion by 2028, surpassing the total spent on defense.
The world’s third-biggest economy, Japan, has one of the highest debt to GDP ratios, at 255%. Over the last two decades, its national debt has far exceeded 100% of its GDP, driven by an aging population and social security expenses.
In 2023, Egypt faces steep borrowing costs, with 40% of revenues going towards debt repayments. It has the highest debt on the continent.
Like Egypt, several emerging economies are facing strain. Lebanon has been in default since 2020, and Ghana defaulted on the majority of its external debt—debt owed to foreign lenders—in 2022 amid a deepening economic crisis.
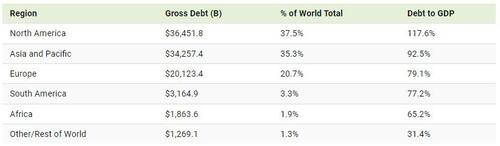
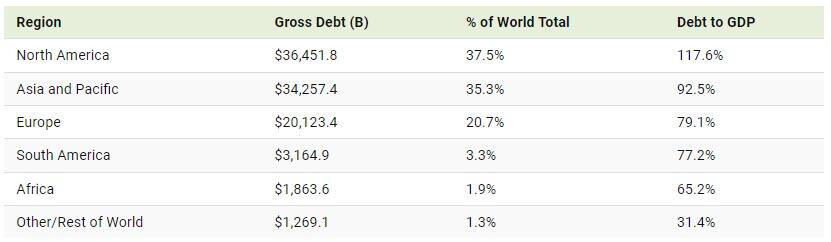
Global Debt: A Regional Perspective
How does debt compare on a regional level in 2023?
We can see that North America has both the highest debt and debt to GDP compared to other regions. Just as U.S. debt has ballooned, so has Canada’s—ranking as the 10th-highest globally in government debt outstanding.
Across Asia and the Pacific, debt levels hover close to North America.
At 3.3% of the global total, South America has $3.2 trillion in debt. As inflation has trended downwards, a handful of governments have already begun cutting interest rates. Overall, public debt levels are projected to stay elevated across the region.
Debt levels have also risen rapidly in Africa, with an average 40% of public debt held in foreign currencies—leaving it exposed to exchange rate fluctuations. Another challenge is that interest rates are also higher across the region compared to advanced economies, increasing debt-servicing costs.
By 2028, the IMF projects that global public debt will exceed 100% of GDP, hitting levels only seen during the pandemic.
https://www.zerohedge.com/markets/visualizing-97-trillion-global-debt-2023