The Urethane Blog
Everchem Updates
VOLUME XXI

September 14, 2023
Everchem’s exclusive Closers Only Club is reserved for only the highest caliber brass-baller salesmen in the chemical industry. Watch the hype video and be introduced to the top of the league: — read more
August 14, 2020
Close to 150 large companies went bust in Q2 2020
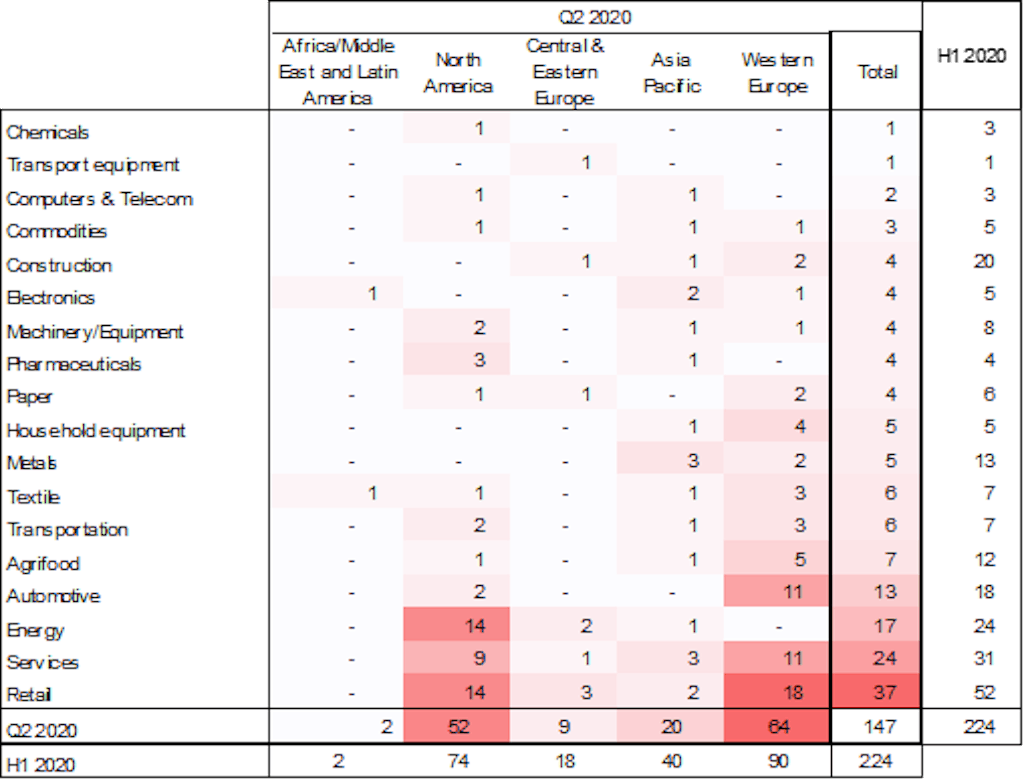
29 July 2020 In the second quarter of 2020, 147 large companies — with turnover above EUR50mn — went insolvent, representing an increase by +70 cases compared to Q1 2020 (+91% q/q) and +73 compared to Q2 of last year (+99% y/y). The cumulative turnover of insolvent major companies also surged to EUR106.9bn (+155% q/q and +138% y/y). All three sub-categories of companies we monitor by size of turnover posted a record level of major insolvencies : 22 cases in Q2 (+12 q/q) for those with a turnover exceeding EUR1bn; 77 (+46) for those with a turnover between EUR100mn and EUR1bn; and 48 (+12) for those with turnover between EUR50mn and EUR100mn. In this context, the average turnover of major companies becoming insolvent jumped to EUR727mn in Q2 2020 compared to EUR544mn in Q1 and EUR601mn in 2019.

Figure 1 – Number of major insolvencies* by quarter and size of turnover in EUR mn

(*) Companies with a turnover exceeding EUR50mn. Sources: Euler Hermes, Allianz Research
The largest surges were seen in Western Europe and the U.S. In Q2 2020, Western Europe posted the largest increase in major insolvencies to 64 (+38 cases q/q), ahead of North America, which recorded 52 cases (+30 q/q). Western Europe also remains the largest contributor to the global insolvency count for the first half of the year with 90 cases (+21 compared to H1 2019), again ahead of North America with 74 cases (+43). Asia experienced a stable number of major insolvencies in both Q1 and Q2 (20 cases), pushing down the outcome for H1 to 40 (-7 cases y/y). At the same time, North America posted a noticeable rise in insolvencies of companies with turnovers exceeding EUR1bn, with 17 cases in Q2, after 6 in Q1. The U.S. tops the list with 20 out of the 30 largest insolvencies registered in H1 2020, ahead of China (5) and Singapore (2).
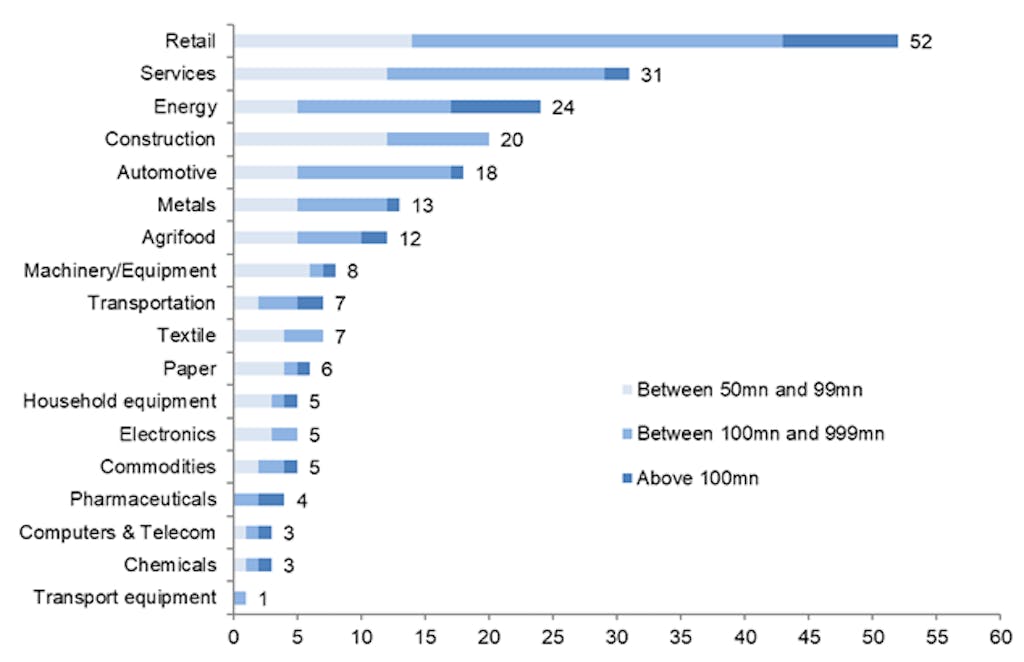
Retail, services and energy were the most impacted sectors, but automotive also stood out with a noticeable increase in major insolvencies. Retail and services posted 37 and 24 major insolvencies, respectively (i.e. +22 cases q/q) and +17 q/q), followed by energy with 17 cases (+10 q/q). While there was a pause in major insolvencies in the construction sector, they accelerated in the automotive sector, which recorded 13 cases in Q2 notably in the automotive suppliers, retailers and car rental sub-sectors. The list of more resilient sectors remains pretty unchanged from Q1 with in particular chemicals, computer/telecom and pharmaceuticals – on top of transport equipment. However, the average size (in terms of turnover) of their insolvent companies was two to three times larger than the average in H1 2020.
Where are the hotspots in Q2 2020? Retail and services in Western Europe and North America, energy in North America and automotive in Western Europe. In Q2 2020, the highest number of major insolvencies was recorded in retail in Western Europe (18), ahead of retail (14) and energy (14) in North America, and automotive (11) and services (11) in Western Europe. Looking at the first half of 2020 as a whole, the outcome is pretty similar in terms of ranking and relative frequency in major insolvencies. H1 2020 posted the highest number of major insolvencies in retail (52 cases) and services (31). For both sectors, these were mainly in North America and Western Europe. Yet, two other sectors stood out with more than 10 major insolvencies by region: energy in North America (18) and automotive in Western Europe (14). Construction comes right after in all regions but North America.
What does this mean for companies? As the Covid-19 pandemic creates an insolvency time bomb, we expect a stronger risk of domino effects, notably on fragile providers along supply chains.
For our full insolvency outlook, see our recent report : Calm before the storm: Covid-19 and the business insolvency time bomb.
Figure 2 – Number of major insolvencies* by sector and by region
(*) Companies with a turnover exceeding EUR50mn. Sources: Euler Hermes, Allianz Research
Figure 3 – Number of major insolvencies* in H1 2020 by sector and size of turnover in EUR mn
(*) Companies with a turnover exceeding EUR50mn. Sources: Euler Hermes, Allianz Research
August 14, 2020
Close to 150 large companies went bust in Q2 2020
29 July 2020 In the second quarter of 2020, 147 large companies — with turnover above EUR50mn — went insolvent, representing an increase by +70 cases compared to Q1 2020 (+91% q/q) and +73 compared to Q2 of last year (+99% y/y). The cumulative turnover of insolvent major companies also surged to EUR106.9bn (+155% q/q and +138% y/y). All three sub-categories of companies we monitor by size of turnover posted a record level of major insolvencies : 22 cases in Q2 (+12 q/q) for those with a turnover exceeding EUR1bn; 77 (+46) for those with a turnover between EUR100mn and EUR1bn; and 48 (+12) for those with turnover between EUR50mn and EUR100mn. In this context, the average turnover of major companies becoming insolvent jumped to EUR727mn in Q2 2020 compared to EUR544mn in Q1 and EUR601mn in 2019.
Figure 1 – Number of major insolvencies* by quarter and size of turnover in EUR mn
(*) Companies with a turnover exceeding EUR50mn. Sources: Euler Hermes, Allianz Research
The largest surges were seen in Western Europe and the U.S. In Q2 2020, Western Europe posted the largest increase in major insolvencies to 64 (+38 cases q/q), ahead of North America, which recorded 52 cases (+30 q/q). Western Europe also remains the largest contributor to the global insolvency count for the first half of the year with 90 cases (+21 compared to H1 2019), again ahead of North America with 74 cases (+43). Asia experienced a stable number of major insolvencies in both Q1 and Q2 (20 cases), pushing down the outcome for H1 to 40 (-7 cases y/y). At the same time, North America posted a noticeable rise in insolvencies of companies with turnovers exceeding EUR1bn, with 17 cases in Q2, after 6 in Q1. The U.S. tops the list with 20 out of the 30 largest insolvencies registered in H1 2020, ahead of China (5) and Singapore (2).
Retail, services and energy were the most impacted sectors, but automotive also stood out with a noticeable increase in major insolvencies. Retail and services posted 37 and 24 major insolvencies, respectively (i.e. +22 cases q/q) and +17 q/q), followed by energy with 17 cases (+10 q/q). While there was a pause in major insolvencies in the construction sector, they accelerated in the automotive sector, which recorded 13 cases in Q2 notably in the automotive suppliers, retailers and car rental sub-sectors. The list of more resilient sectors remains pretty unchanged from Q1 with in particular chemicals, computer/telecom and pharmaceuticals – on top of transport equipment. However, the average size (in terms of turnover) of their insolvent companies was two to three times larger than the average in H1 2020.
Where are the hotspots in Q2 2020? Retail and services in Western Europe and North America, energy in North America and automotive in Western Europe. In Q2 2020, the highest number of major insolvencies was recorded in retail in Western Europe (18), ahead of retail (14) and energy (14) in North America, and automotive (11) and services (11) in Western Europe. Looking at the first half of 2020 as a whole, the outcome is pretty similar in terms of ranking and relative frequency in major insolvencies. H1 2020 posted the highest number of major insolvencies in retail (52 cases) and services (31). For both sectors, these were mainly in North America and Western Europe. Yet, two other sectors stood out with more than 10 major insolvencies by region: energy in North America (18) and automotive in Western Europe (14). Construction comes right after in all regions but North America.
What does this mean for companies? As the Covid-19 pandemic creates an insolvency time bomb, we expect a stronger risk of domino effects, notably on fragile providers along supply chains.
For our full insolvency outlook, see our recent report : Calm before the storm: Covid-19 and the business insolvency time bomb.
Figure 2 – Number of major insolvencies* by sector and by region
(*) Companies with a turnover exceeding EUR50mn. Sources: Euler Hermes, Allianz Research
Figure 3 – Number of major insolvencies* in H1 2020 by sector and size of turnover in EUR mn
(*) Companies with a turnover exceeding EUR50mn. Sources: Euler Hermes, Allianz Research
August 14, 2020
August 14, 2020
Dear Valued Customer,
Effective September 1, 2020 or as contracts allow, BASF Corporation is raising the price for all Lupranate MDI products by $ 0.12 per pound.
Your BASF Account Manager will provide details of this announced increase and is available to answer any questions you may have. We appreciate your continued support of BASF Urethane Chemicals.
August 14, 2020
August 14, 2020
Dear Valued Customer,
Effective September 1, 2020 or as contracts allow, BASF Corporation is raising the price for all Lupranate MDI products by $ 0.12 per pound.
Your BASF Account Manager will provide details of this announced increase and is available to answer any questions you may have. We appreciate your continued support of BASF Urethane Chemicals.
August 13, 2020
Current year-to-date ( YTD ) data is through June 2020.
Imports: Mattresses and other bedding products
Mattresses and other bedding products, the No. 111 import by value totaled $322.55 million for the month of June, $1.84 billion through June of 2020, and $4.29 billion for all of 2019, the latest annual data available, according to U.S. Census Bureau data analyzed by WorldCity. Need more details? Read more
Top Sources
| Rank | Country | YTD |
|---|---|---|
| 1 | China | $850.84 M |
| 2 | Indonesia | $191.79 M |
| 3 | Vietnam | $184.49 M |
| 4 | India | $105.1 M |
| 5 | Mexico | $92.07 M |
| 6 | Malaysia | $82.29 M |
| 7 | Turkey | $60.44 M |
| 8 | Thailand | $51.49 M |
| 9 | Cambodia | $38.47 M |
| 10 | Serbia | $38.32 M |
Top Gateways
| Rank | Port | YTD |
|---|---|---|
| 1 | Port of Los Angeles | $481.32 M |
| 2 | Port of Newark | $212.4 M |
| 3 | Port of Savannah, Ga. | $204.42 M |
| 4 | Port of Long Beach | $165.78 M |
| 5 | Port of Virginia | $108.47 M |
| 6 | Port of Oakland, Calif. | $107.83 M |
| 7 | Port of Charleston | $99.56 M |
| 8 | Port of Tacoma, Wash. | $74.07 M |
| 9 | Port of Houston | $53.06 M |
| 10 | Port of Seattle, Wash. | $51.48 M |
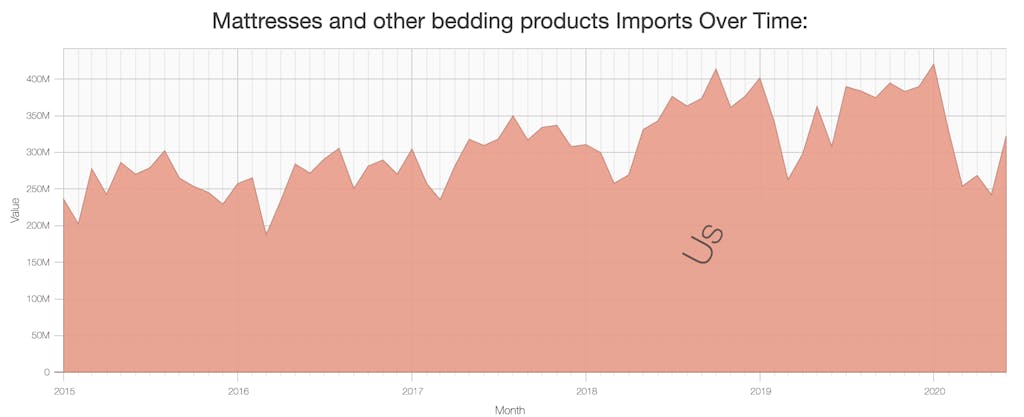
U.S. imports of Mattresses and other bedding products decreased 6.90 percent through June to $1.84 billion
U.S. imports of Mattresses and other bedding products decreased 6.90 percent from $1.97 billion to $1.84 billion through the first six months of 2020 when compared to the same period the previous year, according to WorldCity analysis of the latest U.S. Census Bureau data.
The category ranked 111 through June among the roughly 1,265 import commodity groupings as classified by Census. It ranked No. 114 for the last full year with a total value of $4.29 billion, a $212.11 million, 5.20 percent increase from the 2018 total.
Through June of this year the leading sources were No. 1 China, No. 2 Indonesia, No. 3 Vietnam, No. 4 India and No. 5 Mexico. The leading gateways were No. 1 Port of Los Angeles, No. 2 Port of Newark, No. 3 Port of Savannah, Ga., No. 4 Port of Long Beach and No. 5 Port of Virginia.
In the last previous full year, the leading sources were No. 1 China, No. 2 Mexico, No. 3 India, No. 4 Vietnam and No. 5 Canada. The leading gateways were No. 1 Port of Los Angeles, No. 2 Port of Newark, No. 3 Port of Savannah, Ga., No. 4 Port of Long Beach and No. 5 Port of Oakland, Calif..
Looking at specific airports, seaports and border crossings, the top five through through the first six months of the year were:
Highlights for the top five ports:
- Port of Los Angeles fell 22.15 percent compared to last year to $481.32 million.
- Port of Newark fell 4.55 percent compared to last year to $212.4 million.
- Port of Savannah, Ga. rose 19.52 percent compared to last year to $204.42 million.
- Port of Long Beach rose 35.69 percent compared to last year to $165.78 million.
- Port of Virginia rose 1.92 percent compared to last year to $108.47 million.
There are several hundred airports, seaports and border crossings that handle international trade; they are, in turn, part of the roughly four dozen U.S. Customs districts.
Highlights for the top five foreign markets:
- U.S. imports from No. 1 China decreased $600.28 million, 41.37 percent, (46.3 percent market share).
- U.S. imports from No. 2 Indonesia increased $166.25 million, 650.94 percent, (10.44 percent market share).
- U.S. imports from No. 3 Vietnam increased $125.57 million, 213.14 percent, (10.04 percent market share).
- U.S. imports from No. 4 India decreased $13.57 million, 11.43 percent, (5.72 percent market share).
- U.S. imports from No. 5 Mexico decreased $46.6 million, 33.61 percent, (5.01 percent market share).
All totaled, 77.5 percent of all these Mattresses and other bedding products imports to the United States were shipped from the top five markets through June of this year. That is equal to $1.42 billion of the $1.84 billion total.
All totaled, 63.79 percent of all these Mattresses and other bedding products imports to the United States were shipped to the top five Ports through June of this year. That is equal to $1.17 billion of the $1.84 billion total