The Urethane Blog

FoamPartner: Ether-based PU foams with low emission levels

Foam Expo Europe 2019


FoamPartner Hall 10 Stand 504

The Swiss company FoamPartner Fritz Nauer AG has developed a foam product family, which is characterised by very low emission levels for use in automotive headliners with high demands on processability and design. The new ether-based foam technology is said to combine high surface quality with lowest volatile organic compounds (VOC) and fogging (FOG) values. The company will present the new products at Foam Expo Europe 2019 from 10 – 12 September 2019 in Stuttgart, Germany.

Thanks to their homogenous and fine-pore cell structure, OBoSky foams deliver uniform surfaces, ideal in particular for high-quality automotive headliners (Source: Getty Images/algre)

Thanks to their homogenous and fine-pore cell structure, OBoSky foams deliver uniform surfaces, ideal in particular for high-quality automotive headliners (Source: Getty Images/algre)

According to the manufacturer, the foams sold under the OBoSky brand name benefit from a patented ether prepolymer technology to combine the advantages of ester-based polyurethane foams with those of ether-based materials. The result is a family of hydrolytically stable, low-emission and low-odour foams with good processability and a very homogenous cell structure. The technology is especially targeted to demanding automotive headliners. However, thanks to their high elongation and good resilience, the foams also have an ideal fit in further automotive interior applications requiring a pleasant soft feel, said the company.

“Vehicles off the shelf are history. Besides looking for an environmentally friendly as possible drive system, consumers today have a keen eye for a stylish interior design using materials that ensure a healthy climate in the passenger compartment,” said Klaus Hellmold, Vice President Global Business Unit Automotive Rolls at FoamPartner. “With our OBoSky foams for headliners, we have set new standards in efficient processing and environmental compatibility.”

In tests according to VDA 278 and VDA 270, the new PU foams stay clearly below the VOC and FOG levels specified by Daimler’s DBL 5450 soft foam standard (Source: FoamPartner)

In tests according to VDA 278 and VDA 270, the new PU foams stay clearly below the VOC and FOG levels specified by Daimler’s DBL 5450 soft foam standard (Source: FoamPartner)

The headliner foam grades are said to feature a very uniform structure with fine pores, providing surfaces that can easily be laminated in flame and adhesion processes while also lending themselves to finishing textiles of low surface weight. The ether-based prepolymer technology of the materials is said to ensure very good hydrolytic resistance and long-term high mechanical properties as well as to lead to significantly lower levels in VOC and FOG vs. merely ester-based foams. In VOC and FOG tests according to VDA 278 and VDA 270, OBoSky is said to show values clearly below the limits specified in DBL 5450, the supply regulation of Daimler AG for flexible foams based on polyurethane.

The products are available in rolls and various net densities as well as with or without flame protecting finish according to FMVSS 302. The manufacturing process enables a block foam length of 120 m, which results in 50 % fewer bonding seams compared to common 60 m blocks in the market. This means customers can save costs in their end-product fabrication, said the company.

www.foampartner.com

https://www.gupta-verlag.com/news/technology/23180/foampartner-ether-based-pu-foams-with-low-emission-levels


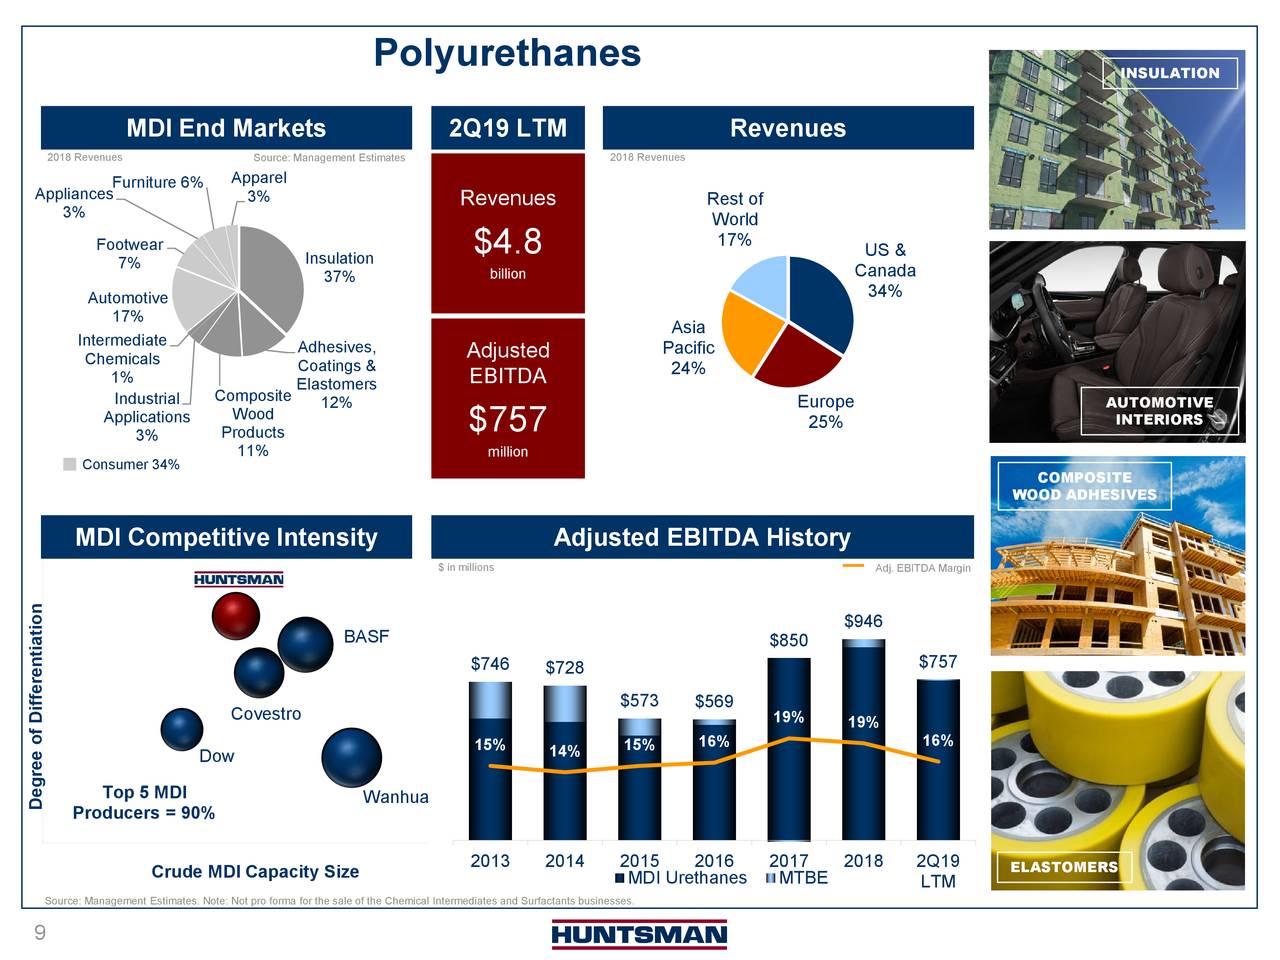
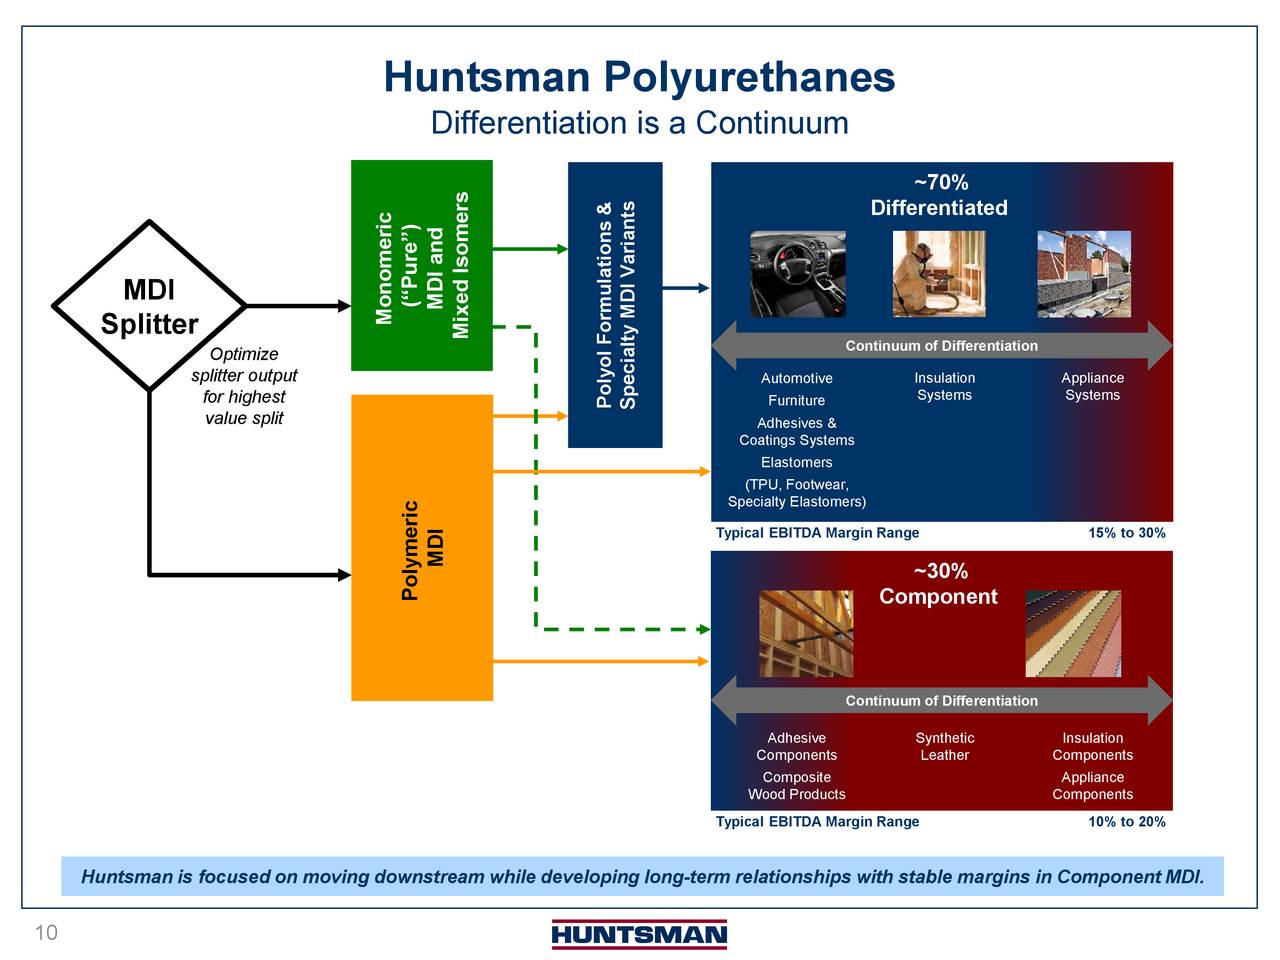
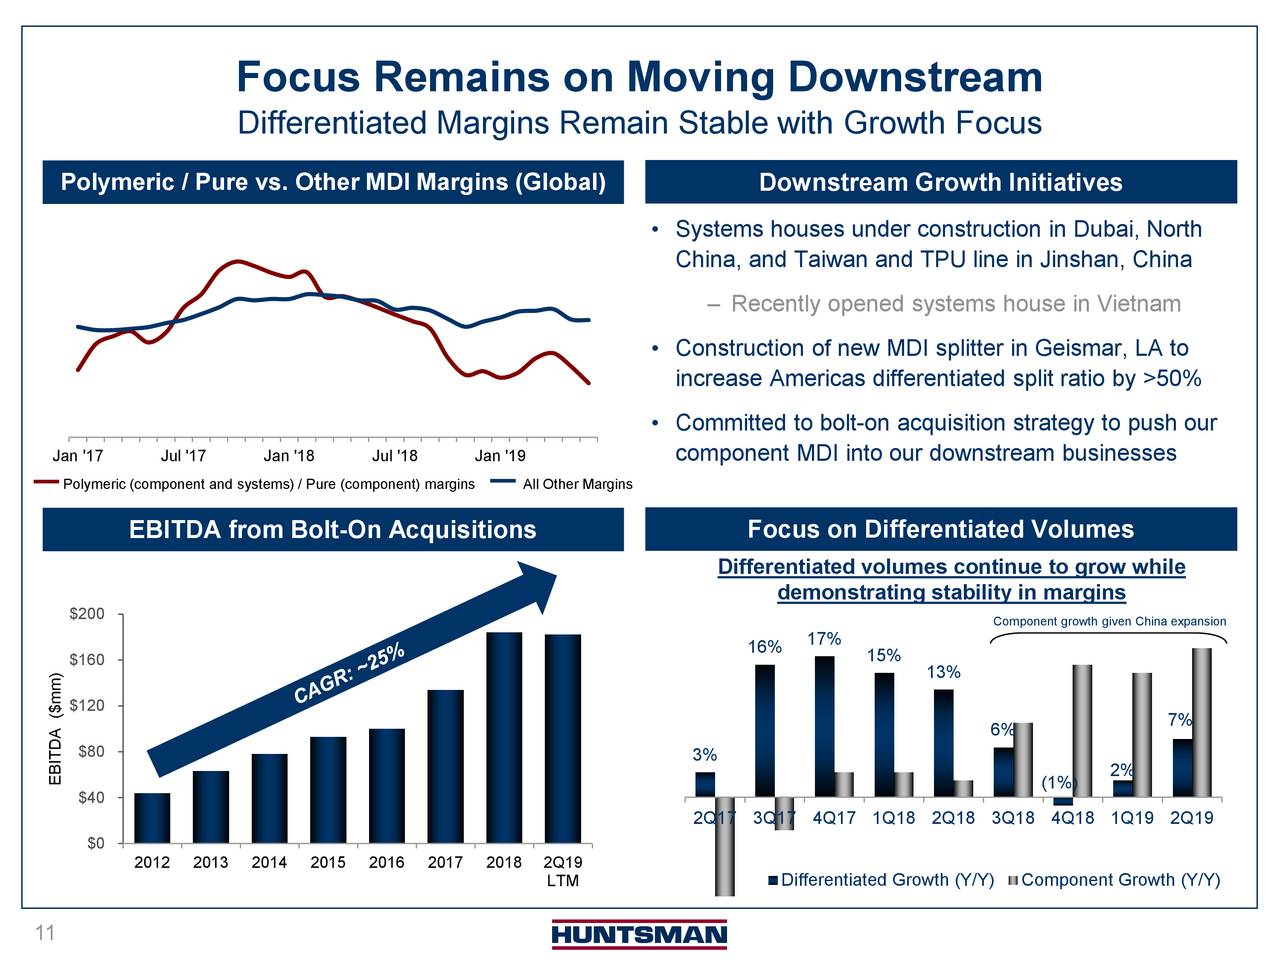
https://seekingalpha.com/article/4289846-huntsman-corporation-hun-presents-ubs-global-chemicals-conference-slideshow


https://seekingalpha.com/article/4289846-huntsman-corporation-hun-presents-ubs-global-chemicals-conference-slideshow


September 4, 2019

U.S. LNG Exports Boom

U.S. LNG grabs 10% market share as Jan-Aug exports equal 2018 volumes

U.S. exports of liquefied natural gas (LNG), negligible just three years ago, now amount to 10% of the global market and at 22 million tonnes so far this year are equal to the total volumes pumped out in 2018, Refinitiv data showed.

The data, comprised of tracked individual journeys made by LNG tankers from supply source to destination, also showed LNG production hit an all-time high last month of 31 million tonnes.

As global volumes grow, Qatar, for years the world’s largest LNG supplier, lost market share to Australia, which exported more LNG than any other country in the past two months.

The supply surge has been long in the making as liquefaction and export facilities on the U.S. Gulf Coast come onstream after years of development, boosted also by a new mega-terminal in Russia’s Arctic and facilities in Australia.

The batting order for the world’s largest exporters has been Australia, Qatar, the United States, Russia and Malaysia for the past two months, whereas in previous years Nigeria and Indonesia vied for places in the top five.

Soaring supplies from U.S. LNG terminals have upended the global market not just by boosting volumes – and depressing prices – but also through flexible destination contracts with long-term buyers. Such deals allow countries’ cargoes to ebb and flow as prices and demand dictate.

This is reflected in the data, which shows the influx of U.S. LNG to northwest Europe receded from a March peak while flows to Latin America picked up in periods of low hydropower.

Japanese and South Korean buyers, many of which supported U.S. projects at inception by committing to buy volumes, remained a strong albeit falling component of total sales.

But purchases by China stuttered to a halt in February as tariffs imposed on U.S. LNG by Beijing weighed on already poor pricing conditions for Asian buyers.

The U.S. supply surge has depressed global LNG prices, and with it, European benchmark gas prices, closing the arbitrage for cargoes between the Atlantic and Pacific basins. In addition, demand growth in Asia this year has been weak in the absence of extreme weather and in comparison to a strong 2018.

The LNG industry is set to continue its rapid development, taking advantage of the soaring energy needs of a richer developing world as well as demand for gas boosted by the fuel’s relatively clean environmental credentials.

In the United States, export plants with a capacity of 46 million tonnes per year (mtpa) are in operation or ramping up, with another 27 mtpa approved, financed and being built.

At such numbers, U.S. production will rival Qatar’s, although Doha plans to expand its own facilities to 110 mtpa.

New mega-projects with capacities of 10 mtpa or more and the expansion of existing facilities are planned in Mozambique, Nigeria, Arctic Russia, Canada’s West Coast, Mexico and Papua New Guinea.
Source: Reuters (Reporting by Sabina Zawadzki; Editing by Dale Hudson)

U.S. LNG grabs 10% market share as Jan-Aug exports equal 2018 volumes