
The Urethane Blog
July 24, 2019
US new home sales rise 7% in June after 2 months of decline

WASHINGTON (AP) – U.S. new home sales rose at a modest pace in June but remained below sales levels earlier this year, suggesting low mortgage rates and a healthy job market aren’t encouraging many more purchases.
The Commerce Department said Wednesday that new home sales increased 7% to a seasonally adjusted annual rate of 646,000. That is up from 604,000 in May but below April’s figure of 658,000.
Through the first half of the year, purchases of new homes have increased just 2.2% compared with the same period last year.
The small increase, along with a drop in existing home sales in June, suggests the housing market is still struggling to accelerate after slowing sharply last year. Rising prices for existing homes are outpacing wage growth and leaving many would-be buyers on the sidelines.
Sales of new homes soared more than 50% in the West, partially recovering after a sharp drop in May. They plunged 26.3% in the Midwest, where they have fallen nearly 18% compared with a year ago. Sales slipped 4.2% in the Northeast in June and barely ticked up by 0.3% in the South.
Prices for new homes have been more restrained than for existing ones. The median price for a new home was $310,400 in June, little changed from a year earlier. Median existing home prices rose 4.3% in June from a year ago, faster than the growth in average hourly pay.
https://www.wfmz.com/news/ap-business/us-new-home-sales-rise-7-in-june-after-2-months-of-decline/1099288440
July 24, 2019
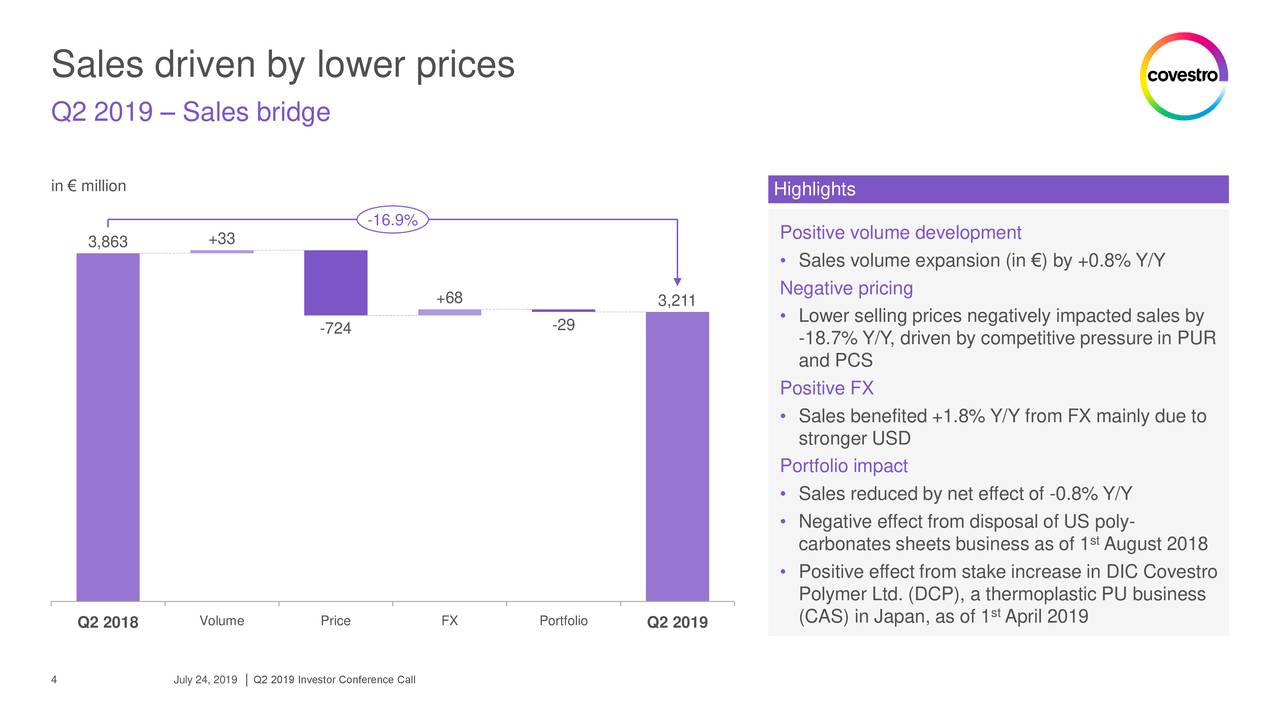
https://seekingalpha.com/article/4276974-covestro-ag-2019-q2-results-earnings-call-slides
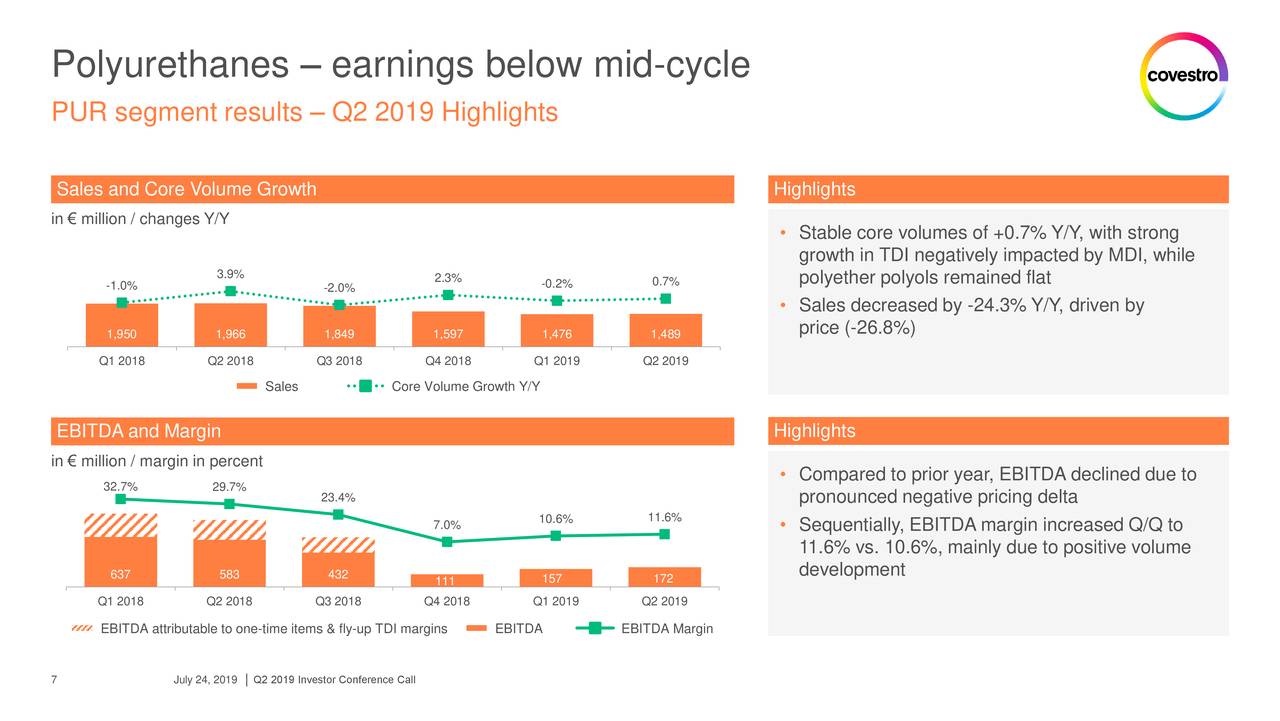
July 24, 2019
https://seekingalpha.com/article/4276974-covestro-ag-2019-q2-results-earnings-call-slides
July 24, 2019
ATA Truck Tonnage Index Fell 1.1% in June
Index 1.5% Higher than June 2018
Arlington, Va. — American Trucking Associations’ advanced seasonally adjusted (SA) For-Hire Truck Tonnage Index decreased 1.1% in June after falling 4% in May. In June, the index equaled 115.2 (2015=100) compared with 116.5 in May.
“Tonnage continues to show resilience as it posted the twenty-sixth year-over-year increase despite falling for the second straight month sequentially,” said ATA Chief Economist Bob Costello. “The year-over-year gain was the smallest over the past two years, but the level of freight remains quite high. Tonnage is outperforming other trucking metrics as heavy freight sectors, like tank truck, are witnessing better freight levels than sectors like dry van, which has a lower average weight per load.”
May’s reading was revised up compared with our June press release.
Compared with June 2018, the SA index increased 1.5%, the smallest year-over-year gain since April 2017.
The not seasonally adjusted index, which represents the change in tonnage actually hauled by the fleets before any seasonal adjustment, equaled 117.6 in June, 3.3% below May level (121.7). In calculating the index, 100 represents 2015.
Trucking serves as a barometer of the U.S. economy, representing 70.2% of tonnage carried by all modes of domestic freight transportation, including manufactured and retail goods. Trucks hauled 10.77 billion tons of freight in 2017. Motor carriers collected $700.1 billion, or 79.3% of total revenue earned by all transport modes.
ATA calculates the tonnage index based on surveys from its membership and has been doing so since the 1970s. This is a preliminary figure and subject to change in the final report issued around the 5th day of each month. The report includes month-to-month and year-over-year results, relevant economic comparisons, and key financial indicators.

https://www.trucking.org/article/ATA-Truck-Tonnage-Index-Fell-1.1-Percent-in-June
July 24, 2019
ATA Truck Tonnage Index Fell 1.1% in June
Index 1.5% Higher than June 2018
Arlington, Va. — American Trucking Associations’ advanced seasonally adjusted (SA) For-Hire Truck Tonnage Index decreased 1.1% in June after falling 4% in May. In June, the index equaled 115.2 (2015=100) compared with 116.5 in May.
“Tonnage continues to show resilience as it posted the twenty-sixth year-over-year increase despite falling for the second straight month sequentially,” said ATA Chief Economist Bob Costello. “The year-over-year gain was the smallest over the past two years, but the level of freight remains quite high. Tonnage is outperforming other trucking metrics as heavy freight sectors, like tank truck, are witnessing better freight levels than sectors like dry van, which has a lower average weight per load.”
May’s reading was revised up compared with our June press release.
Compared with June 2018, the SA index increased 1.5%, the smallest year-over-year gain since April 2017.
The not seasonally adjusted index, which represents the change in tonnage actually hauled by the fleets before any seasonal adjustment, equaled 117.6 in June, 3.3% below May level (121.7). In calculating the index, 100 represents 2015.
Trucking serves as a barometer of the U.S. economy, representing 70.2% of tonnage carried by all modes of domestic freight transportation, including manufactured and retail goods. Trucks hauled 10.77 billion tons of freight in 2017. Motor carriers collected $700.1 billion, or 79.3% of total revenue earned by all transport modes.
ATA calculates the tonnage index based on surveys from its membership and has been doing so since the 1970s. This is a preliminary figure and subject to change in the final report issued around the 5th day of each month. The report includes month-to-month and year-over-year results, relevant economic comparisons, and key financial indicators.
https://www.trucking.org/article/ATA-Truck-Tonnage-Index-Fell-1.1-Percent-in-June
 Everchem Updates Archive
 Sign Up for Email Updates