Current Affairs
September 7, 2022
European Update
How will the European energy crisis affect freight markets?
A slowing eurozone may pull ocean container rates down further
John Paul HampsteadWednesday, September 7, 2022 4 minutes read

Listen to this article 0:00 / 5:35 BeyondWords
Volatility in European power markets stemming from EU and U.K. sanctions against Russian energy — imposed in retaliation for Russia’s invasion of Ukraine in February — may soon cool off, but only after carving a slice out of the continent’s economy.
On Monday, U.K. Prime Minister Liz Truss announced plans to cap household energy bills at the equivalent of $2,300 annually. Meanwhile, German Chancellor Olaf Scholz unveiled a 65 billion euro relief package to ease the pain of energy prices that have quadrupled in his country.
These crisis measures are meant to reduce the economic damage caused by a continentwide natural gas supply crunch following the cancellation of Nord Stream 2 and Russia’s shutdown of Nord Stream 1. Historically high energy prices could sap consumers’ ability to spend money on other goods and services, dragging down economic growth.
But last week, Goldman Sachs analyst Alberto Gandolfi wrote that his team did not think that the scope of the price caps being contemplated would be nearly enough to avert a 1970s-style energy crisis.
“We see scope for the introduction of price caps in power generation, which we estimate could save Europe c.€650 bn pa,” Gandolfi wrote in a client note on Saturday. “Yet, price caps would not fully solve the affordability issue: the increase in energy bills would still be of +€1.3 tn, or c.10% of GDP, we estimate.”
Europe’s economy was relatively healthy until the energy crisis, growing GDP by 3.9% year over year (y/y) or 0.6% quarter on quarter in the second quarter of 2022. But now the eurozone manufacturing PMI has slipped to 49.6, and the S&P Global Germany Composite PMI for August was revised lower to 46.9.
Slowing economic growth in the EU has been exacerbated by high inflation, which hit 9.7% y/y in August. That has put a jumbo interest rate hike of 75 bps on the table as European Central Bank President Christine Lagarde meets with her colleagues in Jackson Hole, Wyoming, this week.
Ocean container rates from Asia to Europe have already fallen dramatically this year — and have dropped especially sharply since the beginning of August.

The Freightos Baltic Daily spot rate from China to North Europe, displayed in white in the chart above, has fallen 24% since July 3, from $10,397.55 per forty-foot equivalent unit to $7,869.10. Drewry’s spot rate from Shanghai to Rotterdam, Netherlands, displayed in green, dropped 18% over the same period, from $9,280 per FEU to $7,583.
Those recent ocean container rate cuts came after the market had already been softening for months; container rates on the Asia-Europe trade peaked last October. The sudden, violent step-down in spot rates may indicate that the incremental goods spending is way off in Europe, and ocean carriers are starting to optimize for asset utilization rather than EBIT per shipment.
If the steamship lines follow their well-established playbook, their response to soft demand could be to trim capacity, switching out vessels on the main services with smaller ships and deploying those assets elsewhere. The problem is that they might not have anywhere to go: Trans-Pacific ocean container spot rates are also way down on softening demand.
Upstream ocean container bookings data from FreightWaves Container Atlas reveals that European exports are set to slow markedly as well. Ocean container bookings outbound from Rotterdam to all global ports have experienced downward pressure since July:

The Ocean Booking Volume Index from Rotterdam to all global ports is down by 25.4% since July 5, a sharp downward trend, albeit the index is still at an elevated level compared to pre-pandemic freight flows. Lead times out of Rotterdam run a little over 10 days, so the trend lines above reflect booking activity approximately 1.5 weeks ahead of the freight physically moving on a vessel.
The widely cited European Road Freight Rates Benchmark is at all-time highs but appears to be inclusive of fuel costs (diesel in the EU is up 69% since January). The Russian invasion of Ukraine has restricted the supply of truck drivers in Germany, where migrants make up 24% of the driver workforce, as Ukrainian men returned home to fight. European road freight analysts are betting that weakening economic growth will keep rates from rising higher.
“The effect of rising costs in 2022 is now very evident with road freight rates across the European continent reaching new all-time highs,” wrote Transportation Intelligence economic analyst Nathaniel Donaldson. “Initial fuel price rises following the invasion of Ukraine have held and produced a much more costly environment for European road carriers whilst industrial action and a worsening driver shortage keep capacity tight. A range of indicators are pointing towards a drastic slowdown in consumption and production, which will ease further increases while high costs keep rates elevated.”
The EU energy crisis has already taken a bite out of Europe’s consumption and production, weakening demand for transportation capacity in, through and out of the region. Recently announced fiscal relief measures will likely not be large enough to avert an acute economic slowdown, with knock-on effects for global transportation markets like ocean container freight.
September 7, 2022
European Update
How will the European energy crisis affect freight markets?
A slowing eurozone may pull ocean container rates down further
John Paul HampsteadWednesday, September 7, 2022 4 minutes read
Listen to this article 0:00 / 5:35 BeyondWords
Volatility in European power markets stemming from EU and U.K. sanctions against Russian energy — imposed in retaliation for Russia’s invasion of Ukraine in February — may soon cool off, but only after carving a slice out of the continent’s economy.
On Monday, U.K. Prime Minister Liz Truss announced plans to cap household energy bills at the equivalent of $2,300 annually. Meanwhile, German Chancellor Olaf Scholz unveiled a 65 billion euro relief package to ease the pain of energy prices that have quadrupled in his country.
These crisis measures are meant to reduce the economic damage caused by a continentwide natural gas supply crunch following the cancellation of Nord Stream 2 and Russia’s shutdown of Nord Stream 1. Historically high energy prices could sap consumers’ ability to spend money on other goods and services, dragging down economic growth.
But last week, Goldman Sachs analyst Alberto Gandolfi wrote that his team did not think that the scope of the price caps being contemplated would be nearly enough to avert a 1970s-style energy crisis.
“We see scope for the introduction of price caps in power generation, which we estimate could save Europe c.€650 bn pa,” Gandolfi wrote in a client note on Saturday. “Yet, price caps would not fully solve the affordability issue: the increase in energy bills would still be of +€1.3 tn, or c.10% of GDP, we estimate.”
Europe’s economy was relatively healthy until the energy crisis, growing GDP by 3.9% year over year (y/y) or 0.6% quarter on quarter in the second quarter of 2022. But now the eurozone manufacturing PMI has slipped to 49.6, and the S&P Global Germany Composite PMI for August was revised lower to 46.9.
Slowing economic growth in the EU has been exacerbated by high inflation, which hit 9.7% y/y in August. That has put a jumbo interest rate hike of 75 bps on the table as European Central Bank President Christine Lagarde meets with her colleagues in Jackson Hole, Wyoming, this week.
Ocean container rates from Asia to Europe have already fallen dramatically this year — and have dropped especially sharply since the beginning of August.
The Freightos Baltic Daily spot rate from China to North Europe, displayed in white in the chart above, has fallen 24% since July 3, from $10,397.55 per forty-foot equivalent unit to $7,869.10. Drewry’s spot rate from Shanghai to Rotterdam, Netherlands, displayed in green, dropped 18% over the same period, from $9,280 per FEU to $7,583.
Those recent ocean container rate cuts came after the market had already been softening for months; container rates on the Asia-Europe trade peaked last October. The sudden, violent step-down in spot rates may indicate that the incremental goods spending is way off in Europe, and ocean carriers are starting to optimize for asset utilization rather than EBIT per shipment.
If the steamship lines follow their well-established playbook, their response to soft demand could be to trim capacity, switching out vessels on the main services with smaller ships and deploying those assets elsewhere. The problem is that they might not have anywhere to go: Trans-Pacific ocean container spot rates are also way down on softening demand.
Upstream ocean container bookings data from FreightWaves Container Atlas reveals that European exports are set to slow markedly as well. Ocean container bookings outbound from Rotterdam to all global ports have experienced downward pressure since July:
The Ocean Booking Volume Index from Rotterdam to all global ports is down by 25.4% since July 5, a sharp downward trend, albeit the index is still at an elevated level compared to pre-pandemic freight flows. Lead times out of Rotterdam run a little over 10 days, so the trend lines above reflect booking activity approximately 1.5 weeks ahead of the freight physically moving on a vessel.
The widely cited European Road Freight Rates Benchmark is at all-time highs but appears to be inclusive of fuel costs (diesel in the EU is up 69% since January). The Russian invasion of Ukraine has restricted the supply of truck drivers in Germany, where migrants make up 24% of the driver workforce, as Ukrainian men returned home to fight. European road freight analysts are betting that weakening economic growth will keep rates from rising higher.
“The effect of rising costs in 2022 is now very evident with road freight rates across the European continent reaching new all-time highs,” wrote Transportation Intelligence economic analyst Nathaniel Donaldson. “Initial fuel price rises following the invasion of Ukraine have held and produced a much more costly environment for European road carriers whilst industrial action and a worsening driver shortage keep capacity tight. A range of indicators are pointing towards a drastic slowdown in consumption and production, which will ease further increases while high costs keep rates elevated.”
The EU energy crisis has already taken a bite out of Europe’s consumption and production, weakening demand for transportation capacity in, through and out of the region. Recently announced fiscal relief measures will likely not be large enough to avert an acute economic slowdown, with knock-on effects for global transportation markets like ocean container freight.
September 7, 2022
Mattress Stocks Up

11:45 AM | Tempur Sealy International, Inc. (TPX) | By: SA Editor Clark Schultz, SA News Editor Mattress stocks rallied on Wednesday after channel checks from Wedbush Securities indicated that mattress sales trends were flat to up low-single-digits for late-August through Labor Day at brick-and-mortar locations.
The pace of sales for the highest demand period of the year was noted to be a significant improvement from the low-double-digits declines for the Independence Day selling period and even the Memorial Day selling period.
Analyst Seth Basham: “We estimate year-over-year industry sales declines moderated following a difficult June comparison, going from HSD declines in June to -MSD in July and down low-to-mid single digits during August.”
Of note, high-end demand continues to outpace that of the broader industry and even improved somewhat in late summer as consumers returned from vacations. The trend appears very positive for Tempur-Sealy International (NYSE:TPX) and Sleep Number (SNBR), while the drop in demand for mid-priced bedding options is called a potential negative for Purple Innovation (PRPL).
Elsewhere on Wall Street, Truist Securities also pointed to strong Labor Day weekend sales for the mattress companies.
Shares of Sleep Number (SNBR) jumped 9.99% in late morning trading on Wednesday, while Tempur Sealy International (TPX) showed a 10.55% gain. Purple Innovation (PRPL) rallied 4.89% after the sector check from analysts.
https://mail.google.com/mail/u/0/#inbox/FMfcgzGqQSLWZpgkbSspzpstrnzDLptB
September 7, 2022
Mattress Stocks Up
11:45 AM | Tempur Sealy International, Inc. (TPX) | By: SA Editor Clark Schultz, SA News Editor Mattress stocks rallied on Wednesday after channel checks from Wedbush Securities indicated that mattress sales trends were flat to up low-single-digits for late-August through Labor Day at brick-and-mortar locations.
The pace of sales for the highest demand period of the year was noted to be a significant improvement from the low-double-digits declines for the Independence Day selling period and even the Memorial Day selling period.
Analyst Seth Basham: “We estimate year-over-year industry sales declines moderated following a difficult June comparison, going from HSD declines in June to -MSD in July and down low-to-mid single digits during August.”
Of note, high-end demand continues to outpace that of the broader industry and even improved somewhat in late summer as consumers returned from vacations. The trend appears very positive for Tempur-Sealy International (NYSE:TPX) and Sleep Number (SNBR), while the drop in demand for mid-priced bedding options is called a potential negative for Purple Innovation (PRPL).
Elsewhere on Wall Street, Truist Securities also pointed to strong Labor Day weekend sales for the mattress companies.
Shares of Sleep Number (SNBR) jumped 9.99% in late morning trading on Wednesday, while Tempur Sealy International (TPX) showed a 10.55% gain. Purple Innovation (PRPL) rallied 4.89% after the sector check from analysts.
https://mail.google.com/mail/u/0/#inbox/FMfcgzGqQSLWZpgkbSspzpstrnzDLptB
September 6, 2022
Used Cars
“Sell My Car” Search Trends Explode 222% To All Time High In September
by Tyler DurdenTuesday, Sep 06, 2022 – 03:05 PM
It looks as though the spike in used car prices that we endured through 2021, and that continued as a result of the devastating inflation we have had so far in 2022, may finally be coming to an unceremonious end.
That’s because search trends for the terms “sell my car” have exploded higher leading into September 2022, a new study from findthebestcarprice.com found this week.
The site performed an analysis of Google search data and found that “searches for ‘sell my car’ exploded to over three times the average volume in September, an unprecedented increase in people searching for ‘sell my car’”,
The terms ‘how to sell my car’ and ‘sell car’ also spiked higher, by 145% and 104%, respectively.

Between August 25 and September 1, searches for ‘sell my car’ rose by 177%, the report said. They rose another 15% on September 4 after the the U.S. Labor Department announced that the unemployment rate has risen from 3.5% to 3.7%, the study says.
“The U.S. has already dealt with rising bills over the past few months due to inflation and the soaring costs of gas,” a spokesperson for the site said.
“Now, as experts such as Stephen Roach are predicting that a recession is looming, consumers are having to make cutbacks in order to save money. Google Trends data reveals that more households are looking to sell their car to bring in some extra income. We will likely see this trend continue if the cost of living remains high and the U.S. continues negative growth into the fall.”
The top 10 states with the most search data on selling cars were:
- Michigan
- Arizona
- California
- Nevada
- South Carolina
- Oklahoma
- Florida
- Ohio
- Texas
- Colorado
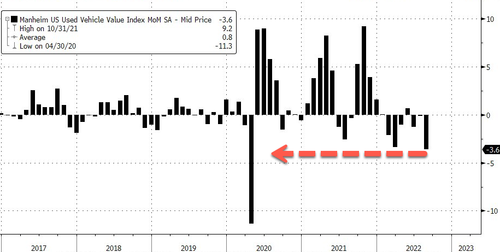
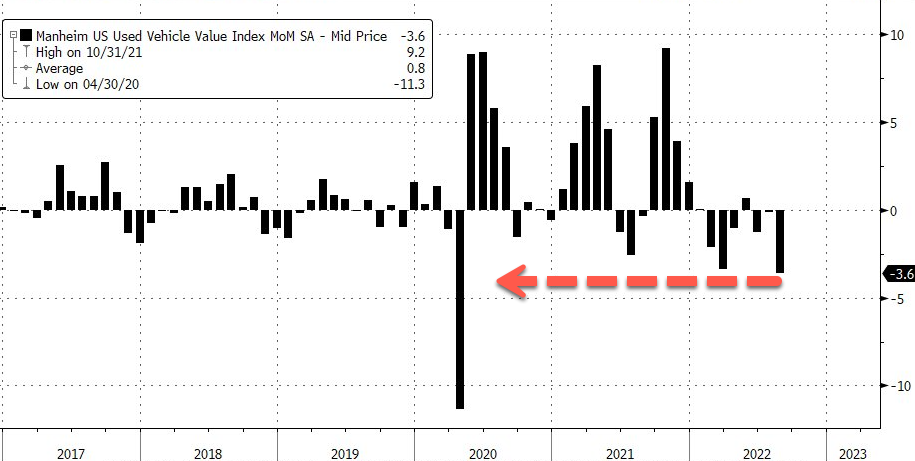
We noted just days ago that used car pricing had plunged to a one year low.
The latest Manheim Used Vehicle Value Index that tracks what dealers pay for used cars at auction is at a one-year low of 211.6. https://platform.twitter.com/embed/Tweet.html?dnt=false&embedId=twitter-widget-0&features=eyJ0ZndfdGltZWxpbmVfbGlzdCI6eyJidWNrZXQiOlsibGlua3RyLmVlIiwidHIuZWUiXSwidmVyc2lvbiI6bnVsbH0sInRmd19ob3Jpem9uX3RpbWVsaW5lXzEyMDM0Ijp7ImJ1Y2tldCI6InRyZWF0bWVudCIsInZlcnNpb24iOm51bGx9LCJ0ZndfdHdlZXRfZWRpdF9iYWNrZW5kIjp7ImJ1Y2tldCI6Im9uIiwidmVyc2lvbiI6bnVsbH0sInRmd19yZWZzcmNfc2Vzc2lvbiI6eyJidWNrZXQiOiJvbiIsInZlcnNpb24iOm51bGx9LCJ0ZndfY2hpbl9waWxsc18xNDc0MSI6eyJidWNrZXQiOiJjb2xvcl9pY29ucyIsInZlcnNpb24iOm51bGx9LCJ0ZndfdHdlZXRfcmVzdWx0X21pZ3JhdGlvbl8xMzk3OSI6eyJidWNrZXQiOiJ0d2VldF9yZXN1bHQiLCJ2ZXJzaW9uIjpudWxsfSwidGZ3X3NlbnNpdGl2ZV9tZWRpYV9pbnRlcnN0aXRpYWxfMTM5NjMiOnsiYnVja2V0IjoiaW50ZXJzdGl0aWFsIiwidmVyc2lvbiI6bnVsbH0sInRmd19leHBlcmltZW50c19jb29raWVfZXhwaXJhdGlvbiI6eyJidWNrZXQiOjEyMDk2MDAsInZlcnNpb24iOm51bGx9LCJ0ZndfZHVwbGljYXRlX3NjcmliZXNfdG9fc2V0dGluZ3MiOnsiYnVja2V0Ijoib24iLCJ2ZXJzaW9uIjpudWxsfSwidGZ3X3R3ZWV0X2VkaXRfZnJvbnRlbmQiOnsiYnVja2V0Ijoib2ZmIiwidmVyc2lvbiI6bnVsbH19&frame=false&hideCard=false&hideThread=false&id=1564602105201152003&lang=en&origin=https%3A%2F%2Fwww.zerohedge.com%2Fmarkets%2Fsell-my-car-search-trends-explode-222-all-time-high-september&sessionId=1adbc83d97c59092b029e0f3743cc6c48df8b2c0&siteScreenName=zerohedge&theme=light&widgetsVersion=1bfeb5c3714e8%3A1661975971032&width=550px
The index declined 3.6% from July in the first 15 days of August but is still up 8.8% from August 2021. The monthly slump was the most significant drop since April 2020.
Cox Automotive analysts said sliding wholesale used-vehicle values should continue through August. SUVs and pickups saw the most declines in value at auctions while minivans fell less — likely a function of thin supply, according to analysts. They said compact cars saw auction prices stable, noting it was likely due to more demand because elevated fuel costs have pushed consumers to more efficient vehicles.
A metric called “days of inventory” – how long it would take dealers to sell out of cars at the current sales rate if they couldn’t acquire new stock – was eight days higher than a year ago as the nationwide supply of used vehicles (as of Aug. 15) was improving.
Cox analysts noted consumers’ views of buying conditions for vehicles declined in August due to elevated prices and soaring rising interest rates. They said the only prior time consumers felt this pessimistic about purchasing a car was when auto loan interest rates were sky high in the early 1980s.
https://www.zerohedge.com/markets/sell-my-car-search-trends-explode-222-all-time-high-september