Current Affairs
December 28, 2023
Car Prices Continue to Grow
Visualizing The Growth Of New Car Prices In The US
by Tyler Durden
Thursday, Dec 28, 2023 – 05:45 AM
New car prices have soared in recent years.
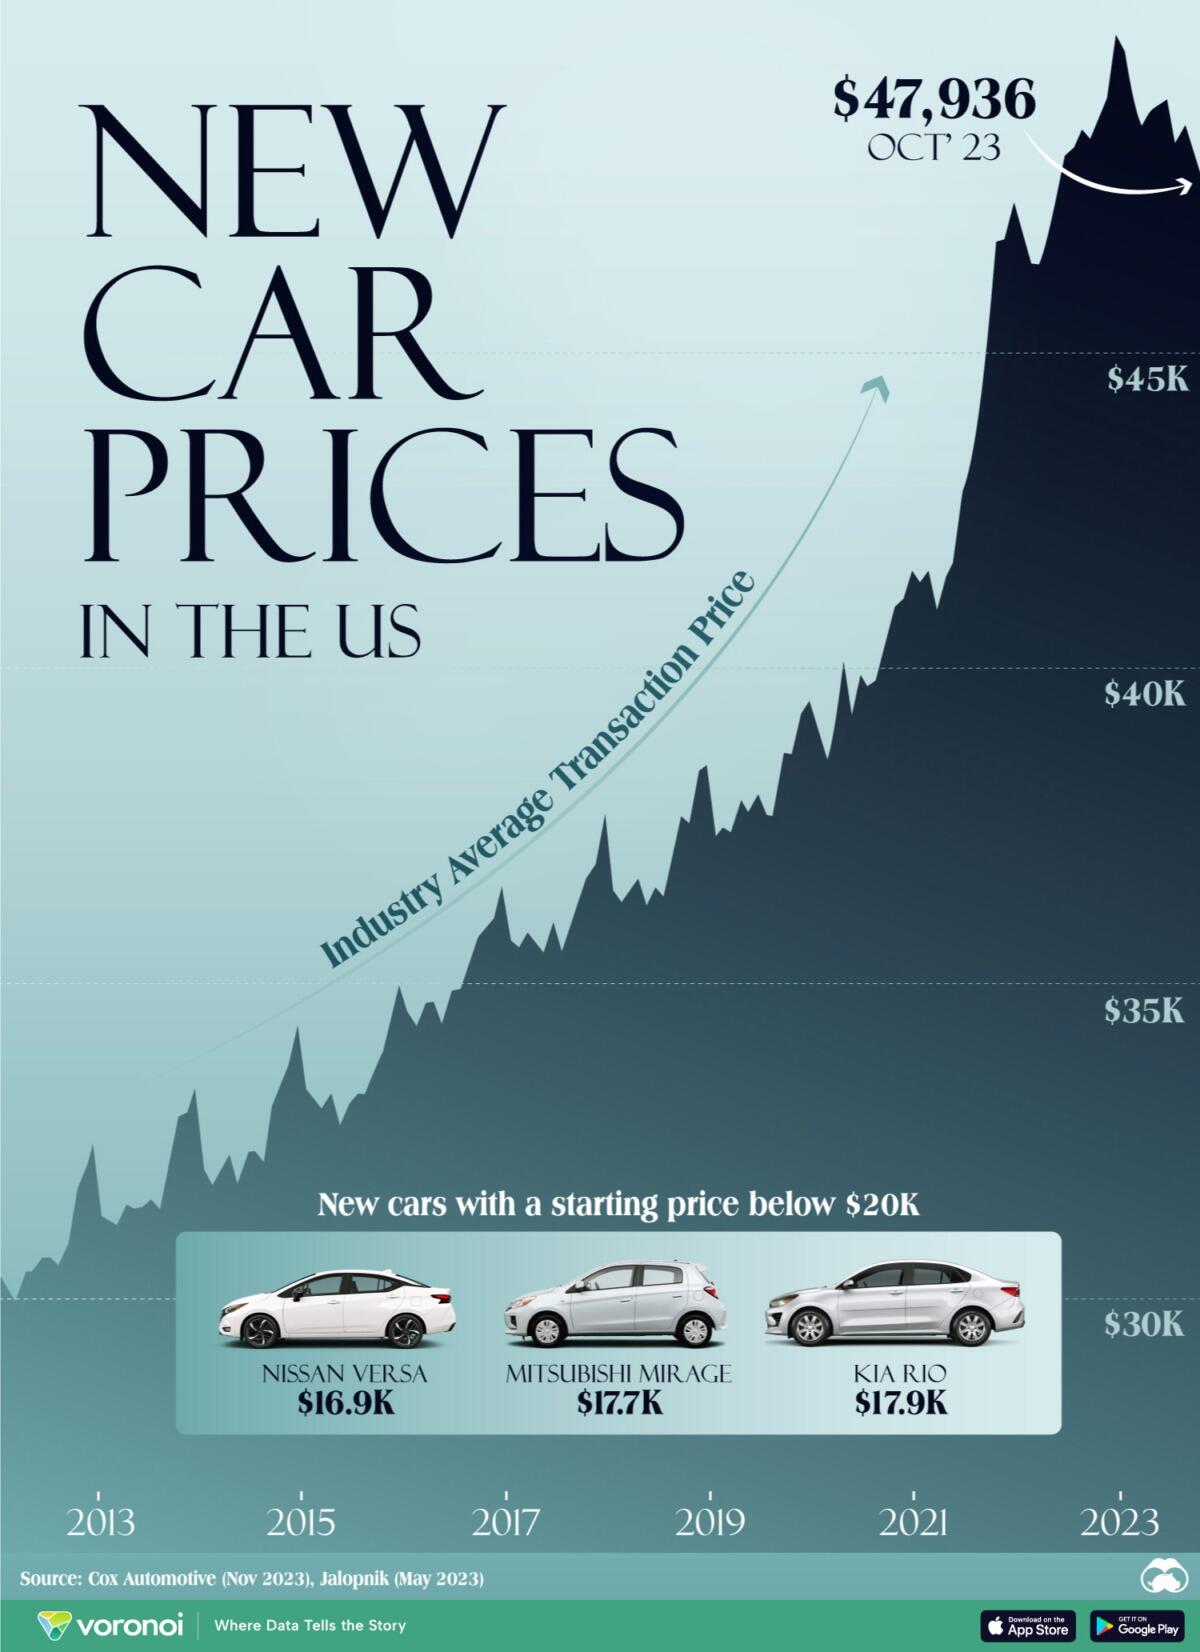
As a result, those looking for a cheap new car have very few options in today’s market. While average transaction prices for new cars declined 1.4% year-over-year as of October, they have increased to an average price of $47,936—roughly a 60% increase over the last decade.
In the following graphic, Visual Capitalist’s Marcus Lu shows the steep rise in new car costs, with data from Cox Automotive.
New Vehicle Price Growth
A host of factors can explain the jump in new car prices.
These include more standard features (which drives up the base cost of a vehicle), as well as shifting consumer preferences towards pricier crossovers & SUVs.
Supply chain issues during the COVID-19 pandemic also sent prices skyrocketing, though they’ve come down slightly throughout 2023.
While the average transaction price of a Tesla falls around $53,000, there are options from other car makers that are more affordable. Here are new cars with a starting price below $20,000:

The above low cost vehicles are all from legacy car makers. These companies have the advantage of accessing large amounts of capital, manufacturing skills, and powerful brands.
Still, as the industry evolves, the new companies driving electric vehicle production could reshape the industry, presenting challenges for legacy companies.
https://www.zerohedge.com/personal-finance/visualizing-growth-new-car-prices-us
December 26, 2023
Good Update on Chinese Furniture and Mattresses
Upholstered Furniture: The Leader in Polyether Polyols

PUdaily | Updated: December 19, 2023
Furniture industry status
China’s furniture industry has intensified competition and increased concentration: China’s furniture industry has developed into an important industry with mainly mechanized production, continuous improvement of technical content and continuous emergence of well-known brands. With the country’s attention to the quality of architectural decoration products and the rise of consumer brand awareness, China’s furniture market is gradually moving towards brand competition. By improving the technical level, strengthening quality management, and increasing investment in advertising and marketing, the brand advantages of leading enterprises in the furniture industry have gradually emerged, which has led to the continuous upgrading of the level of industrial competition, and promoted the development trend of the whole industry driven by brand enterprises and continuous innovation, thus improving the concentration of China’s furniture industry.
China’s furniture industry will develop in the direction of new retail, new marketing and new services: With the rise of a new generation of consumer groups, people’s lifestyle and life concept have undergone changes, furniture products have also put forward higher requirements, the choice of furniture products more pursuit of personalized and fashionable, the future of customized furniture personality, fashion, time saving, labor saving, will conquer more consumer groups. Furniture companies need to pay more attention to brand building and product design to meet the new needs of consumers for furniture products, and the furniture industry as a whole is developing in the direction of new retail, new marketing and new services.
Furniture industry anti-dumping policy impact
With the continuous development of global trade, trade barriers and tariffs between countries have become an important factor hindering the process of globalization. Among them, anti-dumping measures, as a means of trade protection, have been frequently used by many countries in recent years. As the world’s largest mattress producer, China’s mattress exports are also facing anti-dumping pressure from the United States.
Under the influence of the anti-dumping strategy of the United States for China’s mattress, China’s furniture enterprises have gone through two stages. The first phase is from 2018 to 2021, given that the United States has imposed tariffs of up to 25 percent on almost all household categories in China, of which mattresses are also subject to anti-dumping duties. During this period, China’s foreign trade household industry began to transfer to Southeast Asia, through Vietnam, Thailand and other Southeast Asian countries to export to Europe and the United States. The second stage is from 2021 to the present, and in April 2021, the US Department of Commerce officially announced the high anti-dumping tax rate against the seven countries. Chinese home furnishing enterprises have to adjust their strategy again, on the one hand, to dig deep into the domestic domestic market, on the other hand, to build factories in the United States and Europe. For the domestic domestic market, furniture companies will focus on expanding the sinking market. Sinking market is one of the biggest consumption growth points in China, with a huge market size and increasing purchasing power. According to data from the National Bureau of Statistics, the per capita disposable income of rural residents in China has increased year by year, with a year-on-year growth of 7.6% from January to September 2023, bringing more opportunities for “high-quality and low-cost” mattresses. For overseas demand, even in the face of Chinese workers to sea difficulties, high labor costs in the United States pain points, furniture companies still choose to build factories in Europe and the United States. In the case of Dream Lily, under the influence of anti-dumping policies, the company accelerated the production capacity of the factory in the eastern United States, and at the same time built a new factory in the western United States to meet the order demand of the American market. Pudaily believes that furniture companies with forward-looking layout of U.S. production capacity can better meet the local market demand, thus benefiting from this round of anti-dumping.
Us mattress dumping timeline
| Targeted Country | Timeline | Content |
| China | 2018/10/10 | In response to the application submitted by a number of mattress companies in the United States on September 18, the United States Department of Commerce announced the launch of an anti-dumping investigation on mattresses imported from China |
| China | 2019/10/18 | On October 18, 2019, the US Department of Commerce announced a final anti-dumping ruling on mattresses imported from China: ruled that the compulsory response enterprise Healthcare Co., Ltd. The dumping rate is 57.03%, the dumping rate of Jinorsi Light Industrial Products Co., LTD., JiNorsi (Xiamen) Light Industrial Products Co., LTD., JiNorsi (Zhangzhou) Light Industrial Products Co., Ltd. is 192.04%, the dumping rate of other exporters with separate tax rates is 162.76%, and the general dumping rate of China is 1731.75%. |
| China, Cambodia, Indonesia, Malaysia, Serbia, Thailand, Turkey and Vietnam | 2021/4/21 | The US International Trade Commission (ITC) voted to make a final determination of anti-dumping industrial injury for Mattresses imported from Cambodia, Indonesia, Malaysia, Serbia, Thailand, Turkey and Vietnam, and a final determination of anti-subsidy industrial injury for mattresses imported from China. |
| Mexico, Philippines, Poland, Slovenia, Spain, Taiwan, Bosnia and Herzegovina, Bulgaria, Myanmar, India, Italy, Kosovo | 2023/7/28 | The U.S. mattress industry and several trade associations filed anti-dumping duty complaints (AD) against mattresses from 13 countries and regions, including Mexico, the Philippines, Poland, Slovenia, Spain and Taiwan, as well as Bosnia and Herzegovina, Bulgaria, Myanmar, India, Italy and Kosovo, as well as against mattresses from Indonesia. Filing a Countervailing Duty Complaint (CVD) |
Demand for polyether polyols in furniture industry
Sofas and mattresses consume more polyether in upholstered furniture, accounting for more than 80% of the total consumption. Sofa fillings are basically polyurethane, a single sofa products, ordinary polyether accounted for about 45%-60%, 10kg sponge about x kg x kg polyether; The proportion of ordinary polyether in the thin mattress is about 50%-60%, and the 10kg sponge is about x kg-x kg of ordinary polyether. In the soft furniture industry, although the overall demand is limited under the influence of the real estate downturn, under the development trend of “everyone lives” and customized integration, the growth of leading enterprises and high-quality enterprises is significantly higher than the industry as a whole, which has led to the steady growth of polyether consumption in the soft furniture industry. According to estimates, in 2023, the polyether consumption of China’s upholstered furniture industry is about xx million tons, with a growth rate of about xx%.
If you are interested in the Chinese furniture market in 2023 and the consumption of polyether polyols,
Welcome to inquire and subscribe: PUdaily’s “2023 Asia-Pacific PPG Market Research Report”.
December 26, 2023
HPPO (Hippo) Process Hurdles
Net Profit for PO Produced in China Using HPPO Process Averages About CNY -275/tonne
PUdaily | Updated: December 21, 2023
Currently, hydrogen peroxide is an important raw material for producing propylene oxide (PO), and 27.5% hydrogen peroxide plays a dominant role in domestic market. In recent years, however, hydrogen peroxide with a concentration of over 50% has been increasingly used as it can help increase the productivity of PO facilities and improve product quality. In HPPO process, PO is manufactured through direct oxidation of propylene with hydrogen peroxide (mostly with a 50-70% concentration). Specifically, at low temperature and low pressure in a fixed bed reactor, selective oxidation reaction occurs between propylene and hydrogen peroxide in the mixture of methanol and water and in the presence of the titanium silicalite (TS-1) catalyst. Featuring short process, high atom utilization, low investment, mild reaction conditions, high energy efficiency, no pollution, high product yield and few by-products, HPPO is internationally recognized as a green production technology.
Previously, the core technologies for HPPO process were monopolized by a handful of global chemical giants such as BASF, Dow Chemical, Evonik and Uhde. This provided a bargaining chip for them to ask high prices for technology transfer. Specifically, the fee for licensing PO manufacturing technology was tens of millions of euros, and additional fee was charged for hydrogen peroxide production technology, which was tied to the sale of the former technology. The result is meagre profit for PO produced using this process, averaging about CNY -275/tonne, according to Suntower.
Presently, Jilin Shenhua and Sinopec Changling Refining & Chemical are the two established PO manufacturers using HPPO process. In 2011, making an investment of CNY 2.5 billion, Jilin Shenhua brought in the HPPO process jointly developed by Degussa and Uhde to build a 300kt/a PO facility in Jilin province, the first and largest of its kind in China and coming online in July 2014. In 2013, Sinopec Changling Refining & Chemical invested approximately CNY 1.28 billion to build a 100kt/a industrial plant using its proprietary HPPO process. In July 2014, interim handover of the project was completed. And on December 6, trial run was successfully conducted, marking that Sinopec became the third company in the world owing patented HPPO process. In April 2023, Shandong Jincheng Petrochemical’s 300kt/a PO facility, with an ancillary 900kt/a hydrogen peroxide plant, successfully produced premium-grade propylene oxide. In May, Qixiang Tengda Chemical put into production its 300kt/a PO unit using HPPO technology jointly developed by Evonik and thyssenkrupp. In August, Taixing Yida Chemical’s HPPO-based 150kt/a PO project was completed. Suntower estimates that the current PO capacity using HPPO process stands at 1.55 million tonnes per year, accounting for about 45% of the total PO capacity.
If you are interested in the information about costs of different PO production processes and other relevant information, please contact us or subscribe to the 2023 Asia-Pacific PO Market Report.
Contact information:
Tel: 021- 61250980
Website: www. pudaily.com
Email: marketing@pudaily.com
Address: Room 607, Building B, Rhine Hongjing Center, 1439 Wuzhong Road, Minhang District, Shanghai
December 18, 2023
Truckload Freight Improving
Truckload supply and demand on collision course in 2024
Data gives reason for optimism for economy and transportation market next year
Zach Strickland, FW Market Expert & Market Analyst
· Saturday, December 16, 2023

Listen to this article
4 min
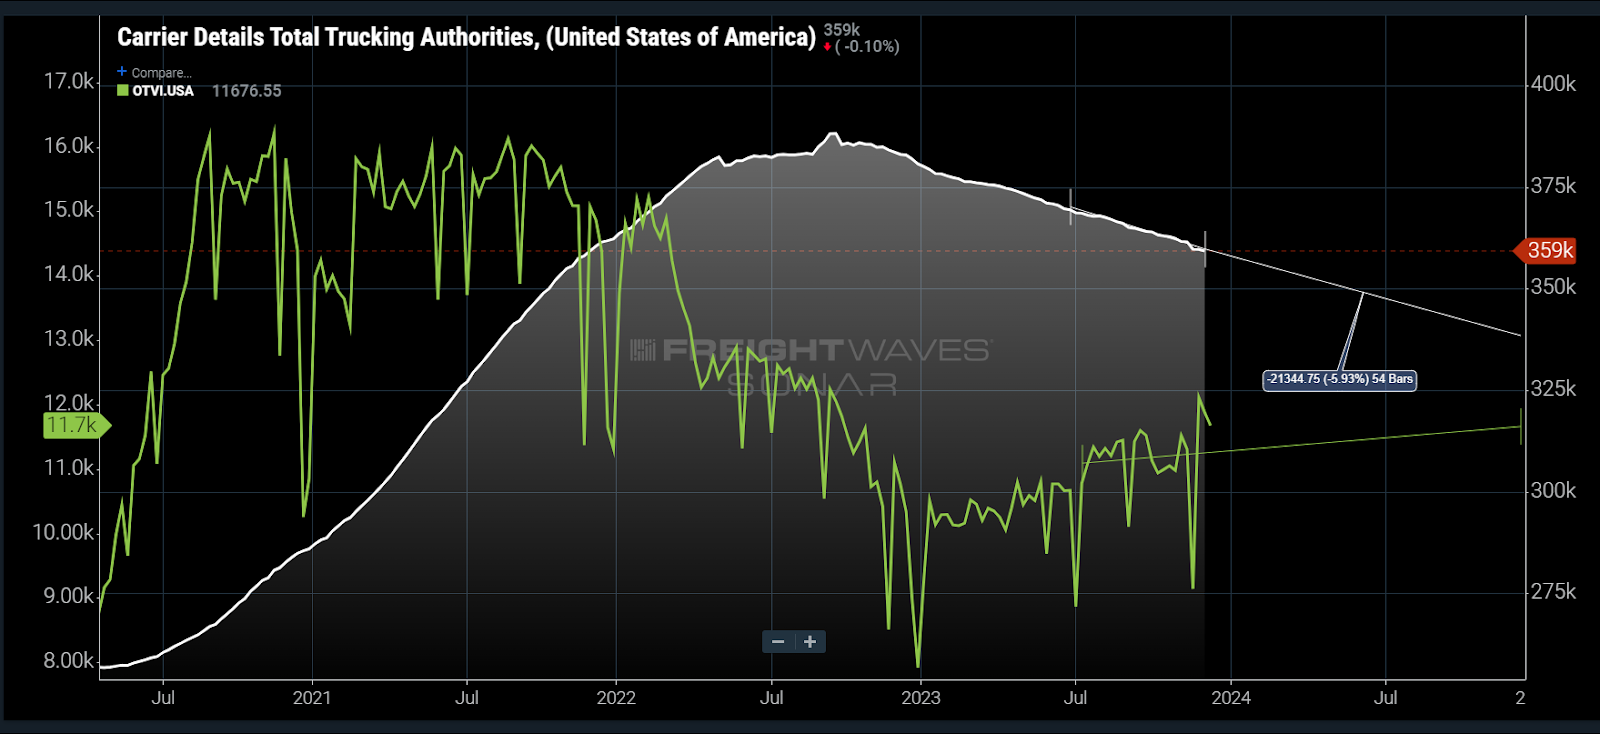
Chart of the Week: Carrier Details Total Trucking Authorities, Outbound Tender Volume Index – USA SONAR: CDTTA.USA, OTVI.USA
Trucking demand is up while capacity is down since this time last year. This statement by itself means that the transportation market is healthier, but it also suggests that 2024 should be better in aggregate as the gap between supply and demand narrows quickly.
Truckload demand is barely a shadow of what it was during the pandemic, but it has been growing throughout most of 2023. This fact has been invisible to most carriers and 3PLs, which continue to deal with a massive glut of oversupplied capacity thanks to a record number of entrants in 2020-21 according to Carrier Details Total Trucking Authorities data set.
Tender volumes are averaging over 10% higher year over year this December and have been growing steadily since last winter. Outside of October, daily tender volumes moved higher, suggesting that economic demand for goods has grown.
On this past week’s Freightonomics episode, Zac Rogers, an associate professor of supply chain management at Colorado State and co-author of the Logistics Managers’ Index (LMI), suggested that the demand growth was a product of both inventories having been rightsized versus this time last year and growth in consumption.
While he admits that there is some ongoing concern about consumer health, the numbers are what they are. Anthony Smith, FreightWaves’ chief economist, responded to his concerns with a resounding “never bet against the American consumer.”
Possibly the most shocking revelation was in the LMI outlook of transportation prices by respondents. The LMI is divided up into multiple measures of logistics activity such as transportation and warehousing prices and capacity. Values above 50 indicate expansion while values below 50 are contractionary.
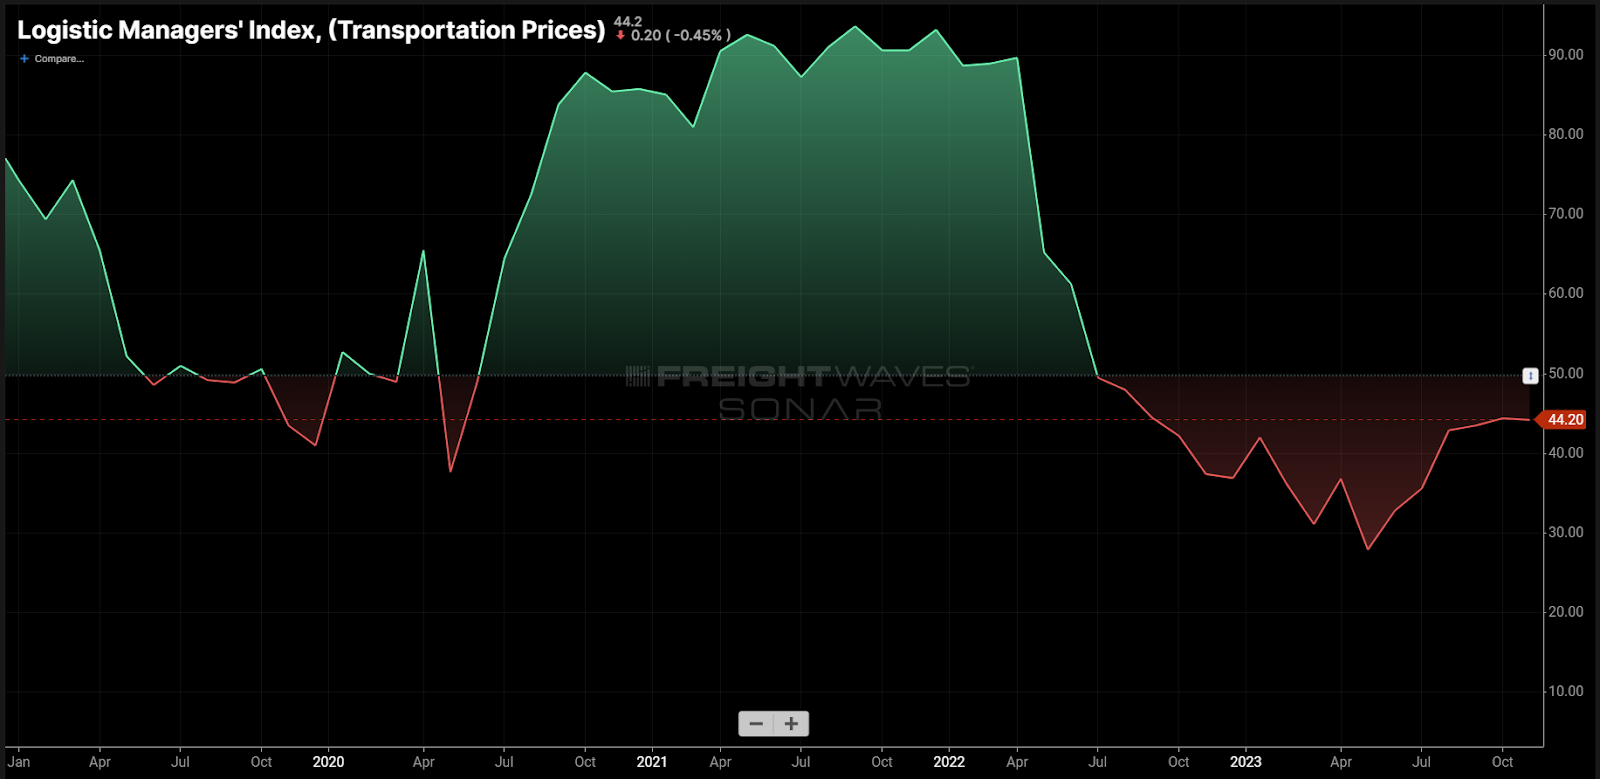
The transportation pricing component has averaged a value of 38 in 2023 and has been showing below 50 since the summer of 2022. Respondents to the November survey showed a reading of around 64 for prices in 2024, indicating that most expect rates to have bottomed.
While every forecast is an opinion on some level, the data does suggest that the supply of capacity and demand for its use is moving back toward equilibrium at a relatively fast clip.
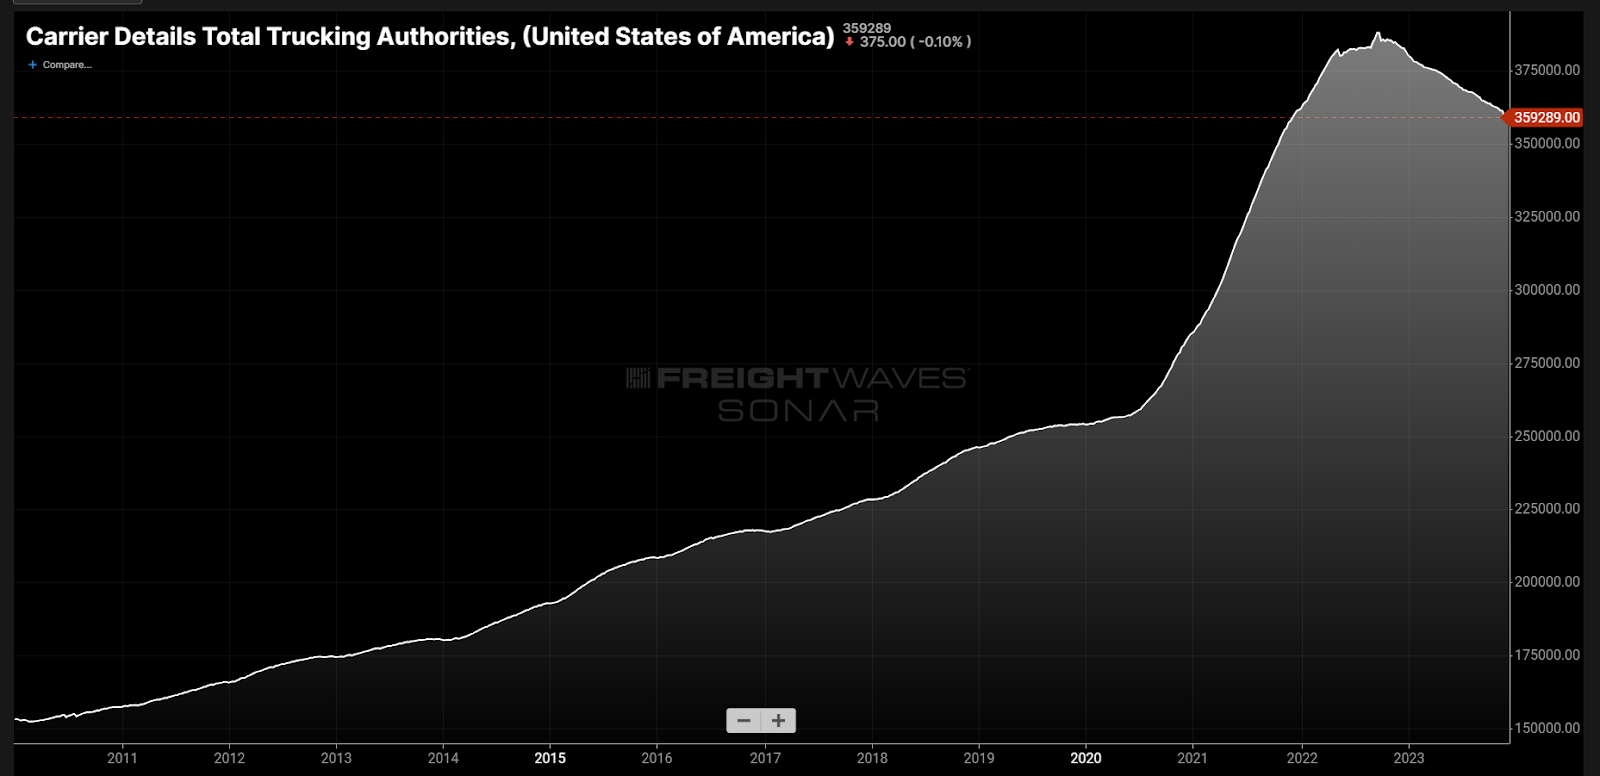
Looking at the past 13 years of Carrier Details Total Trucking Authorities data, there has never been such a strong downward trend. This of course is following the historic growth rate — the definition of an economic bubble.
FreightWaves CEO Craig Fuller stated in this past week’s State of Freight webinar that the risk is growing for shippers in 2024. Taking an overly aggressive approach to cost cutting would be much more risky than last year. No capacity is guaranteed. Even the strongest carriers feel this level of market downturn.
While Fuller admitted that he does not definitively know that the market will turn, there are several LMI respondents that feel similarly that there will be noticeable signs of tightening by the end of next year.
Economically speaking, there are still questions, but the answers are coming into focus with time. At the very least, the U.S. has economically overachieved versus many expectations, which does provide hope for the “soft landing” many have wanted.
Unfortunately, the solution to the freight market means that several first have to lose. This has been the case for many sectors post-pandemic. But this too is passing.
About the Chart of the Week
The FreightWaves Chart of the Week is a chart selection from SONAR that provides an interesting data point to describe the state of the freight markets. A chart is chosen from thousands of potential charts on SONAR to help participants visualize the freight market in real time. Each week a Market Expert will post a chart, along with commentary, live on the front page. After that, the Chart of the Week will be archived on FreightWaves.com for future reference.
SONAR aggregates data from hundreds of sources, presenting the data in charts and maps and providing commentary on what freight market experts want to know about the industry in real time.
The FreightWaves data science and product teams are releasing new datasets each week and enhancing the client experience.
December 18, 2023
Global Debt
Visualizing $97 Trillion Of Global Debt In 2023
by Tyler Durden
Monday, Dec 18, 2023 – 06:55 AM
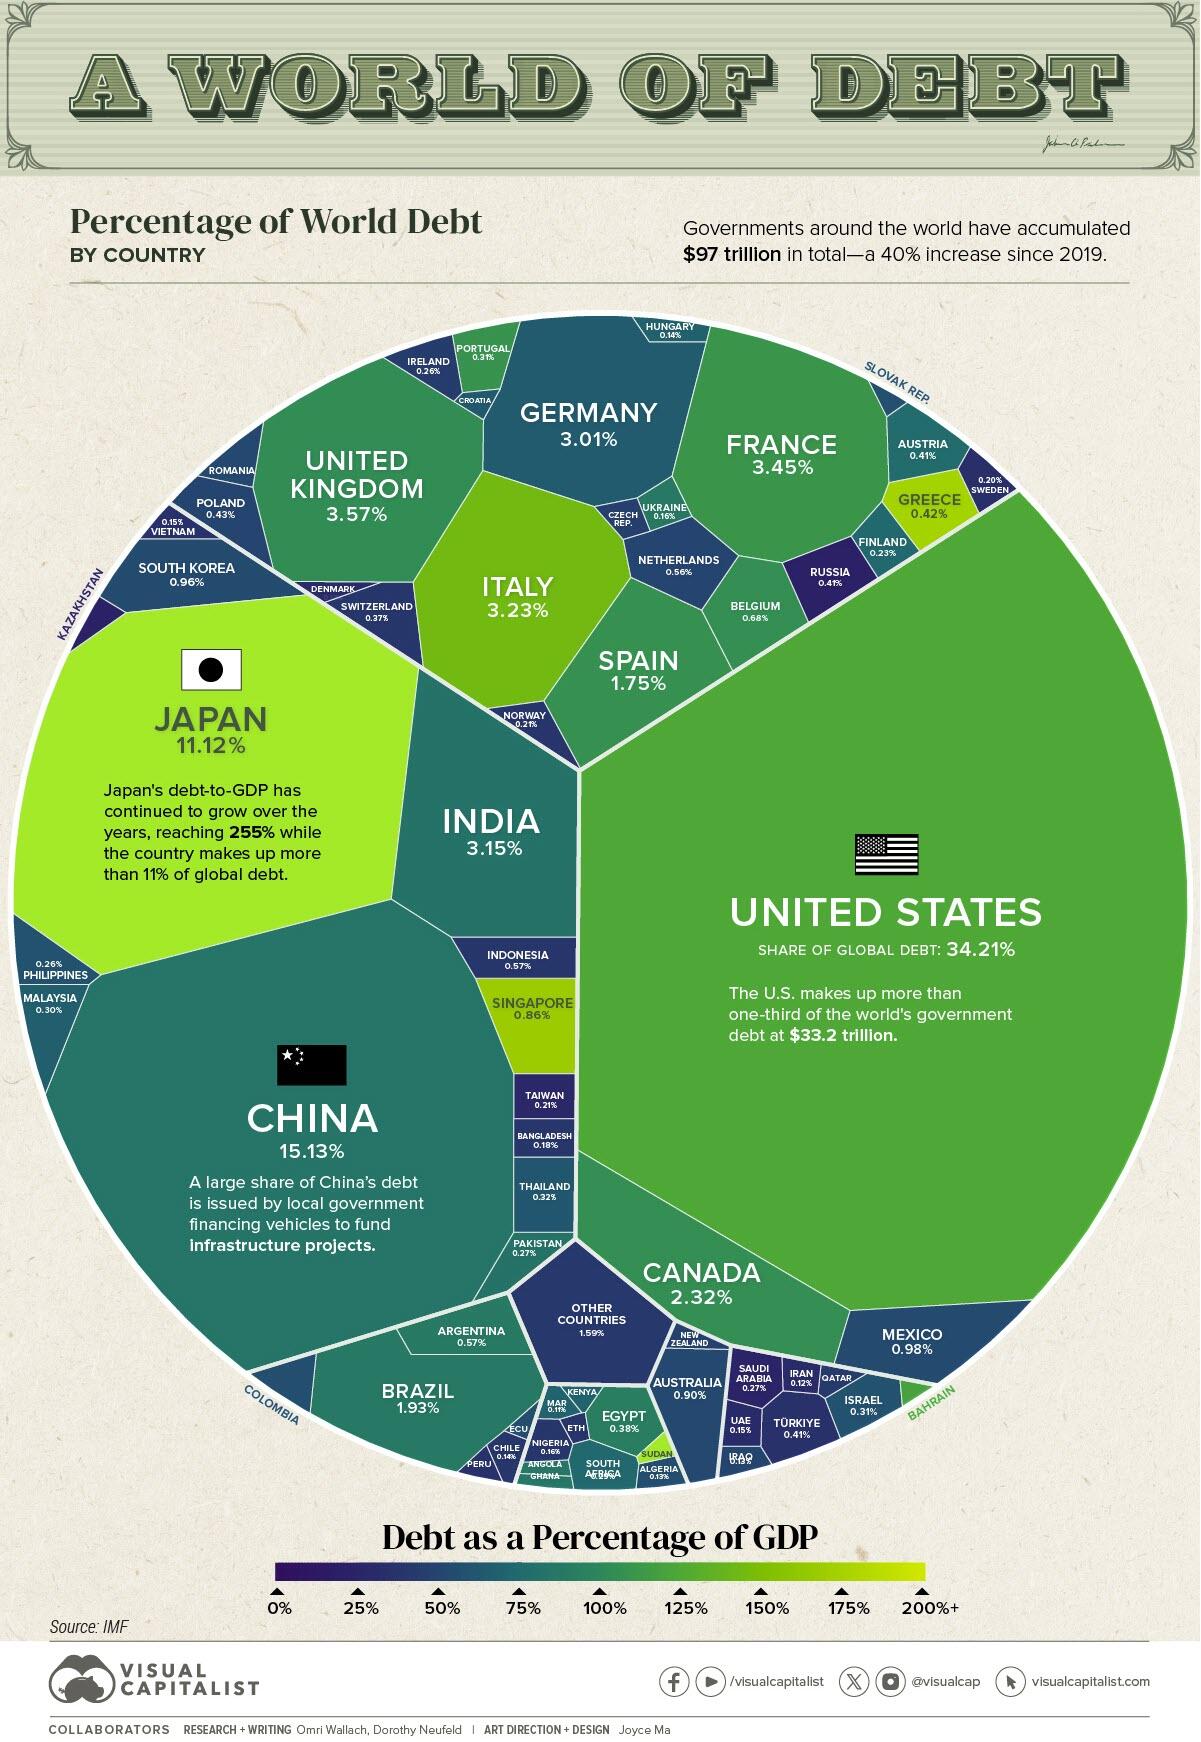
Global government debt is projected to hit $97.1 trillion this year, a 40% increase since 2019.
During the COVID-19 pandemic, governments introduced sweeping financial measures to support the job market and prevent a wave of bankruptcies. However, this has exposed vulnerabilities as higher interest rates are amplifying borrowing costs.
In the graphic below, Visual Capitalist’s Niccolo Conte and Dorothy Neufeld show global debt by country in 2023, based on projections from the International Monetary Fund (IMF).
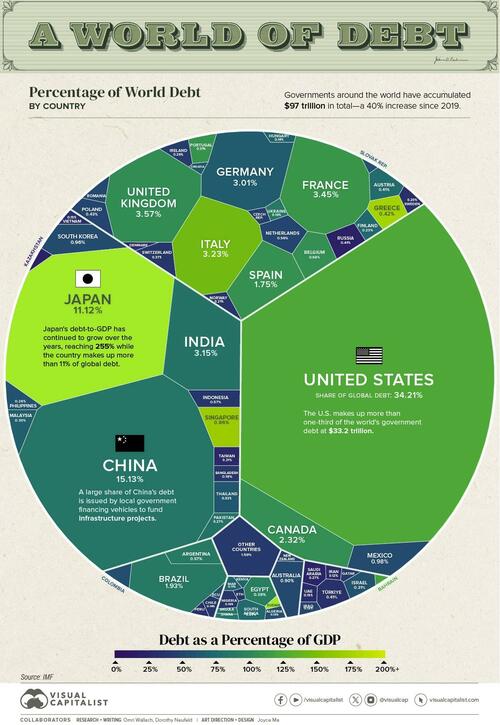
Debt by Country in 2023
Below, we rank countries by their general government gross debt, or the financial liabilities owed by each country:
| Country | Gross Debt (B) | % of World Total | Debt to GDP |
|---|---|---|---|
| 🇺🇸 U.S. | $33,228.9 | 34.2% | 123.3% |
| 🇨🇳 China | $14,691.7 | 15.1% | 83.0% |
| 🇯🇵 Japan | $10,797.2 | 11.1% | 255.2% |
| 🇬🇧 UK | $3,468.7 | 3.6% | 104.1% |
| 🇫🇷 France | $3,353.9 | 3.5% | 110.0% |
| 🇮🇹 Italy | $3,141.4 | 3.2% | 143.7% |
| 🇮🇳 India | $3,056.7 | 3.1% | 81.9% |
| 🇩🇪 Germany | $2,919.3 | 3.0% | 65.9% |
| 🇨🇦 Canada | $2,253.3 | 2.3% | 106.4% |
| 🇧🇷 Brazil | $1,873.7 | 1.9% | 88.1% |
| 🇪🇸 Spain | $1,697.5 | 1.7% | 107.3% |
| 🇲🇽 Mexico | $954.6 | 1.0% | 52.7% |
| 🇰🇷 South Korea | $928.1 | 1.0% | 54.3% |
| 🇦🇺 Australia | $875.9 | 0.9% | 51.9% |
| 🇸🇬 Singapore | $835.0 | 0.9% | 167.9% |
| 🇧🇪 Belgium | $665.2 | 0.7% | 106.0% |
| 🇦🇷 Argentina | $556.5 | 0.6% | 89.5% |
| 🇮🇩 Indonesia | $552.8 | 0.6% | 39.0% |
| 🇳🇱 Netherlands | $540.9 | 0.6% | 49.5% |
| 🇵🇱 Poland | $419.4 | 0.4% | 49.8% |
| 🇬🇷 Greece | $407.2 | 0.4% | 168.0% |
| 🇹🇷 Türkiye | $397.2 | 0.4% | 34.4% |
| 🇷🇺 Russia | $394.8 | 0.4% | 21.2% |
| 🇦🇹 Austria | $393.6 | 0.4% | 74.8% |
| 🇪🇬 Egypt | $369.3 | 0.4% | 92.7% |
| 🇨🇭 Switzerland | $357.7 | 0.4% | 39.5% |
| 🇹🇭 Thailand | $314.5 | 0.3% | 61.4% |
| 🇮🇱 Israel | $303.6 | 0.3% | 58.2% |
| 🇵🇹 Portugal | $299.4 | 0.3% | 108.3% |
| 🇲🇾 Malaysia | $288.3 | 0.3% | 66.9% |
| 🇿🇦 South Africa | $280.7 | 0.3% | 73.7% |
| 🇵🇰 Pakistan | $260.9 | 0.3% | 76.6% |
| 🇸🇦 Saudi Arabia | $257.7 | 0.3% | 24.1% |
| 🇮🇪 Ireland | $251.7 | 0.3% | 42.7% |
| 🇵🇭 Philippines | $250.9 | 0.3% | 57.6% |
| 🇫🇮 Finland | $225.0 | 0.2% | 73.6% |
| 🇳🇴 Norway | $204.5 | 0.2% | 37.4% |
| 🇨🇴 Colombia | $200.1 | 0.2% | 55.0% |
| 🇹🇼 Taiwan | $200.0 | 0.2% | 26.6% |
| 🇸🇪 Sweden | $192.9 | 0.2% | 32.3% |
| 🇷🇴 Romania | $178.7 | 0.2% | 51.0% |
| 🇧🇩 Bangladesh | $175.9 | 0.2% | 39.4% |
| 🇺🇦 Ukraine | $152.8 | 0.2% | 88.1% |
| 🇨🇿 Czech Republic | $152.2 | 0.2% | 45.4% |
| 🇳🇬 Nigeria | $151.3 | 0.2% | 38.8% |
| 🇦🇪 UAE | $149.7 | 0.2% | 29.4% |
| 🇻🇳 Vietnam | $147.3 | 0.2% | 34.0% |
| 🇭🇺 Hungary | $140.0 | 0.1% | 68.7% |
| 🇨🇱 Chile | $132.2 | 0.1% | 38.4% |
| 🇩🇰 Denmark | $126.7 | 0.1% | 30.1% |
| 🇮🇶 Iraq | $125.5 | 0.1% | 49.2% |
| 🇩🇿 Algeria | $123.5 | 0.1% | 55.1% |
| 🇳🇿 New Zealand | $115.0 | 0.1% | 46.1% |
| 🇮🇷 Iran | $112.1 | 0.1% | 30.6% |
| 🇲🇦 Morocco | $102.7 | 0.1% | 69.7% |
| 🇶🇦 Qatar | $97.5 | 0.1% | 41.4% |
| 🇵🇪 Peru | $89.7 | 0.1% | 33.9% |
| 🇦🇴 Angola | $79.6 | 0.1% | 84.9% |
| 🇰🇪 Kenya | $79.1 | 0.1% | 70.2% |
| 🇸🇰 Slovakia | $75.4 | 0.1% | 56.7% |
| 🇩🇴 Dominican Republic | $72.1 | 0.1% | 59.8% |
| 🇪🇨 Ecuador | $65.9 | 0.1% | 55.5% |
| 🇸🇩 Sudan | $65.5 | 0.1% | 256.0% |
| 🇬🇭 Ghana | $65.1 | 0.1% | 84.9% |
| 🇰🇿 Kazakhstan | $60.7 | 0.1% | 23.4% |
| 🇪🇹 Ethiopia | $59.0 | 0.1% | 37.9% |
| 🇧🇭 Bahrain | $54.5 | 0.1% | 121.2% |
| 🇨🇷 Costa Rica | $53.9 | 0.1% | 63.0% |
| 🇭🇷 Croatia | $51.2 | 0.1% | 63.8% |
| 🇺🇾 Uruguay | $47.0 | 0.0% | 61.6% |
| 🇯🇴 Jordan | $46.9 | 0.0% | 93.8% |
| 🇸🇮 Slovenia | $46.8 | 0.0% | 68.5% |
| 🇨🇮 Côte d’Ivoire | $45.1 | 0.0% | 56.8% |
| 🇵🇦 Panama | $43.5 | 0.0% | 52.8% |
| 🇲🇲 Myanmar | $43.0 | 0.0% | 57.5% |
| 🇴🇲 Oman | $41.4 | 0.0% | 38.2% |
| 🇹🇳 Tunisia | $39.9 | 0.0% | 77.8% |
| 🇷🇸 Serbia | $38.5 | 0.0% | 51.3% |
| 🇧🇴 Bolivia | $37.8 | 0.0% | 80.8% |
| 🇹🇿 Tanzania | $35.8 | 0.0% | 42.6% |
| 🇺🇿 Uzbekistan | $31.7 | 0.0% | 35.1% |
| 🇿🇼 Zimbabwe | $30.9 | 0.0% | 95.4% |
| 🇧🇾 Belarus | $30.4 | 0.0% | 44.1% |
| 🇬🇹 Guatemala | $29.1 | 0.0% | 28.3% |
| 🇱🇹 Lithuania | $28.7 | 0.0% | 36.1% |
| 🇸🇻 El Salvador | $25.8 | 0.0% | 73.0% |
| 🇺🇬 Uganda | $25.3 | 0.0% | 48.3% |
| 🇸🇳 Senegal | $25.2 | 0.0% | 81.0% |
| 🇨🇾 Cyprus | $25.2 | 0.0% | 78.6% |
| 🇱🇺 Luxembourg | $24.6 | 0.0% | 27.6% |
| 🇭🇰 Hong Kong SAR | $23.5 | 0.0% | 6.1% |
| 🇧🇬 Bulgaria | $21.7 | 0.0% | 21.0% |
| 🇨🇲 Cameroon | $20.6 | 0.0% | 41.9% |
| 🇲🇿 Mozambique | $19.7 | 0.0% | 89.7% |
| 🇵🇷 Puerto Rico | $19.6 | 0.0% | 16.7% |
| 🇳🇵 Nepal | $19.3 | 0.0% | 46.7% |
| 🇱🇻 Latvia | $18.9 | 0.0% | 40.6% |
| 🇮🇸 Iceland | $18.7 | 0.0% | 61.2% |
| 🇵🇾 Paraguay | $18.1 | 0.0% | 40.9% |
| 🇱🇦 Lao P.D.R. | $17.3 | 0.0% | 121.7% |
| 🇭🇳 Honduras | $15.7 | 0.0% | 46.3% |
| 🇵🇬 Papua New Guinea | $15.7 | 0.0% | 49.5% |
| 🇹🇹 Trinidad and Tobago | $14.6 | 0.0% | 52.5% |
| 🇦🇱 Albania | $14.5 | 0.0% | 62.9% |
| 🇨🇬 Republic of Congo | $14.1 | 0.0% | 97.8% |
| 🇦🇿 Azerbaijan | $14.1 | 0.0% | 18.2% |
| 🇾🇪 Yemen | $14.0 | 0.0% | 66.4% |
| 🇯🇲 Jamaica | $13.6 | 0.0% | 72.3% |
| 🇲🇳 Mongolia | $13.1 | 0.0% | 69.9% |
| 🇧🇫 Burkina Faso | $12.7 | 0.0% | 61.2% |
| 🇬🇦 Gabon | $12.5 | 0.0% | 64.9% |
| 🇬🇪 Georgia | $11.9 | 0.0% | 39.6% |
| 🇲🇺 Mauritius | $11.8 | 0.0% | 79.7% |
| 🇦🇲 Armenia | $11.8 | 0.0% | 47.9% |
| 🇧🇸 Bahamas | $11.7 | 0.0% | 84.2% |
| 🇲🇱 Mali | $11.0 | 0.0% | 51.8% |
| 🇲🇹 Malta | $11.0 | 0.0% | 54.1% |
| 🇰🇭 Cambodia | $10.9 | 0.0% | 35.3% |
| 🇧🇯 Benin | $10.6 | 0.0% | 53.0% |
| 🇲🇼 Malawi | $10.4 | 0.0% | 78.6% |
| 🇪🇪 Estonia | $9.0 | 0.0% | 21.6% |
| 🇨🇩 Democratic Republic of Congo | $9.0 | 0.0% | 13.3% |
| 🇷🇼 Rwanda | $8.8 | 0.0% | 63.3% |
| 🇳🇦 Namibia | $8.5 | 0.0% | 67.6% |
| 🇲🇬 Madagascar | $8.5 | 0.0% | 54.0% |
| 🇳🇪 Niger | $8.3 | 0.0% | 48.7% |
| 🇲🇰 North Macedonia | $8.2 | 0.0% | 51.6% |
| 🇧🇦 Bosnia and Herzegovina | $7.7 | 0.0% | 28.6% |
| 🇲🇻 Maldives | $7.7 | 0.0% | 110.3% |
| 🇬🇳 Guinea | $7.3 | 0.0% | 31.6% |
| 🇳🇮 Nicaragua | $7.2 | 0.0% | 41.5% |
| 🇧🇧 Barbados | $7.2 | 0.0% | 115.0% |
| 🇹🇬 Togo | $6.1 | 0.0% | 67.2% |
| 🇰🇬 Kyrgyz Republic | $6.0 | 0.0% | 47.0% |
| 🇲🇩 Moldova | $5.6 | 0.0% | 35.1% |
| 🇹🇩 Chad | $5.4 | 0.0% | 43.2% |
| 🇰🇼 Kuwait | $5.4 | 0.0% | 3.4% |
| 🇲🇷 Mauritania | $5.1 | 0.0% | 49.5% |
| 🇭🇹 Haiti | $5.1 | 0.0% | 19.6% |
| 🇬🇾 Guyana | $4.9 | 0.0% | 29.9% |
| 🇲🇪 Montenegro | $4.6 | 0.0% | 65.8% |
| 🇫🇯 Fiji | $4.6 | 0.0% | 83.6% |
| 🇹🇲 Turkmenistan | $4.2 | 0.0% | 5.1% |
| 🇹🇯 Tajikistan | $4.0 | 0.0% | 33.5% |
| 🇧🇼 Botswana | $3.9 | 0.0% | 18.7% |
| 🇬🇶 Equatorial Guinea | $3.8 | 0.0% | 38.3% |
| 🇸🇷 Suriname | $3.8 | 0.0% | 107.0% |
| 🇸🇸 South Sudan | $3.8 | 0.0% | 60.4% |
| 🇧🇹 Bhutan | $3.3 | 0.0% | 123.4% |
| 🇦🇼 Aruba | $3.2 | 0.0% | 82.9% |
| 🇸🇱 Sierra Leone | $3.1 | 0.0% | 88.9% |
| 🇨🇻 Cabo Verde | $2.9 | 0.0% | 113.1% |
| 🇧🇮 Burundi | $2.3 | 0.0% | 72.7% |
| 🇱🇷 Liberia | $2.3 | 0.0% | 52.3% |
| 🇽🇰 Kosovo | $2.2 | 0.0% | 21.3% |
| 🇸🇿 Eswatini | $2.0 | 0.0% | 42.4% |
| 🇧🇿 Belize | $1.9 | 0.0% | 59.3% |
| 🇱🇨 Saint Lucia | $1.8 | 0.0% | 74.2% |
| 🇬🇲 Gambia | $1.7 | 0.0% | 72.3% |
| 🇩🇯 Djibouti | $1.6 | 0.0% | 41.8% |
| 🇦🇬 Antigua and Barbuda | $1.6 | 0.0% | 80.5% |
| 🇸🇲 San Marino | $1.5 | 0.0% | 74.0% |
| 🇬🇼 Guinea-Bissau | $1.5 | 0.0% | 73.9% |
| 🇱🇸 Lesotho | $1.5 | 0.0% | 61.3% |
| 🇦🇩 Andorra | $1.4 | 0.0% | 37.7% |
| 🇨🇫 Central African Republic | $1.4 | 0.0% | 50.1% |
| 🇸🇨 Seychelles | $1.3 | 0.0% | 60.8% |
| 🇻🇨 Saint Vincent and the Grenadines | $0.9 | 0.0% | 86.2% |
| 🇬🇩 Grenada | $0.8 | 0.0% | 60.2% |
| 🇩🇲 Dominica | $0.7 | 0.0% | 93.9% |
| 🇰🇳 Saint Kitts and Nevis | $0.6 | 0.0% | 53.2% |
| 🇻🇺 Vanuatu | $0.5 | 0.0% | 46.8% |
| 🇰🇲 Comoros | $0.5 | 0.0% | 33.3% |
| 🇸🇹 São Tomé and Príncipe | $0.4 | 0.0% | 58.5% |
| 🇸🇧 Solomon Islands | $0.4 | 0.0% | 22.2% |
| 🇧🇳 Brunei Darussalam | $0.3 | 0.0% | 2.3% |
| 🇼🇸 Samoa | $0.3 | 0.0% | 36.2% |
| 🇹🇱 Timor-Leste | $0.3 | 0.0% | 16.4% |
| 🇵🇼 Palau | $0.2 | 0.0% | 85.4% |
| 🇹🇴 Tonga | $0.2 | 0.0% | 41.1% |
| 🇫🇲 Micronesia | $0.1 | 0.0% | 12.5% |
| 🇲🇭 Marshall Islands | $0.1 | 0.0% | 18.1% |
| 🇳🇷 Nauru | <$0.1 | 0.0% | 29.1% |
| 🇰🇮 Kiribati | <$0.1 | 0.0% | 13.1% |
| 🇹🇻 Tuvalu | <$0.1 | 0.0% | 8.0% |
| 🇲🇴 Macao SAR | <$0.1 | 0.0% | 0.0% |
| 🌐 World | $97,129.8 | 100% | 93.0% |
With $33.2 trillion in government debt, the U.S. makes up over a third of the world total.
Given the increasing debt load, the cost of servicing this debt now accounts for 20% of government spending. It is projected to reach $1 trillion by 2028, surpassing the total spent on defense.
The world’s third-biggest economy, Japan, has one of the highest debt to GDP ratios, at 255%. Over the last two decades, its national debt has far exceeded 100% of its GDP, driven by an aging population and social security expenses.
In 2023, Egypt faces steep borrowing costs, with 40% of revenues going towards debt repayments. It has the highest debt on the continent.
Like Egypt, several emerging economies are facing strain. Lebanon has been in default since 2020, and Ghana defaulted on the majority of its external debt—debt owed to foreign lenders—in 2022 amid a deepening economic crisis.
Global Debt: A Regional Perspective
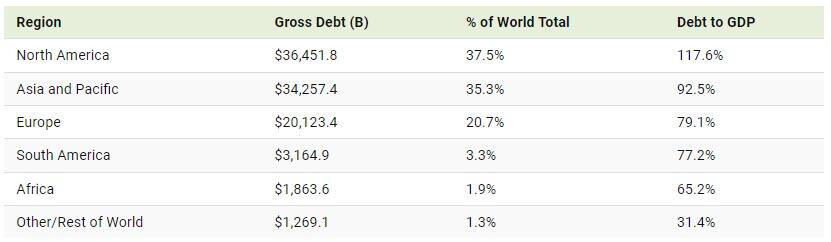
How does debt compare on a regional level in 2023?
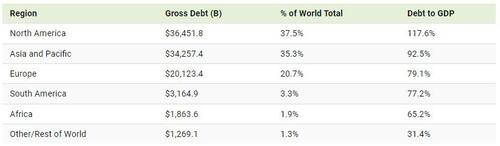
We can see that North America has both the highest debt and debt to GDP compared to other regions. Just as U.S. debt has ballooned, so has Canada’s—ranking as the 10th-highest globally in government debt outstanding.
Across Asia and the Pacific, debt levels hover close to North America.
At 3.3% of the global total, South America has $3.2 trillion in debt. As inflation has trended downwards, a handful of governments have already begun cutting interest rates. Overall, public debt levels are projected to stay elevated across the region.
Debt levels have also risen rapidly in Africa, with an average 40% of public debt held in foreign currencies—leaving it exposed to exchange rate fluctuations. Another challenge is that interest rates are also higher across the region compared to advanced economies, increasing debt-servicing costs.
By 2028, the IMF projects that global public debt will exceed 100% of GDP, hitting levels only seen during the pandemic.
https://www.zerohedge.com/markets/visualizing-97-trillion-global-debt-2023
 Everchem Updates Archive
  Sign Up for Email Updates