Current Affairs
October 4, 2021
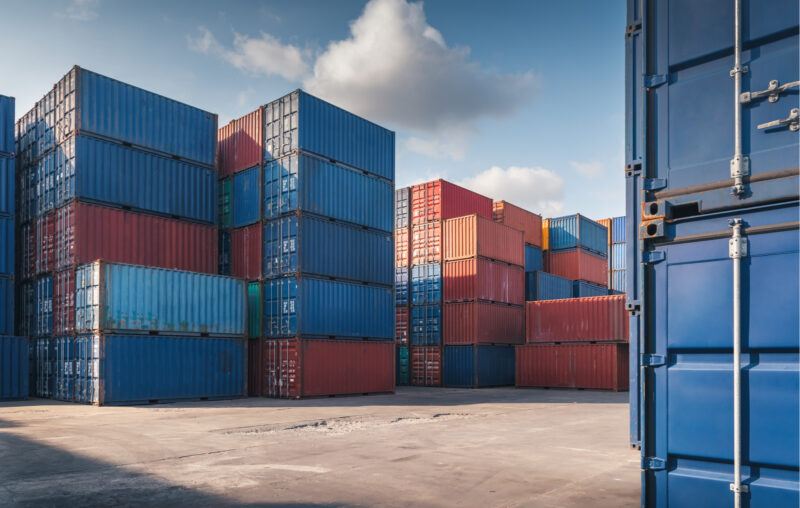
Shipping Discussion
An Armor Conspired: the Global Shipping Freeze
Peter C. Earle – October 2, 2021 Reading Time: 13 minutes
Despite numerous personal shortcomings, Jim Morrison of The Doors regularly evinced considerable writing talents. In the poem-song Horse Latitudes, he describes the conditions under which stalled galleons would, drifting listlessly at certain latitudes, jettison cargo so as to make their craft more susceptible to the slightest winds. The lyrics begin as follows:
When the still sea conspires an armor
And her sullen and aborted currents
Breed tiny monsters
True sailing is dead
Cargo vessels no longer raise sails or require wind to fill them, but doldrum-like conditions are rapidly manifesting near ports all over the world. Last week,
[s]ixty-one vessels were anchored offshore on Thursday [September 23rd] waiting to unload cargo as the Port of Los Angeles and the Port of Long Beach…In addition to the anchored ships, 29 were adrift up to 20 miles offshore, meaning they were so far from the coast that their anchors could not reach the ocean floor.
And in the east on Sunday, September 26th,
[The] Port of New York and New Jersey appears to be facing similar issues as West coast ports…Around 24 cargo ships and oil tankers [were] stuck waiting to dock off the coast of Long Island, New York…As of 9pm local time Saturday, the ships appeared to have been stuck in place for hours.
Explanations for the increasing delays include slow loading/unloading times, rising costs of shipping, and capital shortages. All of those explanations are correct but incomplete and insufficiently descriptive. To uncover the root causes and trace their evolution, we must go back to the very beginning.
Nominal Rigidities
First, the foundations. While bottlenecks are occurring everywhere, at present US ports are disproportionately affected. Docking locations along US coasts are among the slowest in the world: not because of size or technological capacity but collective bargaining hindrances. As Dominic Pino recently wrote,
Why are our ports so far behind? Not because we don’t spend enough on infrastructure, as the Biden administration would have you believe. The federal government could spend a quadrillion dollars on ports, and it wouldn’t change the contracts with the longshoreman unions that prevent ports from operating 24/7 (as they do in Asia) and send labor costs through the roof. (Lincicome finds that union dockworkers on the West Coast make an average of $171,000 a year plus free healthcare.) The unions also fight automation at American ports today, “just as they fought containerized shipping and computers decades before that.”
Before the public hysterics, lockdowns, and stay-at-home orders, and even before the first offloading was delayed, nominal rigidities had ossified US port operations and made them particularly vulnerable to even the slightest kinks in supply chains.
Where It Began
As is well documented by now, the effects of nonpharmaceutical interventions sent measures of economic activity plummeting throughout the second quarter of 2020. Unemployment skyrocketed to levels not seen since the Great Depression. The US government countered with stimulus payments via the CARES Act (March 2020), the Consolidated Appropriations Act (December 2020), and the American Rescue Plan (March 2021). Although state governors adopted independent pandemic postures, the spectrum of stringency ran a gambit from less to more binding as exemplified by Florida and North Dakota versus Hawaii and California.
The sudden strangulation of in-person commercial activity, coupled with weeks to months of veritable isolation at home, with trillions of dollars being mailed out led to a consumption binge. This was both well documented and empirically verifiable. Where in normal circumstances modern US consumers tend to purchase services more than goods, the circumstances arising of isolation at home for prolonged periods led to a decisive shift toward purchasing goods: electronics, furniture, exercise equipment, home improvement items, and so on.
US GDP (quarterly, chained 2012 dollars, 2019 – present)
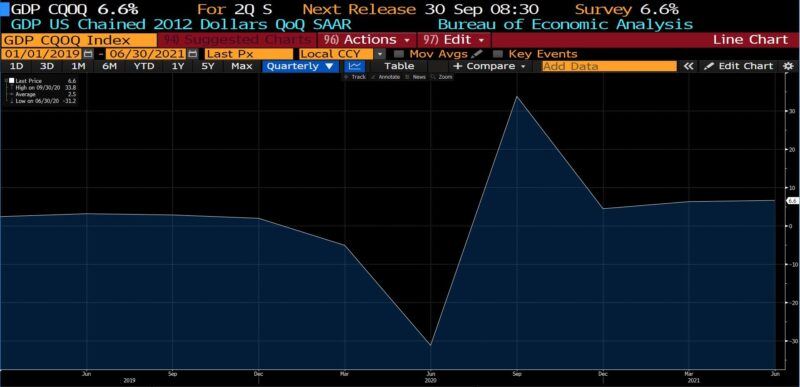
It is in the sudden, stimulus-fueled rise in demand falling upon decreasing supply where, in summer and fall of 2020, strains began to wend their way through shipping processes.
Intermodal Transport
Intermodal transport has its roots in the growth of trade in the 19th century, but like so much of what makes the modern world “tick,” it goes mostly unobserved and almost entirely unappreciated. The standardization of shipping containers in such a way that they can move from trucks to ships to aircraft, barges, and trains with a minimum of effort is a feat of technology and international coordination.
US Personal Consumption Expenditures, Chain Type Price Index (2016 – present)
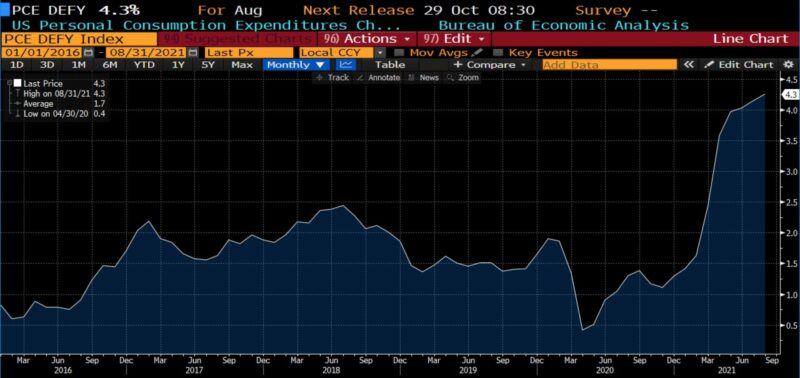
Throughout the fall of 2020 and winter of 2021, the US economy was expanding out of the artificial recession imposed in the spring and early summer of 2020. (It bears noting that even in the latter part of 2020 certain US states were still restricting movement, limiting gatherings, and fining employers.) This expansion of activity resulted in the first episodes witnessing a shortage of shipping containers in February 2021.
The Ever Given and the Suez
On Tuesday, March 23, 2021, the Ever Given–a 1,300 foot, 200,000 tonne container ship carrying over 18,000 containers–became lodged in the Suez Canal. (The canal has closed a handful of times.) The blockage is believed to have occurred when the combination of an uncommonly strong gust of wind and preoccupied guidance led to the fore of the ship running aground, wedging it across the canal at an angle.
In this one development, some 12% of global trade was held up for 6 days: just under $10B dollars worth of goods and over one million barrels of oil. When the ship was finally freed, shipping journal Lloyd’s List estimated that some 450 ships were waiting to traverse the canal.
The damage associated with the accident includes the numerous and uncountable cost of delays, the estimated reduction of annual global trade growth (0.2 to 0.4 percentage points), and the leap in the cost of chartering vessels to go around the Horn of Africa (47%). But also, the role that the Suez blockage played in making each of the subsequent transportation snags all the more severe.
Shipping Containers Dwindle
At this point, the combination of rising demand and slowing sea traffic began revealing itself in a paucity of available shipping containers.
Intermodal transport, which contemplates the use of standardized containers that readily transfer between air, sea, rail, and highway conveyance, is perhaps the most underappreciated factor in the globalized economy. Standard dimensions permit planning and maximizing capacity in advance, giving logisticians the ability to capitalize upon changes in the course of shipment. The ability to move a container from train to aircraft to ship results in efficient lading, which has contributed to lower costs and faster delivery times.
The global shipping container inventory tends toward a rough equilibrium state which takes into account surges in demand; the containers tend to last about 12 years, and are produced at a rate generally matching their retirement of some 6 to 8% per year. The greatest and most predictable surge of use occurs between September and December as retailers stock inventories in anticipation of the Thanksgiving to New Year’s surge in consumption.
But by the early spring of 2021, with containers filling rapidly in response to Covid-related demand (both lockdowns and reopenings) and additional stimulus payments, available containers and container space became scarcer. Dwindling supply, predictably, was signaled by worldwide container prices. There are markets for newly built shipping containers as well as exchanges where used containers can be acquired. Between early and late 2020, new shipping container prices rose from roughly $1,800 to $2,500 CEU; but roughly one month after the week-long Suez blockage the first of several spikes was witnessed.
The price for a new container is now $3,500 per cost equivalent unit (CEU, a measure of the value of a container as a multiple of a 20-foot dry cargo unit)…[while] recent price gains have been more extreme in the used container market. Container xChange reported that the price of used containers in China has nearly doubled from $1,299 per CEU in November [2020] to $2,521 in March [2021].
As to why production of new containers didn’t ramp up to meet surging demand, there are several perspectives. If the elevated demand was expected to be temporary, it’s possible that container firms didn’t see the point in increasing output. Another view holds that a rare opportunity to earn outsized profits in a normally staid business was capitalized upon by the producing firms.
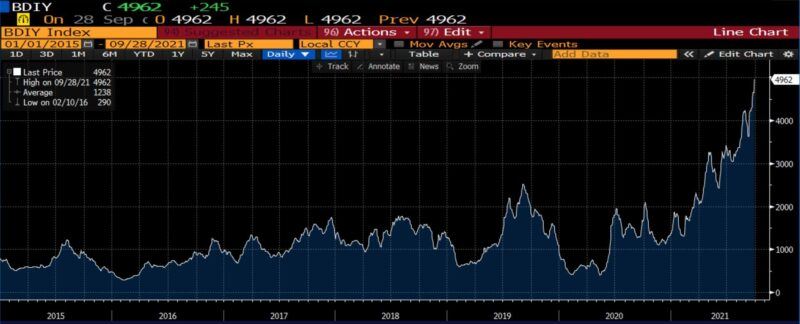
Baltic Dry Index (2015 – present)
Yantian Closes
In late May 2021 Yantian, a Chinese port about 50 miles north of Hong Kong shut owing to a number of Covid infections among dockworkers. Authorities halted operations for almost a week, which at a daily operating capacity of 30,000 20-foot containers per day, created a tremendous backlog. The ripple effect saw not only a pileup of unsent goods at that port, but the rerouting of Yantian-bound container ships to other ports straining capacity, creating further delays, and tying up more containers. By Thursday, June 17th,
[t]he congestion in Yantian ha[d] spilled over to other container ports in Guangdong, including Shekou, Chiwan, and Nansha…The domino effect is creating a huge problem for the world’s shipping industry…As of Thursday, more than 50 container vessels were waiting to dock in Guangdong’s Outer Pearl River Delta…[But] the snag in operations in Yantian alone is concerning [delaying] more than the total volume of freight impacted by the six-day closure of the Suez Canal in March.
The price associated with shipping goods spiked, with the cost of sending 40-foot containers from Shanghai to Rotterdam increasing over 500% to $11,000 or more. The breach of the $10,000 rate marked a turning point; and it was at this point that, en masse, major shipping companies began alerting their clients of substantial delays, rising costs associated with routing changes, and higher prices associated with acquiring containers. Firms dependent upon ocean shipping began to do something they had been unaccustomed to: considering, and in some cases seizing upon, the newly-developed cost savings associated with air and rail transport.
Containers and Ships Vanish
As container availability dissipated and warehouses near ports overflowed, some shipping firms chose to use the scant containers in their possession as makeshift storage space on docks and truck/rail terminals. And by June 2021,
Indian exporters to North America and Europe [were] complaining that the wait times to find a shipping container [could] stretch as long as three weeks. British exporters say the shortage [had] delayed shipments to east Asia for up to two months. And in the meantime, container prices…nearly doubled.
On June 14th, Home Depot supply chain managers
realized that it was time to charter its own vessel. “We have a ship that’s solely going to be ours and it’s just going to go back and forth…100% dedicated to Home Depot,” Chief Operating Officer Ted Decker said…The company [had] been reduced to bringing in items by air…as domestic demand surge[d].
Brokerage prices for short- and long-term charters began to surge. Whether awakened to this possibility by the Atlanta-based retailer or having arrived at the same conclusion independently, over the following weeks Walmart, Ikea, and scores of other large firms entered the private charter market.
Pallets Join Containers
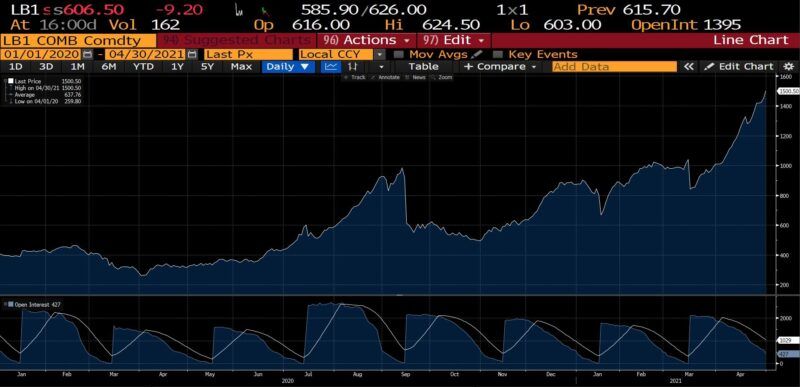
All this was soon accompanied with a new problem deriving from yet another pandemic policy side effect: a pallet deficiency. The price of lumber had, owing to the effect of stay-at-home orders on sawmills and home improvement projects owing to lockdowns, surged roughly five-fold between January 2020 and May 2021. (By one account, an estimated 46% of US hardwood lumber production goes toward pallets.)
Front-month lumber futures price (Jan 2020 – May 2021)
In fact, the international shipment of certain types of goods requires being seated upon pallets within shipping containers. Unbeknownst to materially all the world not familiar with the nuance of international trade, pallets are, just like the shipping containers they are regularly coupled with, nothing short of an integral cog:
Companies…have literally designed products around pallets…There is a whole science of “pallet cube optimization,” a kind of Tetris for packaging; and an associated engineering filled with analyses of “pallet overhang” (stacking cartons so they hang over the edge of the pallet, resulting in losses of carton strength) and efforts to reduce “pallet gaps” (too much spacing between deck boards). The “pallet loading problem,”–or the question of how to fit the most boxes onto a single pallet–is a common operations research thought exercise.
And as reported on ShipLilly, a shipping and logistics blog on June 9th, 2021,
The cost of raw lumber has doubled and sometimes nearly quadrupled. Lumber price increments have exponential impacts on the cost of manufacturing wood pallets. Manufacturers are passing on these costs by way of increased asking prices…If pallets are available, a buyer can expect to pay 400% more.
Hastily-improvised workarounds swing into action, including repairing old pallets, building new pallets from discarded lumber, new loading schemes, and employing alternative means of elevating cargo, including plastic or concrete. This incidentally, put the shipping industry in direct competition with agricultural interests, as transporting produce is also dependent upon pallet availability and prices.
Ningbo Closes
It is yet too early to call what occurred in mid-August 2021 the capstone event, but for now that appellation suffices.
With the detection of a single Covid infection among workers–a worker reported to be 34-years-old, fully vaccinated, and asymptomatic–a large portion of China’s massive Ningbo-Zhoushan Port closed for nearly two weeks. The impact of the partial shutdown of the third largest port in the world not only derailed the slow recovery from the Yantian cessation, but
stretched across the Pacific Ocean to Long Beach port in Los Angeles, where more than 30 ships were waiting to get into port to offload…elsewhere in Southeast Asia, anchored ships off Vietnam’s largest two ports rose to six above the median.
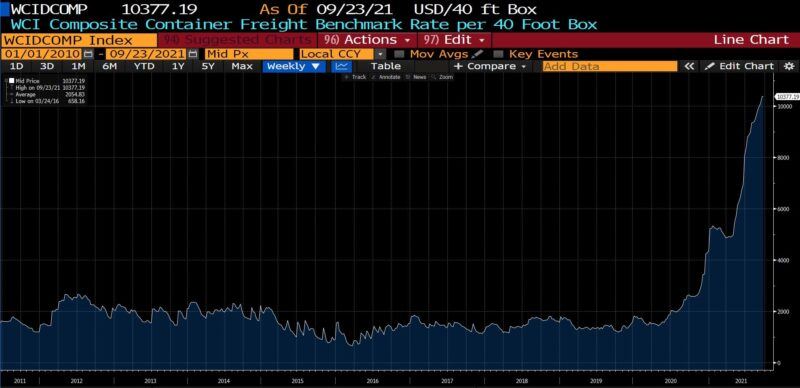
WCI Composite Container Freight Benchmark Rate (per 40-foot, 2010 – present)
Necessity being not only mother but father, sibling, master, and servant to invention, creative solutions poured forth from the private sector. Large and small firms began chartering smaller ships to fit into smaller, less congested ports. And many corporate logistical programs, including that of Peloton, began dividing shipments into optimized shipping categories among train, truck, air, and sea routes. And on the demand side, retailers began stockpiling: withholding goods from store shelves and online listings in anticipation of the coming holiday season. (Amazon’s decision to purchase 11 Boeing 767s earlier this year looks sagacious in retrospect.)
Early in the pandemic, it was noted that the impact of lockdowns would be proportionately more devastating for smaller firms. And as such, that consolidation and concentration–the frequent target of the very same left political thought that drove nonpharmaceutical interventions–were likely outcomes. And that is indeed the case arising of these secondary and tertiary effects.
[S]upply chain snags are likely to add dominance to big-box retailers while cutting out smaller companies that don’t have the extra funds to charter their own vessels or ship via cargo planes. “Whenever we have a constrained supply like this it’s always the big dogs that win,” Douglas Kent, executive vice president of strategy and alliances at the Association of Supply Chain Management [said]. “The smaller firms just don’t have the capital to keep up. They’re already in survival mode. They’re going to have to pass on these costs to customers and risk losing out to big-box retailers that can absorb these costs themselves. As a result we will likely see the shuttering of more companies due to these ongoing issues.”
Predictably, container carriers are seeing a windfall. The same 40-foot container which cost, at most, $2,000 to ship goods from Asia to the US will now cost $25,000 if the exporting firm has guaranteed (or the importing firm paid for) on-time delivery. In 2020, the shipping industry earned an estimated $15 billion in profit; this year, the number is likely to top $100 billion.
Ongoing Port Congestion
Throughout September 2021 ports all over the United States have been experiencing record ship delays. By September 11th, the logjam at the Los Angeles ports exceeded 50 ships carrying as much cargo as was previously seen in a month. After peaking at 73 ships on Sunday, September 19th, half a week later there were still 62 ships waiting to dock and offload. That’s up from an average of zero to one (on a particularly busy day), pre-Covid. And among them were craft and crew that had been waiting for as long as three weeks.
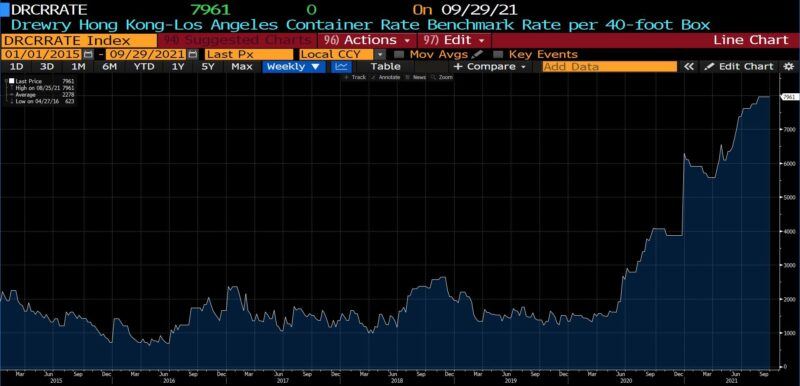
Drewry Hong Kong to Los Angeles Container Rate (40-foot, 2015 – present)
Yet even addressing the rigidities and stickiness discussed in an earlier section–maximum daily/weekly work hours and wages set by long-standing collective bargaining agreements–is mostly unhelpful, owing to the vast number of moving parts in the international supply chain.
[L]onger hours do little to address the backlog when truckers and warehouse operators have not similarly extended their hours. It’s not optimal for truckers to pick up their loads at night, especially when they’d have to find alternative places to store the goods [as] warehouses are not open at night.
Additionally, broader labor shortages arising from the payment of Federal unemployment bonuses have been impacting every link in the international logistical chain. “Many companies,” Business Insider reported, “have fewer workers [now] than before the pandemic started but face significantly more work due to the boom in demand for goods.”
The Armor Yet Conspires
As of last week the spot rate for container rates was up 731% over the average of the past five years. As shipping cancellations have risen amid rapid changes in logistical plans, some ocean shipping firms are now requiring full payment up front, adding yet another level of difficulty to an increasingly intractable state of affairs. Amid this, retailers are attempting to stock up for the end-of-year holidays. Predictions regarding a return to normalcy range from 2022 to as late as 2023. Companies including Nike have already warned that certain products are likely to be unavailable before the holiday season.
The effect of blow after blow to global trade on the availability of goods is most visible in the following graph.
Manufacturing and Trade Inventory/Sales Ratio (2015 – present)
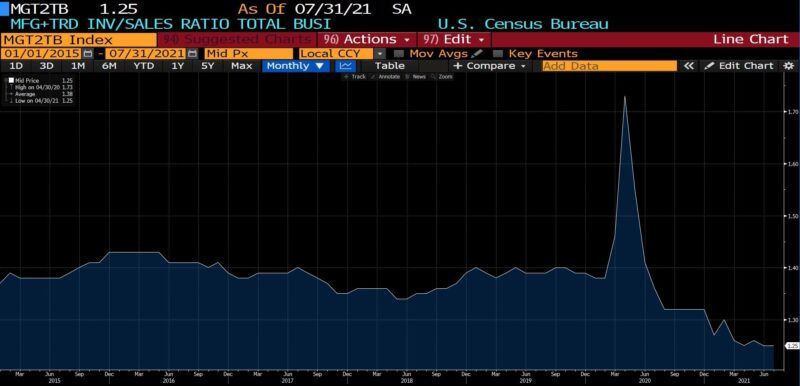
Three observations may be made: first, that for some years, the ratio of business inventories to sales in manufacturing, retail, and wholesale trade has been fairly steady. Second: when Covid initially struck, the ensuing policies resulted in the ratio of business inventories to sales rocketing to all-time highs. (Which is to say: goods piled high as consumption plummeted.) And finally, consumption soon soared as people at home began spending, fueled by boredom and stimulus payments. Businesses have reopened and many have kept up with demand, but the ongoing problems of shipping described heretofore have led the inventory-to-sales ratio dropping to all-time lows.
This week it was reported that the fourth largest port in the US, in Savannah, GA, 20 ships are now delayed. “Dwell times” – the time elapsing between containers arriving at the port and departing by truck or train – have increased from four to as long as twelve days. Globally, a host of other quandaries potentially lie ahead. Typhoons, a shortage of truck drivers in Europe, government responses to new outbreaks of Delta and subsequent Covid variants all threaten to worsen the shipping crisis from where it currently stands.
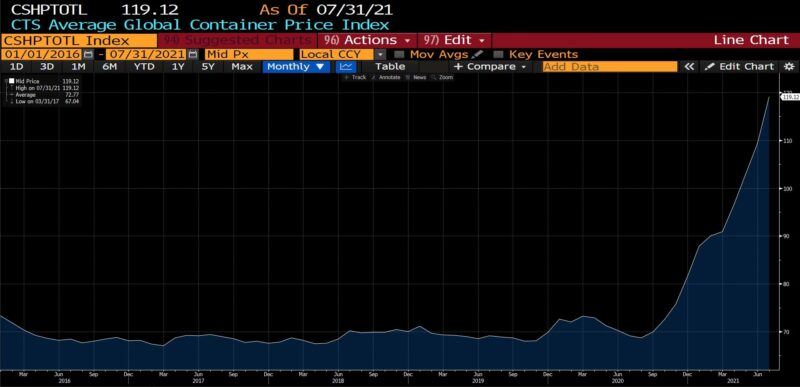
CTS Average Global Container Price Index (Jan 2016 – July 2021)
There is an unavoidable price for the ceaseless avalanche of goods and services falling around us: it is exposure to an arrant, inherent level of complexity. Only the coordination of a superabundant array of prices, timing, capacity, and information keeps the globally-integrated supply chain functioning. A single, small misstep or error increases the likelihood of subsequent problems at every juncture in the process. The “two weeks to flatten the curve” decision along with other shortsighted, unnecessary (and, as it turns out, ineffective) policy options has generated countless knock-on effects. Those now include shortages of shipping containers, long and increasing port delays, a growing scarcity of essential supply chain components, insufficient labor, higher prices, and a mounting undersupply of final goods. While it may prove hyperbolic, for the first time this week the description of a “global transport system collapse” was employed.
Science and engineering have brought about an era in which doldrums no longer vex modern day mariners. Owing to innovation and entrepreneurship, there are no longer horse latitudes where payloads are dumped overboard by desperate crews. Yet those conditions have reemerged, borne not of nature but of power, mindlessly exercised. The idea that an economy could be indiscriminately shut down and turned back on without far-reaching consequences, as if a light switch or lawn mower, is utterly damnable. It could only come from the mind of an individual, or body of individuals, with no understanding of or consideration for the extraordinary interdependence of the productive sector.
September 29, 2021
China Update
China economy to slow as industries struggle from power crunch
Author: Fanny Zhang
2021/09/29
SINGAPORE (ICIS)–China’s economic prospects are being weighed down by an ongoing power crunch in a huge swathe of the country, threatening overall industrial production, with much tighter controls on energy consumption in place in selected provinces in September.
Some investment banks have shaved their GDP growth forecast for the second-biggest economy below 8% as industries struggle from power shortage stemming from high coal prices, and efforts by some provinces to keep within their respective energy consumption targets in the third quarter.
Goldman Sachs now expects China to post a 7.8% GDP growth in 2021, down from its previous forecast of 8.2%.
The US investment bank cited “significant downside pressures” from major industrial output cuts caused by power outages, which affect an estimated 44% of the country’s industrial activity.
China-based investment bank China International Capital Corp (CICC) expects the GDP drag would be 0.1-0.15 percentage point in both the third and fourth quarters, with overall industrial output to be reduced by 1.3%-1.5%.
A prolonged production cut could shave China’s fourth-quarter GDP growth by a full percentage point, according to US-based investment bank Morgan Stanley.
Japan-based Nomura has likewise revised down its full-year GDP forecast for China to 7.7% from 8.2% previously, with third-quarter and fourth-quarter growths projected to come in at 4.7% and 3%, respectively.
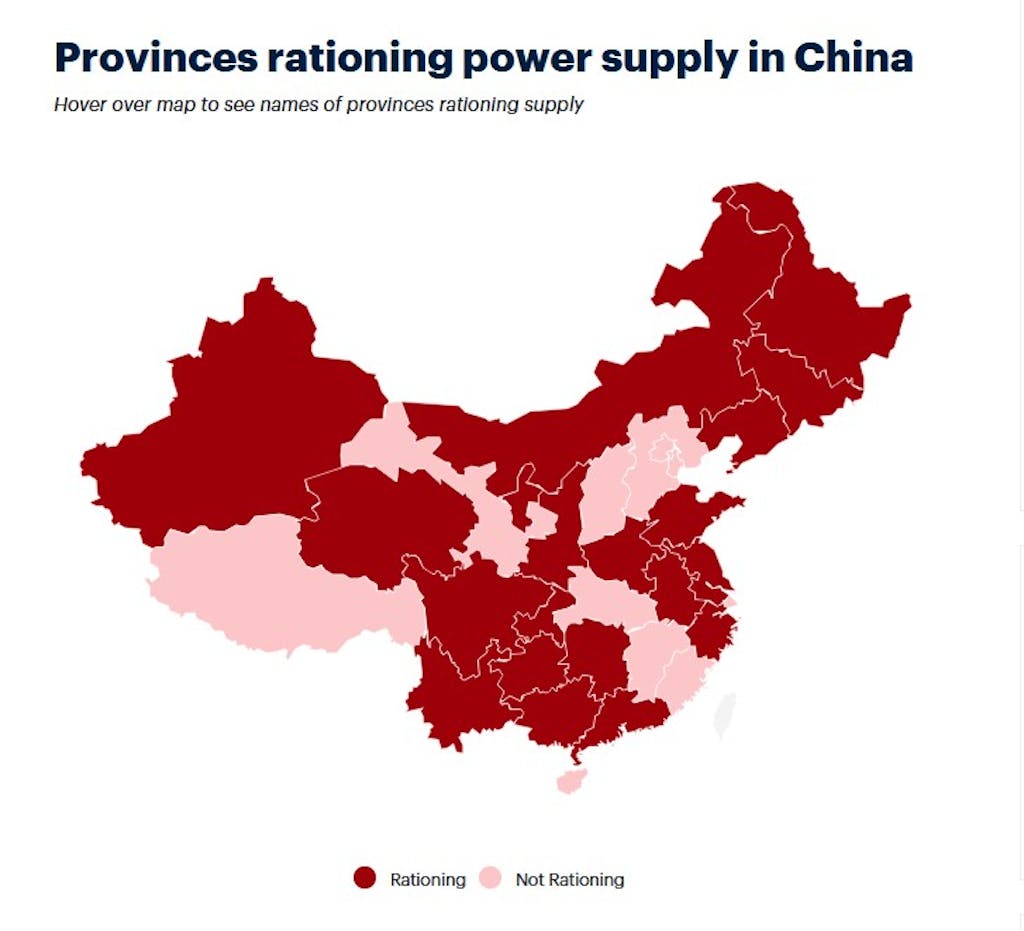
Power rationing is now in place at 20 of the 31 provinces/municipalities in mainland China, with coal-based power plants running at reduced rates to stem losses arising from high feedstock costs. https://e.infogram.com/5e89a67b-46d1-4592-9a81-1604a5610c85?parent_url=https%3A%2F%2Fwww.icis.com%2Fexplore%2Fresources%2Fnews%2F2021%2F09%2F29%2F10689696%2Fchina-economy-to-slow-as-industries-struggle-from-power-crunch&src=embed#async_embed
China has been leading the global economic rebound from a pandemic-driven slump in 2020, having successfully contained COVID-19 infections much earlier than the rest of the world.
Its industries have been working double time to accommodate increased export orders, thereby causing unprecedented spikes in energy consumption.
But the country also has a commitment to reduce carbon emissions, with specific annual targets on energy consumption set for each province, in line with the goal of achieving net-zero emissions by 2060, based on China’s 14th Five-Year Plan.
In September, some provinces well in excess of the limits on total energy consumption as well as intensity (consumption per GDP) in the first half of 2021 have moved to rectify the issue, aggravating the effects of the power shortage and hitting downstream industries hard.
Factories are being forced to cut production or shut operations, and in some regions, office buildings, shopping centres and even residential homes are affected.
Power companies are losing money from high cost of coal, said freelance economist Guan Qingyou.
Spot prices of coal – which accounts for 70% of China’s total power generation – nearly quadrupled from 2020 levels to $180/tonne, in line with strong gains in global commodity prices this year.
China’s energy challenges may not be resolved in the short term, Guan said.
Industrial production in China has weakened for five straight months, with the August official purchasing managers index (PMI) reading of 50.1 barely above the threshold for expansion.
Another concern looming in the background for the Chinese economy is the debt-saddled giant property developer Evergrande.
The company, which is China’s second-bigger property developer, has accumulated $305bn in debt, which was about 2% of China’s GDP.
Analysts said that Evergrande’s collapse is threatening stability of the Chinese property market, as well as financial system.
Focus article by Fanny Zhang
September 29, 2021
China Update
China economy to slow as industries struggle from power crunch
Author: Fanny Zhang
2021/09/29
SINGAPORE (ICIS)–China’s economic prospects are being weighed down by an ongoing power crunch in a huge swathe of the country, threatening overall industrial production, with much tighter controls on energy consumption in place in selected provinces in September.
Some investment banks have shaved their GDP growth forecast for the second-biggest economy below 8% as industries struggle from power shortage stemming from high coal prices, and efforts by some provinces to keep within their respective energy consumption targets in the third quarter.
Goldman Sachs now expects China to post a 7.8% GDP growth in 2021, down from its previous forecast of 8.2%.
The US investment bank cited “significant downside pressures” from major industrial output cuts caused by power outages, which affect an estimated 44% of the country’s industrial activity.
China-based investment bank China International Capital Corp (CICC) expects the GDP drag would be 0.1-0.15 percentage point in both the third and fourth quarters, with overall industrial output to be reduced by 1.3%-1.5%.
A prolonged production cut could shave China’s fourth-quarter GDP growth by a full percentage point, according to US-based investment bank Morgan Stanley.
Japan-based Nomura has likewise revised down its full-year GDP forecast for China to 7.7% from 8.2% previously, with third-quarter and fourth-quarter growths projected to come in at 4.7% and 3%, respectively.
Power rationing is now in place at 20 of the 31 provinces/municipalities in mainland China, with coal-based power plants running at reduced rates to stem losses arising from high feedstock costs. https://e.infogram.com/5e89a67b-46d1-4592-9a81-1604a5610c85?parent_url=https%3A%2F%2Fwww.icis.com%2Fexplore%2Fresources%2Fnews%2F2021%2F09%2F29%2F10689696%2Fchina-economy-to-slow-as-industries-struggle-from-power-crunch&src=embed#async_embed
China has been leading the global economic rebound from a pandemic-driven slump in 2020, having successfully contained COVID-19 infections much earlier than the rest of the world.
Its industries have been working double time to accommodate increased export orders, thereby causing unprecedented spikes in energy consumption.
But the country also has a commitment to reduce carbon emissions, with specific annual targets on energy consumption set for each province, in line with the goal of achieving net-zero emissions by 2060, based on China’s 14th Five-Year Plan.
In September, some provinces well in excess of the limits on total energy consumption as well as intensity (consumption per GDP) in the first half of 2021 have moved to rectify the issue, aggravating the effects of the power shortage and hitting downstream industries hard.
Factories are being forced to cut production or shut operations, and in some regions, office buildings, shopping centres and even residential homes are affected.
Power companies are losing money from high cost of coal, said freelance economist Guan Qingyou.
Spot prices of coal – which accounts for 70% of China’s total power generation – nearly quadrupled from 2020 levels to $180/tonne, in line with strong gains in global commodity prices this year.
China’s energy challenges may not be resolved in the short term, Guan said.
Industrial production in China has weakened for five straight months, with the August official purchasing managers index (PMI) reading of 50.1 barely above the threshold for expansion.
Another concern looming in the background for the Chinese economy is the debt-saddled giant property developer Evergrande.
The company, which is China’s second-bigger property developer, has accumulated $305bn in debt, which was about 2% of China’s GDP.
Analysts said that Evergrande’s collapse is threatening stability of the Chinese property market, as well as financial system.
Focus article by Fanny Zhang
September 28, 2021
Railcar Primer
Why Is The Number Of Railcars In Storage Important?
by Tyler DurdenTuesday, Sep 28, 2021 – 02:10 PM
By Joanna Marsh of FreightWaves,
Rail equipment manufacturers, suppliers and industry observers will talk about the number of railcars in storage being up or down. But why is that figure important?
Knowing how many railcars are in storage is significant because that figure helps observers understand network capacity in relation to the broader economy. Industry participants also look at the number of railcars in storage by railcar type to gauge expectations for where railcar lease rates are heading and the volume of orders that manufacturers will receive for newly built railcars.
A number of organizations, such as the advocacy group Railway Supply Institute and the data firm Commtrex, keep track of how many railcars are in storage, including what type of railcar as different railcars can haul different commodities. The kinds of railcars that may be stored can range from pool fleets and auto racks to coal cars and tank cars.
One reason why there are so many railcars in storage is that railcars are very specific to the type of freight being moved. There are often shortages of some railcar types and surpluses of other railcar types at the same time.
For instance, if more grain needs to be shipped domestically and for export, then more hopper cars will be needed to move that grain. If there is less grain to be shipped, then railcar owners may store some of those hopper cars temporarily.
Sometimes a commodity will see volumes facing a systemic decline and that will be reflected in the type of railcars in storage. Sand used in the natural gas fracking process was transported in small cube covered hoppers. But when companies began using local sand instead of shipping sand via rail, that lessened the number of small cube covered hoppers on the rail network — and increased the number of those railcars in storage.
Also, when natural gas began to displace coal as the primary feedstock to generate electricity, coal volumes fell, sending coal cars into storage.
“As demand goes down, some of those cars go into storage and that drives the number of cars in storage,” said Lee Verhey, director of regulatory and industry affairs for the Railway Supply Institute.
The broader economy can influence how many railcars are in storage. When the COVID-19 pandemic first hit in the spring of 2020, manufacturing rates and in-store consumer activity took a nosedive amid social distancing measures. As a result, U.S. rail volumes sank in April and May 2020. Because there was less rail traffic, more railcars went into storage.
“The market really drives the availability of cars,” Verhey said.
“As demand [to haul certain commodities] goes down, some of those cars go into storage and that drives the number of cars in storage.”
The number of railcars in storage was as high as more than 525,000 cars in July and August 2020, a manager with railcar manufacturer Greenbrier said recently. That number has been steadily declining over the last 14 months to below 400,000, which is more in line with normal levels.
“As the economy starts to gain momentum and we start to see manufacturing starting to increase and supply starting to be more available, then you have greater demand for cars,” Verhey said.
A portion of the railcars in storage are older and less efficient than newer railcars because they have lower payload-to-weight ratios. Therefore, some of the railcars in storage may never come back into service.
Railcar leasing companies own roughly 70% of the U.S. fleet, while freight railroads own about 30%. A customer, such as a chemical company, will need railcars to move product, and that customer will get quotes from the railcar lessors for rates. The leases may be short term or long term.
Meanwhile, the railroads tend to own boxcars or railcars to haul grain or agricultural products. The company TTX is a joint venture owned by the railroads that serves as a railcar pool. But the railroads don’t own tank cars, which have their own special regulations for handling.
Lastly, a handful of companies will own their railcars, such as Exxon Mobil, Shell and ConocoPhillips. The decision to own railcars depends on the company’s financial strategy, according to Verhey. Some may lease cars because they don’t want to invest in the cars, but some might find it financially advantageous to own their railcars if they serve a niche market.
https://www.zerohedge.com/economics/why-number-railcars-storage-important