Current Affairs
September 6, 2022
Used Cars
“Sell My Car” Search Trends Explode 222% To All Time High In September
by Tyler DurdenTuesday, Sep 06, 2022 – 03:05 PM
It looks as though the spike in used car prices that we endured through 2021, and that continued as a result of the devastating inflation we have had so far in 2022, may finally be coming to an unceremonious end.
That’s because search trends for the terms “sell my car” have exploded higher leading into September 2022, a new study from findthebestcarprice.com found this week.
The site performed an analysis of Google search data and found that “searches for ‘sell my car’ exploded to over three times the average volume in September, an unprecedented increase in people searching for ‘sell my car’”,
The terms ‘how to sell my car’ and ‘sell car’ also spiked higher, by 145% and 104%, respectively.

Between August 25 and September 1, searches for ‘sell my car’ rose by 177%, the report said. They rose another 15% on September 4 after the the U.S. Labor Department announced that the unemployment rate has risen from 3.5% to 3.7%, the study says.
“The U.S. has already dealt with rising bills over the past few months due to inflation and the soaring costs of gas,” a spokesperson for the site said.
“Now, as experts such as Stephen Roach are predicting that a recession is looming, consumers are having to make cutbacks in order to save money. Google Trends data reveals that more households are looking to sell their car to bring in some extra income. We will likely see this trend continue if the cost of living remains high and the U.S. continues negative growth into the fall.”
The top 10 states with the most search data on selling cars were:
- Michigan
- Arizona
- California
- Nevada
- South Carolina
- Oklahoma
- Florida
- Ohio
- Texas
- Colorado
We noted just days ago that used car pricing had plunged to a one year low.
The latest Manheim Used Vehicle Value Index that tracks what dealers pay for used cars at auction is at a one-year low of 211.6. https://platform.twitter.com/embed/Tweet.html?dnt=false&embedId=twitter-widget-0&features=eyJ0ZndfdGltZWxpbmVfbGlzdCI6eyJidWNrZXQiOlsibGlua3RyLmVlIiwidHIuZWUiXSwidmVyc2lvbiI6bnVsbH0sInRmd19ob3Jpem9uX3RpbWVsaW5lXzEyMDM0Ijp7ImJ1Y2tldCI6InRyZWF0bWVudCIsInZlcnNpb24iOm51bGx9LCJ0ZndfdHdlZXRfZWRpdF9iYWNrZW5kIjp7ImJ1Y2tldCI6Im9uIiwidmVyc2lvbiI6bnVsbH0sInRmd19yZWZzcmNfc2Vzc2lvbiI6eyJidWNrZXQiOiJvbiIsInZlcnNpb24iOm51bGx9LCJ0ZndfY2hpbl9waWxsc18xNDc0MSI6eyJidWNrZXQiOiJjb2xvcl9pY29ucyIsInZlcnNpb24iOm51bGx9LCJ0ZndfdHdlZXRfcmVzdWx0X21pZ3JhdGlvbl8xMzk3OSI6eyJidWNrZXQiOiJ0d2VldF9yZXN1bHQiLCJ2ZXJzaW9uIjpudWxsfSwidGZ3X3NlbnNpdGl2ZV9tZWRpYV9pbnRlcnN0aXRpYWxfMTM5NjMiOnsiYnVja2V0IjoiaW50ZXJzdGl0aWFsIiwidmVyc2lvbiI6bnVsbH0sInRmd19leHBlcmltZW50c19jb29raWVfZXhwaXJhdGlvbiI6eyJidWNrZXQiOjEyMDk2MDAsInZlcnNpb24iOm51bGx9LCJ0ZndfZHVwbGljYXRlX3NjcmliZXNfdG9fc2V0dGluZ3MiOnsiYnVja2V0Ijoib24iLCJ2ZXJzaW9uIjpudWxsfSwidGZ3X3R3ZWV0X2VkaXRfZnJvbnRlbmQiOnsiYnVja2V0Ijoib2ZmIiwidmVyc2lvbiI6bnVsbH19&frame=false&hideCard=false&hideThread=false&id=1564602105201152003&lang=en&origin=https%3A%2F%2Fwww.zerohedge.com%2Fmarkets%2Fsell-my-car-search-trends-explode-222-all-time-high-september&sessionId=1adbc83d97c59092b029e0f3743cc6c48df8b2c0&siteScreenName=zerohedge&theme=light&widgetsVersion=1bfeb5c3714e8%3A1661975971032&width=550px
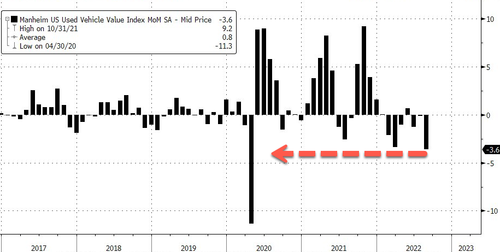
The index declined 3.6% from July in the first 15 days of August but is still up 8.8% from August 2021. The monthly slump was the most significant drop since April 2020.
Cox Automotive analysts said sliding wholesale used-vehicle values should continue through August. SUVs and pickups saw the most declines in value at auctions while minivans fell less — likely a function of thin supply, according to analysts. They said compact cars saw auction prices stable, noting it was likely due to more demand because elevated fuel costs have pushed consumers to more efficient vehicles.
A metric called “days of inventory” – how long it would take dealers to sell out of cars at the current sales rate if they couldn’t acquire new stock – was eight days higher than a year ago as the nationwide supply of used vehicles (as of Aug. 15) was improving.
Cox analysts noted consumers’ views of buying conditions for vehicles declined in August due to elevated prices and soaring rising interest rates. They said the only prior time consumers felt this pessimistic about purchasing a car was when auto loan interest rates were sky high in the early 1980s.
https://www.zerohedge.com/markets/sell-my-car-search-trends-explode-222-all-time-high-september
September 6, 2022
Used Cars
“Sell My Car” Search Trends Explode 222% To All Time High In September
by Tyler DurdenTuesday, Sep 06, 2022 – 03:05 PM
It looks as though the spike in used car prices that we endured through 2021, and that continued as a result of the devastating inflation we have had so far in 2022, may finally be coming to an unceremonious end.
That’s because search trends for the terms “sell my car” have exploded higher leading into September 2022, a new study from findthebestcarprice.com found this week.
The site performed an analysis of Google search data and found that “searches for ‘sell my car’ exploded to over three times the average volume in September, an unprecedented increase in people searching for ‘sell my car’”,
The terms ‘how to sell my car’ and ‘sell car’ also spiked higher, by 145% and 104%, respectively.
Between August 25 and September 1, searches for ‘sell my car’ rose by 177%, the report said. They rose another 15% on September 4 after the the U.S. Labor Department announced that the unemployment rate has risen from 3.5% to 3.7%, the study says.
“The U.S. has already dealt with rising bills over the past few months due to inflation and the soaring costs of gas,” a spokesperson for the site said.
“Now, as experts such as Stephen Roach are predicting that a recession is looming, consumers are having to make cutbacks in order to save money. Google Trends data reveals that more households are looking to sell their car to bring in some extra income. We will likely see this trend continue if the cost of living remains high and the U.S. continues negative growth into the fall.”
The top 10 states with the most search data on selling cars were:
- Michigan
- Arizona
- California
- Nevada
- South Carolina
- Oklahoma
- Florida
- Ohio
- Texas
- Colorado
We noted just days ago that used car pricing had plunged to a one year low.
The latest Manheim Used Vehicle Value Index that tracks what dealers pay for used cars at auction is at a one-year low of 211.6. https://platform.twitter.com/embed/Tweet.html?dnt=false&embedId=twitter-widget-0&features=eyJ0ZndfdGltZWxpbmVfbGlzdCI6eyJidWNrZXQiOlsibGlua3RyLmVlIiwidHIuZWUiXSwidmVyc2lvbiI6bnVsbH0sInRmd19ob3Jpem9uX3RpbWVsaW5lXzEyMDM0Ijp7ImJ1Y2tldCI6InRyZWF0bWVudCIsInZlcnNpb24iOm51bGx9LCJ0ZndfdHdlZXRfZWRpdF9iYWNrZW5kIjp7ImJ1Y2tldCI6Im9uIiwidmVyc2lvbiI6bnVsbH0sInRmd19yZWZzcmNfc2Vzc2lvbiI6eyJidWNrZXQiOiJvbiIsInZlcnNpb24iOm51bGx9LCJ0ZndfY2hpbl9waWxsc18xNDc0MSI6eyJidWNrZXQiOiJjb2xvcl9pY29ucyIsInZlcnNpb24iOm51bGx9LCJ0ZndfdHdlZXRfcmVzdWx0X21pZ3JhdGlvbl8xMzk3OSI6eyJidWNrZXQiOiJ0d2VldF9yZXN1bHQiLCJ2ZXJzaW9uIjpudWxsfSwidGZ3X3NlbnNpdGl2ZV9tZWRpYV9pbnRlcnN0aXRpYWxfMTM5NjMiOnsiYnVja2V0IjoiaW50ZXJzdGl0aWFsIiwidmVyc2lvbiI6bnVsbH0sInRmd19leHBlcmltZW50c19jb29raWVfZXhwaXJhdGlvbiI6eyJidWNrZXQiOjEyMDk2MDAsInZlcnNpb24iOm51bGx9LCJ0ZndfZHVwbGljYXRlX3NjcmliZXNfdG9fc2V0dGluZ3MiOnsiYnVja2V0Ijoib24iLCJ2ZXJzaW9uIjpudWxsfSwidGZ3X3R3ZWV0X2VkaXRfZnJvbnRlbmQiOnsiYnVja2V0Ijoib2ZmIiwidmVyc2lvbiI6bnVsbH19&frame=false&hideCard=false&hideThread=false&id=1564602105201152003&lang=en&origin=https%3A%2F%2Fwww.zerohedge.com%2Fmarkets%2Fsell-my-car-search-trends-explode-222-all-time-high-september&sessionId=1adbc83d97c59092b029e0f3743cc6c48df8b2c0&siteScreenName=zerohedge&theme=light&widgetsVersion=1bfeb5c3714e8%3A1661975971032&width=550px
The index declined 3.6% from July in the first 15 days of August but is still up 8.8% from August 2021. The monthly slump was the most significant drop since April 2020.
Cox Automotive analysts said sliding wholesale used-vehicle values should continue through August. SUVs and pickups saw the most declines in value at auctions while minivans fell less — likely a function of thin supply, according to analysts. They said compact cars saw auction prices stable, noting it was likely due to more demand because elevated fuel costs have pushed consumers to more efficient vehicles.
A metric called “days of inventory” – how long it would take dealers to sell out of cars at the current sales rate if they couldn’t acquire new stock – was eight days higher than a year ago as the nationwide supply of used vehicles (as of Aug. 15) was improving.
Cox analysts noted consumers’ views of buying conditions for vehicles declined in August due to elevated prices and soaring rising interest rates. They said the only prior time consumers felt this pessimistic about purchasing a car was when auto loan interest rates were sky high in the early 1980s.
https://www.zerohedge.com/markets/sell-my-car-search-trends-explode-222-all-time-high-september
September 1, 2022
Changing Truckload Dynamics
Shippers’ revenge is coming for truckload carriers
Craig Fuller, CEO at FreightWaves Follow on Twitter Wednesday, August 31, 2022 7 minutes read

Listen to this article 0:00 / 10:24 BeyondWords
The freight market is a pendulum — and when it swings, it may be the buyers or sellers of capacity that now have the power in rate negotiations. Ever since the summer of 2020, trucking companies have largely held all of the power in rate negotiations, based on their ability to squeeze their shipper customers for rate premiums.
If the trucking firms didn’t get a rate increase in a contract rate negotiation, they would simply move the capacity to the spot market to exploit market conditions and much higher spot rates. And whether these negotiations are made through direct confrontation or in a passive- aggressive manner through tender rejections, the outcome is largely the same.

Along the way, carrier executives convinced themselves that the freight market was “different this time” and their ability to have pricing power would remain in place indefinitely.
In the world of trucking, the market has two parties — a buyer and seller. While a buyer of capacity can be a broker that plays the role of both the buyer and seller, in every trucking transaction, you have a carrier (seller) and shipper (buyer) of capacity.
Over the past two years, not all trucking companies exploited market conditions; many of the more seasoned players understood that the pricing power pendulum was temporary and would eventually revert back to give power to the shippers.
But, for those carriers that did exploit market conditions for their favor, get ready for “shippers’ revenge.”

The freight market pendulum
Trucking companies gain all of their pricing power when capacity in a market is tight. If there is more freight demand than capacity to service loads offered, trucking companies are able to leverage this for freight rate concessions. Often, it works.
Last year, shippers faced unprecedented challenges trying to move massive volumes of cargo through their supply chains, disruptions due to raw material and component shortages, runaway inflation, and labor shortages. At the same time, everyone living through COVID has experienced an enormous amount of personal pressure and home-life challenges.
Trucking executives have also faced many of their own challenges and would be rightfully cynical about the plight of a supply chain executive who wasn’t able to empathize with their challenges.
But people that control supply chains are humans. They have egos and frustrations like everyone else. CFOs at shipper organizations have been putting pressure on supply chain executives to tackle inflationary cost acceleration throughout their operations.
And if the past few months have been any indication, the market pendulum has quickly shifted back in favor of the shippers.
This is most obvious in truckload spot rates, which have collapsed since the start of the year. The National Truckload Index, available on SONAR, which tracks U.S. truckload spot rates on a daily basis, is reporting that the current spot rate for a truckload is down from $3.57/mile at the start of the year to $2.67/mile — a 25% reduction. Remove the price of diesel from the rate and the drop is even more dramatic, dropping from $2.99/mile to $1.89/mile — or a 37% reduction.

Spot rates are far more responsive to market conditions than contract rates, but following the Waterfall Theory of Freight and how tender rejection rates provide a reliable barometer for truckload capacity, we know that capacity is rapidly loosening and carriers are being less selective in which contracted loads they will accept.
SONAR’s outbound tender rejection index is now down to 5.43%, a new cycle low. Tender rejections haven’t been this low since May 24, 2020, in the earliest days of the COVID economy. Normally, when tender rejections drop, contract rates follow.

However, in this cycle, contract rates have dropped much more slowly than spot rates or tender rejections would suggest.
SONAR’s van contract rate index, which is derived as the national average contract rate from over $40 billion of actual contracted loads between shippers and carriers, is currently at $2.74/mile, down from a high of $2.98/mile set on June 3, 2022. The drop of $0.24/mile represents a 9% drop in two months — and reverses all of the contracted rate increases that carriers gained in the first half of 2022.

Shippers took a “wait and see” approach to contract rates, but that is over
Shippers were initially reluctant to renegotiate contract rates out of fear that they would lose capacity in the event of a capacity crunch. There was plenty of news for shippers to worry about and some analysts and market commentators warned that the drop in freight volume was either a temporary blip or a misreading of data.
Warnings about port strikes, rail strikes, labor shortages and a potential “tsunami of containers” as China reopened made every supply chain executive nervous about losing capacity. After all, not having capacity is far worse than paying more for it. Moreover, carriers reminded shippers that a pull-back in their commitments or rates would mean that carriers would reject any load tenders from that shipper.
But none of the warnings actually played out.
The railroads got back to work and settled their disputes, the West Coast ports have continued to operate unabated, and container imports bound for the U.S. actually dropped once China reopened. Furthermore, the U.S. goods economy also pulled back as consumers slowed their consumption of goods after facing record inflation and a post-COVID shift toward services.

The Federal Reserve, hell-bent on taming inflation that it largely caused, has focused almost singularly on smothering demand in an effort to control out-of-hand price hikes. There is no market that has felt the pain more than consumer discretionary purchases, which have an outsized role in driving the U.S. trucking economy.
Basically, for all of the warnings of rough waters ahead, supply chain professionals are navigating increasingly stable conditions. The storm had passed — and that fact has become glaringly apparent.
In fact, hope for a fourth quarter peak surge seems very unlikely, if you believe that import volume data is a reliable indicator of future truckload demand.
The Daily Watch, a morning email that is sent by FreightWaves to all current SONAR subscribers, reported that the ports of Los Angeles/Long Beach are seeing the lowest weekly maritime import shipments since 2020. The note states:
“Using SONAR’s WCSTM tickers, we monitor U.S. maritime imports coming into a trucking market for a given week. By this measure, the Los Angeles trucking market (WCSTM.LAX — measures all U.S. ports within that trucking market — in this case, including Los Angeles and Long Beach) saw the lowest weekly total for maritime import shipments since June 2020. While Los Angeles and Long Beach (LAX/LGB) have both kept a steady stream of import volumes through the first seven months of 2022, the weakness in aggregate U.S. import demand is finally beginning to materialize at these ports as well. Other U.S. West Coast ports such as Oakland and the Northwest Seaport Alliance (Seattle/Tacoma) have been posting significant year-over-year (y/y) declines in maritime import volumes for the past two months. Now, LAX/LGB will be joining the downward trend in significant y/y declines. This does not bode well for surface-side transportation markets, in which the ports of LAX/LGB feed a massive amount of demand from U.S. imports from overseas. July 2022 was likely the last month that the Port of Los Angeles will publish any y/y gains in loaded imports for the foreseeable future.”

Shippers, recognizing that the market is “out of the woods” will seek revenge on carriers that sought record increases or didn’t service their loads over the past two years.
With shippers realizing that a repeat of the 2021 capacity crunch is unlikely, they will go out and try to claw back as much as possible of the rate increases that they offered carriers over the past year. Carriers will find it incredibly difficult to withstand this pressure, as rejecting a decrease in contract rates will likely mean that a competitor will haul the freight at the newly negotiated price.
Freight brokers we’ve spoken with have suggested that this is part of their strategy. In essence, they seek to pick off the freight that truckload carriers have under contract, undercutting the rates by more than 30%. As long as the broker can service the load consistently and there isn’t a threat of an imminent service failure, the broker can hold onto the freight, albeit at the reduced price.
For the winning broker and shipper, it is a win/win, but for the incumbent carrier, it will end up losing.

Contract rates will continue to fall and could easily drop to $2.25/mile
A few months ago, the controversy in the trucking market was whether the freight market was in a recession or if it was a short-term blip. It is pretty clear that the recession camp has won and the market fundamentals will continue to be challenging.
Now the question is how far back could contract rates revert before we see a bottom? While it is incredibly hard to predict exact numbers, FreightWaves does have some historical data to draw from.
We can point to the spread indices inside of SONAR, which measure the difference between the current contract and spot trucking rates. The indices tend to stay within a tight range, largely because contract and spot inevitably follow one another. This is due to the fact that spot and contract capacity tends to be fungible between the two markets.
RATES12.USA, a SONAR index that measures the spread of contract and spot with a $1.20 fuel-surcharge base, is currently at $0.65/mile. Pre-COVID, the average was $0.24/mile.
If the index reverts back to normal patterns, contract rates will settle back to $2.25/mile before fuel surcharges.

This additional 20% drop would still put the truckload contract rates well above pre-COVID levels — but well off the highs.
Trucking carriers will cry foul, threatening that it is likely to put them out of business since they’ve had to eat massive cost increases over the past two years.
But the market doesn’t care; it only worries about the laws of supply and demand. However, for some shippers, the past two years have felt personal and now it’s their chance to get revenge.
Interested in the data presented in this article? All of the charts and data are available to subscribers of SONAR, the supply chain’s high-frequency data platform.
September 1, 2022
Changing Truckload Dynamics
Shippers’ revenge is coming for truckload carriers
Craig Fuller, CEO at FreightWaves Follow on Twitter Wednesday, August 31, 2022 7 minutes read
Listen to this article 0:00 / 10:24 BeyondWords
The freight market is a pendulum — and when it swings, it may be the buyers or sellers of capacity that now have the power in rate negotiations. Ever since the summer of 2020, trucking companies have largely held all of the power in rate negotiations, based on their ability to squeeze their shipper customers for rate premiums.
If the trucking firms didn’t get a rate increase in a contract rate negotiation, they would simply move the capacity to the spot market to exploit market conditions and much higher spot rates. And whether these negotiations are made through direct confrontation or in a passive- aggressive manner through tender rejections, the outcome is largely the same.
Along the way, carrier executives convinced themselves that the freight market was “different this time” and their ability to have pricing power would remain in place indefinitely.
In the world of trucking, the market has two parties — a buyer and seller. While a buyer of capacity can be a broker that plays the role of both the buyer and seller, in every trucking transaction, you have a carrier (seller) and shipper (buyer) of capacity.
Over the past two years, not all trucking companies exploited market conditions; many of the more seasoned players understood that the pricing power pendulum was temporary and would eventually revert back to give power to the shippers.
But, for those carriers that did exploit market conditions for their favor, get ready for “shippers’ revenge.”
The freight market pendulum
Trucking companies gain all of their pricing power when capacity in a market is tight. If there is more freight demand than capacity to service loads offered, trucking companies are able to leverage this for freight rate concessions. Often, it works.
Last year, shippers faced unprecedented challenges trying to move massive volumes of cargo through their supply chains, disruptions due to raw material and component shortages, runaway inflation, and labor shortages. At the same time, everyone living through COVID has experienced an enormous amount of personal pressure and home-life challenges.
Trucking executives have also faced many of their own challenges and would be rightfully cynical about the plight of a supply chain executive who wasn’t able to empathize with their challenges.
But people that control supply chains are humans. They have egos and frustrations like everyone else. CFOs at shipper organizations have been putting pressure on supply chain executives to tackle inflationary cost acceleration throughout their operations.
And if the past few months have been any indication, the market pendulum has quickly shifted back in favor of the shippers.
This is most obvious in truckload spot rates, which have collapsed since the start of the year. The National Truckload Index, available on SONAR, which tracks U.S. truckload spot rates on a daily basis, is reporting that the current spot rate for a truckload is down from $3.57/mile at the start of the year to $2.67/mile — a 25% reduction. Remove the price of diesel from the rate and the drop is even more dramatic, dropping from $2.99/mile to $1.89/mile — or a 37% reduction.
Spot rates are far more responsive to market conditions than contract rates, but following the Waterfall Theory of Freight and how tender rejection rates provide a reliable barometer for truckload capacity, we know that capacity is rapidly loosening and carriers are being less selective in which contracted loads they will accept.
SONAR’s outbound tender rejection index is now down to 5.43%, a new cycle low. Tender rejections haven’t been this low since May 24, 2020, in the earliest days of the COVID economy. Normally, when tender rejections drop, contract rates follow.
However, in this cycle, contract rates have dropped much more slowly than spot rates or tender rejections would suggest.
SONAR’s van contract rate index, which is derived as the national average contract rate from over $40 billion of actual contracted loads between shippers and carriers, is currently at $2.74/mile, down from a high of $2.98/mile set on June 3, 2022. The drop of $0.24/mile represents a 9% drop in two months — and reverses all of the contracted rate increases that carriers gained in the first half of 2022.
Shippers took a “wait and see” approach to contract rates, but that is over
Shippers were initially reluctant to renegotiate contract rates out of fear that they would lose capacity in the event of a capacity crunch. There was plenty of news for shippers to worry about and some analysts and market commentators warned that the drop in freight volume was either a temporary blip or a misreading of data.
Warnings about port strikes, rail strikes, labor shortages and a potential “tsunami of containers” as China reopened made every supply chain executive nervous about losing capacity. After all, not having capacity is far worse than paying more for it. Moreover, carriers reminded shippers that a pull-back in their commitments or rates would mean that carriers would reject any load tenders from that shipper.
But none of the warnings actually played out.
The railroads got back to work and settled their disputes, the West Coast ports have continued to operate unabated, and container imports bound for the U.S. actually dropped once China reopened. Furthermore, the U.S. goods economy also pulled back as consumers slowed their consumption of goods after facing record inflation and a post-COVID shift toward services.
The Federal Reserve, hell-bent on taming inflation that it largely caused, has focused almost singularly on smothering demand in an effort to control out-of-hand price hikes. There is no market that has felt the pain more than consumer discretionary purchases, which have an outsized role in driving the U.S. trucking economy.
Basically, for all of the warnings of rough waters ahead, supply chain professionals are navigating increasingly stable conditions. The storm had passed — and that fact has become glaringly apparent.
In fact, hope for a fourth quarter peak surge seems very unlikely, if you believe that import volume data is a reliable indicator of future truckload demand.
The Daily Watch, a morning email that is sent by FreightWaves to all current SONAR subscribers, reported that the ports of Los Angeles/Long Beach are seeing the lowest weekly maritime import shipments since 2020. The note states:
“Using SONAR’s WCSTM tickers, we monitor U.S. maritime imports coming into a trucking market for a given week. By this measure, the Los Angeles trucking market (WCSTM.LAX — measures all U.S. ports within that trucking market — in this case, including Los Angeles and Long Beach) saw the lowest weekly total for maritime import shipments since June 2020. While Los Angeles and Long Beach (LAX/LGB) have both kept a steady stream of import volumes through the first seven months of 2022, the weakness in aggregate U.S. import demand is finally beginning to materialize at these ports as well. Other U.S. West Coast ports such as Oakland and the Northwest Seaport Alliance (Seattle/Tacoma) have been posting significant year-over-year (y/y) declines in maritime import volumes for the past two months. Now, LAX/LGB will be joining the downward trend in significant y/y declines. This does not bode well for surface-side transportation markets, in which the ports of LAX/LGB feed a massive amount of demand from U.S. imports from overseas. July 2022 was likely the last month that the Port of Los Angeles will publish any y/y gains in loaded imports for the foreseeable future.”
Shippers, recognizing that the market is “out of the woods” will seek revenge on carriers that sought record increases or didn’t service their loads over the past two years.
With shippers realizing that a repeat of the 2021 capacity crunch is unlikely, they will go out and try to claw back as much as possible of the rate increases that they offered carriers over the past year. Carriers will find it incredibly difficult to withstand this pressure, as rejecting a decrease in contract rates will likely mean that a competitor will haul the freight at the newly negotiated price.
Freight brokers we’ve spoken with have suggested that this is part of their strategy. In essence, they seek to pick off the freight that truckload carriers have under contract, undercutting the rates by more than 30%. As long as the broker can service the load consistently and there isn’t a threat of an imminent service failure, the broker can hold onto the freight, albeit at the reduced price.
For the winning broker and shipper, it is a win/win, but for the incumbent carrier, it will end up losing.
Contract rates will continue to fall and could easily drop to $2.25/mile
A few months ago, the controversy in the trucking market was whether the freight market was in a recession or if it was a short-term blip. It is pretty clear that the recession camp has won and the market fundamentals will continue to be challenging.
Now the question is how far back could contract rates revert before we see a bottom? While it is incredibly hard to predict exact numbers, FreightWaves does have some historical data to draw from.
We can point to the spread indices inside of SONAR, which measure the difference between the current contract and spot trucking rates. The indices tend to stay within a tight range, largely because contract and spot inevitably follow one another. This is due to the fact that spot and contract capacity tends to be fungible between the two markets.
RATES12.USA, a SONAR index that measures the spread of contract and spot with a $1.20 fuel-surcharge base, is currently at $0.65/mile. Pre-COVID, the average was $0.24/mile.
If the index reverts back to normal patterns, contract rates will settle back to $2.25/mile before fuel surcharges.
This additional 20% drop would still put the truckload contract rates well above pre-COVID levels — but well off the highs.
Trucking carriers will cry foul, threatening that it is likely to put them out of business since they’ve had to eat massive cost increases over the past two years.
But the market doesn’t care; it only worries about the laws of supply and demand. However, for some shippers, the past two years have felt personal and now it’s their chance to get revenge.
Interested in the data presented in this article? All of the charts and data are available to subscribers of SONAR, the supply chain’s high-frequency data platform.
August 19, 2022
Housing Viewpoint
Housing hurts: Stocks look past dismal data
August 19, 2022
By Lindsey Bell, chief markets & money strategist for Ally

Housing data has been depressing.
When talk of a recession comes up, housing weakness is a typical justification as to why we are in a recession. But what if bad news is good news? Hear me out.
In general, stocks “price in” bad news early and they tend to rebound before the worst shows up in the economic data. Stocks are forward looking, and economic data is mostly backward looking. Lately, the stock market has been effectively absorbing weak economic data. Housing-related data has accounted for a lot of that data, but not all of it. Could it be that the market is beginning to bet on the economy bottoming soon (if not already), and quickly moving past all this negative news?
Let’s look at the housing market for clues.
The bad news first
Brace yourself, this isn’t pretty. You don’t have to look far to see a bleak housing picture. New and existing home sales have fallen dramatically. This week we learned July existing homes sales declines are picking up steam, with July marking the 12th consecutive month of decline. Not surprisingly, homebuilder sentiment plunged into contraction territory for the month of August, which was the first reading under the key 50 level since the onset of COVID.
That’s not all. Housing starts, a key indicator of economic activity, declined nearly 10% in July. Meanwhile, more prospective home buyers are backing out of deals. Data from Redfin show 16% of homes that went under contract last month fell through, up from just 12.5% in July last year. Why are folks pulling out of deals? It’s not employment concerns, as the jobs market remains robust. It’s likely an affordability issue as home prices and borrowing costs rise together. The National Association of Realtors confirmed what so many would-be first-time buyers feel: Affordability is at the lowest level since June 1989.
What’s moving in the right direction
I told you that was going to be depressing. Now that we got that out of the way, let’s talk about glimmers of hope underneath the surface. Inventory of existing homes for sale has been rising, and at 3.3 months’ supply its the highest level since August 2020. Granted, there is still much work to be done as that level is still below the 6 months of supply that is historically considered balanced for the housing market. Home prices are starting to moderate from the double digit increases that became the norm in the post-pandemic world. Over time, more houses on the market at lower prices will spur demand.
Another silver lining in the housing market is commodity prices easing: The price of lumber is down 65% from its pandemic high. As the input costs decline, it becomes cheaper to build a house. Another positive trend lately has been moderation and stabilization in the mortgage rate market. After surging above 6% in June, the average rate for a conventional 30-year mortgage has settled into the 5% to 5.5% range for now. Maybe the market is realizing that under any scenario (a hard landing, soft landing, or something in between) peak rates may be in. These types of trends are important to improve the affordability constraint on many looking for a home.
Finding strength in housing stocks
Despite what feels like a long road ahead for the housing market, price action in housing-related stocks is telling a more upbeat story. Since mid-June, the S&P Homebuilders ETF (XHB) has gained 30%, well above the 17% gain in the S&P 500 over the same time period.
The pop in the homebuilders ETF follows a 40% plunge between December and its June low. Over that period, investors priced in a severe slowdown in housing activity before much of the negative economic data was even seen.
To be sure, many of the homebuilders expect demand for new homes to cool in the coming months, driven by interest rates and inflationary pressures. Despite this outlook, the stocks reacted well to recent earnings reports. And while their price-to-earnings ratio has begun to lift off depressed levels, their valuations remain cheap by historical standards.
Looking beyond the homebuilders, shares of home improvement retailers Home Depot and Lowe’s have also performed better than the broad market during the summer rally. This week both companies provided guidance that were better than feared and suggested demand for home projects is improving.
While none of these housing focused companies signaled an all-clear signal, investors seem to be focused on the possibility of better times ahead for housing.
The bottom line
The housing market needs to cool off. There are indications that is happening, and it’s not crushing the economy. I see the sharp rally in homebuilder stocks as a sign that the worst could be in the rearview mirror for investors and recent economic gauges point to some normalization occurring over time.
 Everchem Updates Archive
  Sign Up for Email Updates