
Epoxy
August 2, 2022
Contract Truck Rates Expected to Fall
Contract truckload rates will likely soften in the coming months
Spot rates indicate a strong dip for contracts is imminent
Zach Strickland, FW Market Expert & Market Analyst Follow on Twitter Saturday, July 30, 2022 3 minutes read Listen to this article 0:00 / 4:56 BeyondWords
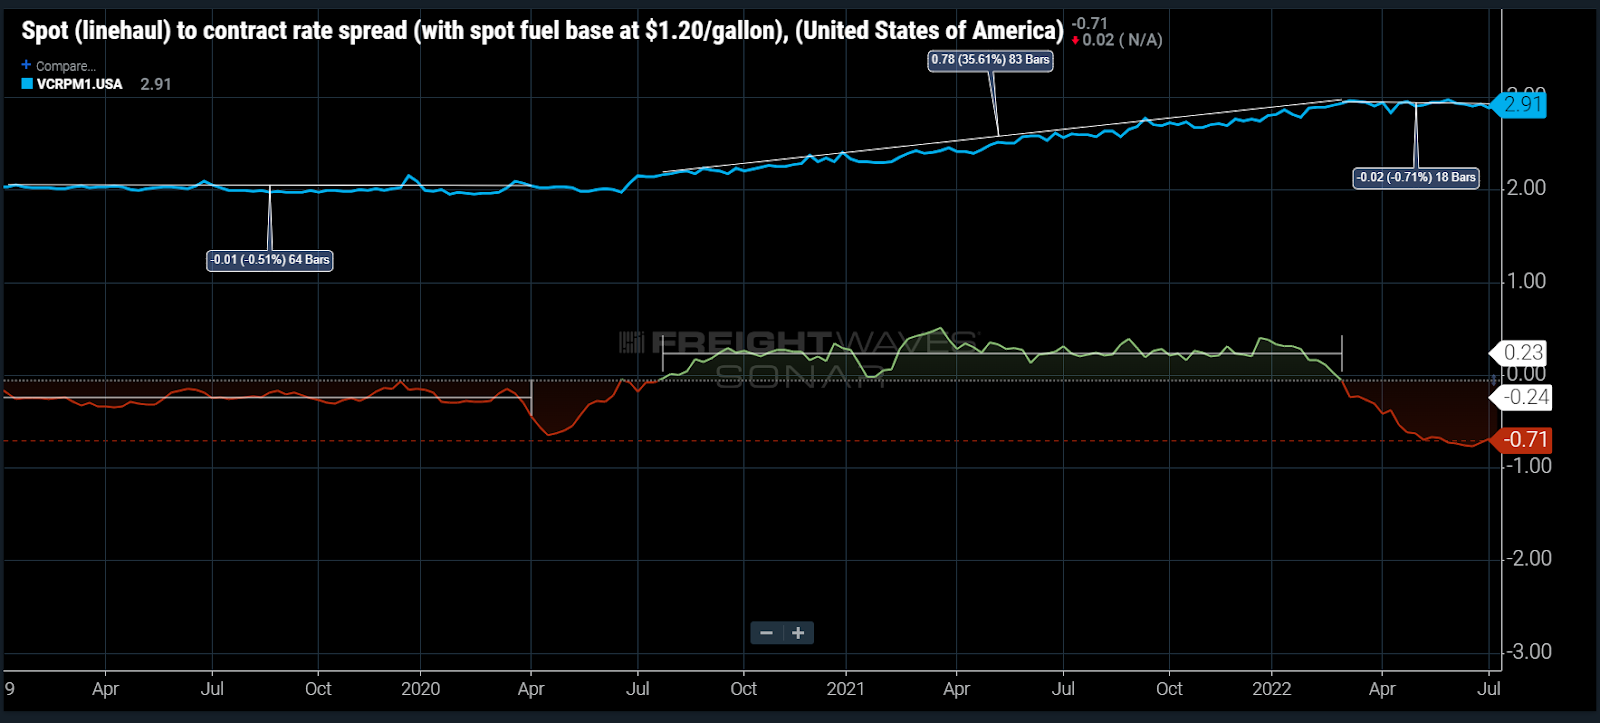
Van rates on the truckload contract market will likely soften in the coming months. But, the decline won’t be as marked as what the industry saw on the spot market side.
The spread between spot and contract rates has averaged around record low levels (~-74 cents a mile) since early May. That will put downward pressure on contract rates for bids negotiated in the second half of the year. There is little precedent for such a dramatic difference, but there’s also little evidence historically that contract rates will fall as fast as they increase.
The contract truckload market behaves very differently from the spot market. Volatility is the main difference. That’s driven primarily by the way pricing is negotiated.
The RATES12 index used in this week’s chart is the difference between spot rates less a level of estimated cost of fuel and contract rates. This is done for a more apples-to-apples comparison of the two rates, as contract rates include a portion of fuel cost and pass a lot of it along in the form of a fuel surcharge. This mechanism is largely absent from spot rates.
Contract truckload rates have barely budged since March, but red flags are already appearing
The contract or published rate market is simply an agreement between shipper and carrier that is in place for an extended period of time. The commitment is somewhat tenuous as neither volume nor service is guaranteed in most instances.
The only binding portion is, if the shipper tenders a load(s) to the carrier and the carrier is willing and able to transport the customer’s freight, it will do it for a predetermined price until the expiration of the agreement. Spot rates are negotiated on the spot and are normally only applicable for a few days with minimal volume.
Contract rate agreements typically have a life span of around 12 months but can be longer or shorter. Many shippers transitioned to a shorter procurement cycle during the pandemic thanks to their inability to secure capacity reliably, essentially bidding against one another and driving up rates faster than ever. Contract rates increased ~49% from June 2020 to March 2022.
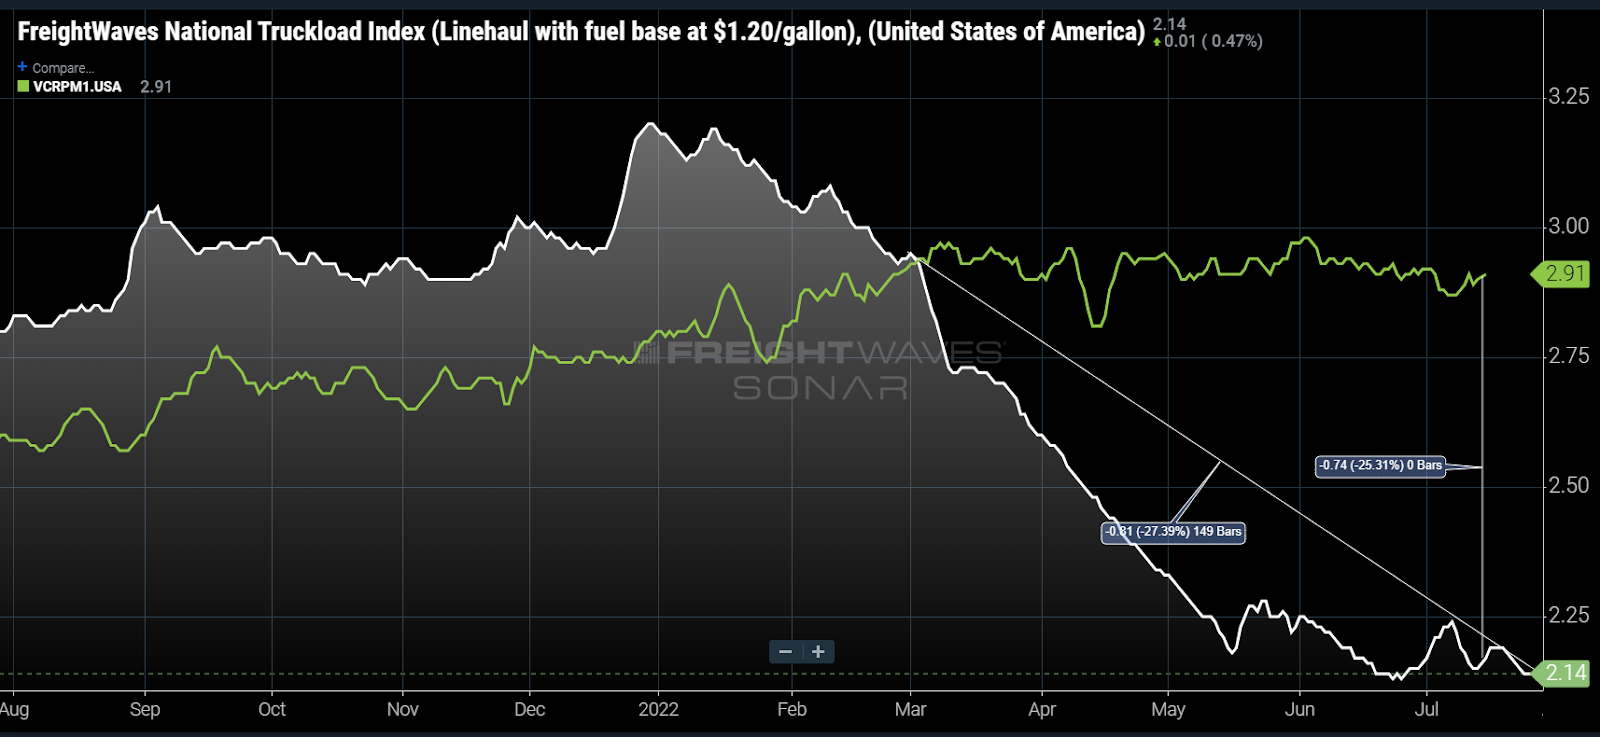
Since March, there has been minimal movement in contract rates, but they are showing early signs of deterioration, falling about 2% since early June. Spot rates, assuming a base level of fuel cost around $1.20 per gallon, have dropped 27% over the same period. This has created a 74-cent-per-mile difference between the spot (NTIL12) and contract rate (VCRPM1) indices.
In 2019 the spread between spot and contract averaged -24 cents per mile. Contract rates barely moved before falling about 2%-4% in January 2020, which shows that contract rates are less volatile.
The spread today is three times larger than it was in 2019. Shippers may have a stronger appetite for cost reduction after two years of rapid inflation.
A rate decrease will occur if demand-side conditions do not improve
Movements for contract truckload rates will ultimately be decided by the carriers and their need for equipment utilization. And so far, most publicly traded trucking companies have only mentioned minor deterioration at most while reporting strong Q2 results.
Accepted contract load volumes support this for now, showing only a marginal decline in July versus June. Compared to last July, volumes are down 3%-5%.
As for the supply side of the equation, most of the capacity growth over the past two years has been on the small fleet/owner-operator side, which heavily relies on spot market freight. The larger fleet heavy contract market has better structure to maintain elevated rate levels.
That said, the rate differential is too large to sustain for long. Some level of rate decrease will occur if demand-side conditions remain at or below current levels. Judging from history, it would appear a conservatively estimated 3%-5% decrease is all but imminent in the coming months.
About the Chart of the Week
The FreightWaves Chart of the Week is a chart selection from SONAR that provides an interesting data point to describe the state of the freight markets. A chart is chosen from thousands of potential charts on SONAR to help participants visualize the freight market in real time. Each week a Market Expert will post a chart, along with commentary, live on the front page. After that, the Chart of the Week will be archived on FreightWaves.com for future reference.
SONAR aggregates data from hundreds of sources, presenting the data in charts and maps and providing commentary on what freight market experts want to know about the industry in real time.
The FreightWaves data science and product teams are releasing new datasets each week and enhancing the client experience.
August 2, 2022
Contract Truck Rates Expected to Fall
Contract truckload rates will likely soften in the coming months
Spot rates indicate a strong dip for contracts is imminent
Zach Strickland, FW Market Expert & Market Analyst Follow on Twitter Saturday, July 30, 2022 3 minutes read Listen to this article 0:00 / 4:56 BeyondWords
Van rates on the truckload contract market will likely soften in the coming months. But, the decline won’t be as marked as what the industry saw on the spot market side.
The spread between spot and contract rates has averaged around record low levels (~-74 cents a mile) since early May. That will put downward pressure on contract rates for bids negotiated in the second half of the year. There is little precedent for such a dramatic difference, but there’s also little evidence historically that contract rates will fall as fast as they increase.
The contract truckload market behaves very differently from the spot market. Volatility is the main difference. That’s driven primarily by the way pricing is negotiated.
The RATES12 index used in this week’s chart is the difference between spot rates less a level of estimated cost of fuel and contract rates. This is done for a more apples-to-apples comparison of the two rates, as contract rates include a portion of fuel cost and pass a lot of it along in the form of a fuel surcharge. This mechanism is largely absent from spot rates.
Contract truckload rates have barely budged since March, but red flags are already appearing
The contract or published rate market is simply an agreement between shipper and carrier that is in place for an extended period of time. The commitment is somewhat tenuous as neither volume nor service is guaranteed in most instances.
The only binding portion is, if the shipper tenders a load(s) to the carrier and the carrier is willing and able to transport the customer’s freight, it will do it for a predetermined price until the expiration of the agreement. Spot rates are negotiated on the spot and are normally only applicable for a few days with minimal volume.
Contract rate agreements typically have a life span of around 12 months but can be longer or shorter. Many shippers transitioned to a shorter procurement cycle during the pandemic thanks to their inability to secure capacity reliably, essentially bidding against one another and driving up rates faster than ever. Contract rates increased ~49% from June 2020 to March 2022.
Since March, there has been minimal movement in contract rates, but they are showing early signs of deterioration, falling about 2% since early June. Spot rates, assuming a base level of fuel cost around $1.20 per gallon, have dropped 27% over the same period. This has created a 74-cent-per-mile difference between the spot (NTIL12) and contract rate (VCRPM1) indices.
In 2019 the spread between spot and contract averaged -24 cents per mile. Contract rates barely moved before falling about 2%-4% in January 2020, which shows that contract rates are less volatile.
The spread today is three times larger than it was in 2019. Shippers may have a stronger appetite for cost reduction after two years of rapid inflation.
A rate decrease will occur if demand-side conditions do not improve
Movements for contract truckload rates will ultimately be decided by the carriers and their need for equipment utilization. And so far, most publicly traded trucking companies have only mentioned minor deterioration at most while reporting strong Q2 results.
Accepted contract load volumes support this for now, showing only a marginal decline in July versus June. Compared to last July, volumes are down 3%-5%.
As for the supply side of the equation, most of the capacity growth over the past two years has been on the small fleet/owner-operator side, which heavily relies on spot market freight. The larger fleet heavy contract market has better structure to maintain elevated rate levels.
That said, the rate differential is too large to sustain for long. Some level of rate decrease will occur if demand-side conditions remain at or below current levels. Judging from history, it would appear a conservatively estimated 3%-5% decrease is all but imminent in the coming months.
About the Chart of the Week
The FreightWaves Chart of the Week is a chart selection from SONAR that provides an interesting data point to describe the state of the freight markets. A chart is chosen from thousands of potential charts on SONAR to help participants visualize the freight market in real time. Each week a Market Expert will post a chart, along with commentary, live on the front page. After that, the Chart of the Week will be archived on FreightWaves.com for future reference.
SONAR aggregates data from hundreds of sources, presenting the data in charts and maps and providing commentary on what freight market experts want to know about the industry in real time.
The FreightWaves data science and product teams are releasing new datasets each week and enhancing the client experience.
August 2, 2022
Huntsman Q2 Results
Huntsman Announces Second Quarter 2022 Earnings; $501 million of Buybacks in First Half of 2022
Download as PDF August 02, 2022 6:00am EDT
Related Documents
Audio Earnings WebcastEarnings Slides PDF
Second Quarter Highlights
- Second quarter 2022 net income of $242 million compared to net income of $172 million in the prior year period; second quarter 2022 diluted earnings per share of $1.10 compared to diluted earnings per share of $0.70 in the prior year period.
- Second quarter 2022 adjusted net income of $265 million compared to adjusted net income of $191 million in the prior year period; second quarter 2022 adjusted diluted earnings per share of $1.28 compared to adjusted diluted earnings per share of $0.86 in the prior year period.
- Second quarter 2022 adjusted EBITDA of $432 million compared to adjusted EBITDA of $334 million in the prior year period.
- Second quarter 2022 net cash provided by operating activities from continuing operations was $231 million. Free cash flow from continuing operations was $162 million for the second quarter 2022 compared to an outflow of $83 million in the prior year period.
- Repurchased approximately 8.4 million shares for approximately $291 million in the second quarter 2022.
THE WOODLANDS, Texas, Aug. 2, 2022 /PRNewswire/ —
| Three months ended | Six months ended | |||||||
| June 30, | June 30, | |||||||
| In millions, except per share amounts | 2022 | 2021 | 2022 | 2021 | ||||
| Revenues | $ 2,362 | $ 2,024 | $ 4,751 | $ 3,861 | ||||
| Net income | $ 242 | $ 172 | $ 482 | $ 272 | ||||
| Adjusted net income (1) | $ 265 | $ 191 | $ 521 | $ 338 | ||||
| Diluted income per share | $ 1.10 | $ 0.70 | $ 2.14 | $ 1.07 | ||||
| Adjusted diluted income per share(1) | $ 1.28 | $ 0.86 | $ 2.47 | $ 1.52 | ||||
| Adjusted EBITDA(1) | $ 432 | $ 334 | $ 847 | $ 623 | ||||
| Net cash provided by (used in) operating activities from continuing operations | $ 231 | $ (7) | $ 316 | $ (23) | ||||
| Free cash flow from continuing operations(2) | $ 162 | $ (83) | $ 178 | $ (197) | ||||
| See end of press release for footnote explanations and reconciliations of non-GAAP measures. |
Huntsman Corporation (NYSE: HUN) today reported second quarter 2022 results with revenues of $2,362 million, net income of $242 million, adjusted net income of $265 million and adjusted EBITDA of $432 million.
Peter R. Huntsman, Chairman, President, and CEO, commented:
“Second quarter EBITDA margins exceeded 18% on the back of our value over volume strategy, improved pricing, and solid cost control. We remain well ahead or on track to meet the targets that we presented at our Investor Day in November 2021, despite an increasingly challenging economic environment due to extremely high European natural gas prices, headwinds in China associated with government-mandated shutdowns and monetary tightening in the United States. In addition to the positive results, we repurchased approximately $500 million in shares in the first six months of the year and our balance sheet remains extremely strong with a net leverage ratio of 0.6x.
“Regardless of any macro headwinds that may impact the chemical industry in the coming quarters, our priorities around cost control, a focus on downstream businesses and returning capital to shareholders will remain unchanged. Our balance sheet and cash generation places us in an enviable position to take advantage of opportunities as they present themselves to invest in our core businesses.” Segment Analysis for 2Q22 Compared to 2Q21
Polyurethanes
The increase in revenues in our Polyurethanes segment for the three months ended June 30, 2022 compared to the same period of 2021 was primarily due to higher MDI average selling prices, partially offset by lower sales volumes. MDI average selling prices increased in all our regions. Sales volumes decreased primarily due to the extended government-mandated COVID lockdown in Shanghai, China and lower demand, partially offset by favorable comparisons in Europe due to the scheduled turnaround at our Rotterdam, Netherlands facility in the second quarter of 2021. The increase in segment adjusted EBITDA was primarily due to higher MDI margins and a gain from an insurance settlement, partially offset by lower sales volumes, the negative impact of weaker major international currencies against the U.S. dollar and lower equity earnings from our minority-owned joint venture in China.
Advanced Materials
The increase in revenues in our Advanced Materials segment for the three months ended June 30, 2022 compared to the same period of 2021 was primarily due to higher average selling prices, partially offset by lower sales volumes. Average selling prices increased largely in response to higher raw material, energy and logistics costs as well as improved sales mix. Sales volumes decreased primarily due to deselection of lower margin base resins business. The increase in segment adjusted EBITDA was primarily due to higher sales prices and improved sales mix.
July 29, 2022
Olin Epoxy Comments from Investors Call
Olin Corporation (OLN) CEO Scott Sutton on Q2 2022 Results – Earnings Call Transcript
Jul. 29, 2022 12:15 PM ETOlin Corporation (OLN)
Q2: 2022-07-28 Earnings Summary
EPS of $2.78 beats by $0.25 | Revenue of $2.62B (17.77% Y/Y) misses by $41.49M
Olin Corporation (NYSE:OLN) Q2 2022 Earnings Conference Call July 29, 2022 9:00 AM ET
Company Participants
Steve Keenan – Director-Investor Relations
Scott Sutton – Chief Executive Officer
Todd Slater – Chief Financial Officer
Scott Sutton — President and Chief Executive Officer
Yeah. Thanks, Steve, and good morning to everybody. The Olin team did a great job delivering the highest quarterly EBITDA in our history, and delivering the fourth quarter in a row where EBITDA was $700 million, plus or minus, even though global economic conditions declined. We did what we said we would do.
We ran our model of leadership and accelerated our reduction of Olin share count without adding debt to our investment grade balance sheet. Still many imagine us all the way down in the earnings and free cash flow gutter in the imminent recession. So I will solely focus my remarks on what Olin looks like in a recession, and then on why Olin is a good investment in any event. So let’s go back and revisit the recession, EBITDA and free cash flow slide from our first quarter earnings call shown here as slide number 4.
Starting on the left-hand side of the slide, from our $2.8 billion EBITDA 12-month run rate, it is certainly not impossible that the CAPV business experiences lower, longer-term operating rate reductions as we focus on maintaining the value of our products through a recession. The associated percent drop in CAPV EBITDA could be like what our Epoxy business is experiencing. The combination of the two business performance reductions result in a $1 billion EBITDA drop. The right-hand side of the slide seems to be more interesting to most Olin followers.
Starting from the 2020 EBITDA result of $636 million, the three line items that we don’t expect to repeat in a recession under the new model are low core in pricing, selling cash-negative EDC and Winchester operating in a significantly smaller demand structure. All three line items seem to be well accepted. The fourth upside line item called other structural change needs some clarification though. Included in that upside line item, are the materialized fixed cost reductions for the closure of 865,000 ECU tons of chlor alkali production, an updated epichlorohydrin positioning, maintaining part of the improved epoxy pricing under our new model of value, an improved VCM contract arrangement in gains from multiple alliances.
In this recession scenario, Olin still generates $7 per share or more of levered free cash flow. In fact, we welcome the opportunity to further reduce our share count right through the middle of a recession. Obviously, we’re bullish on Olin. Slide No.
5 shows why. We’re the leader in every one of our businesses, and we run a model that looks around corners so we can position for the future today. So said differently, we take difficult actions early in the cycle. Part of that positioning is to temporarily reduce participation in markets with poor future quality indicators.
Our curtailments in Epoxy and associated upstreams at Freeport and Brazil, as well as an EDC and Freeport continue today. Both Epoxy and EDC represent weakness on the chlorine side of the ECU. Accordingly, we match our market participation to the weak side of the ECU. This is a fundamental change to our positioning from prior periods.
Additionally, we expect to curtail epoxy and associated upstreams again stated Germany late in the third quarter, in part due to the European energy situation. Our complete company strategy changed from heavy volume to nimble value along with the currently understated equity valuation positions us to buy up to 20% of our outstanding shares in a year even in a weak economic cycle. Our new $2 billion share repurchase program reflects our board’s confidence in Olin’s future earnings and cash flow generation. With our solid balance sheet and strong cash flow, the company is well positioned to execute on this attractive opportunity to invest in Olin.
Jeff Zekauskas — J.P. Morgan — Analyst
Thanks very much. Can you talk about the state of the Epoxy market and what your Epoxy volumes were like in the second quarter relative to the first?
Scott Sutton — President and Chief Executive Officer
Yes. Hey, Jeff. Yes. I mean in epoxy, our volumes in the second quarter actually declined from the first quarter.
In fact, we ran the lowest volume quarter in the history of the business. The big driver there, Jeff, is China. I mean China is at least 50% of the world’s consumption of epoxy, consumption has declined much more than supply decline. And essentially, China has flipped its trade flows has effectively become a net exporter of epoxy and epichlorohydrin and a lot of that material is moving into Asia.
And consequently, all of that material that is already produced in other parts of Asia, is moving into Europe and into North America. Now we all know this is a temporary situation, but it is incredibly dramatic and effectively, we’re running that business. You can think of it 50% sort of asset utilization and we’re taking those difficult choices and making those asset and market moves to make sure we preserve value through this time. It just really doesn’t get much worse than this.
This is sort of beyond what you would expect out of a recession when you combine the European situation as well.
Arun Viswanathan — RBC Capital Markets — Analyst
Great. Thanks. So you also mentioned, I guess, in the release that you’d likely see a reduction in rates at start as well. And so does that mean that you kind of flip back and increase the rates at Freeport? Could you just update on how you’re thinking about managing through this higher energy cost environment, and some of those demand trends that you’re seeing there?
Scott Sutton — President and Chief Executive Officer
Yes. Sure. I mean, when and if we take that action later here in the third quarter, I mean, we’ll balance some of that with ramping up production at our other sites. But still, in this time period, this third quarter and moving into fourth quarter, I mean you’re going to see us run our overall system in Epoxy still at very, very low rates as we reduce our participation.
Lots of areas of that market are still pretty poor quality.
Arun Viswanathan — RBC Capital Markets — Analyst
Thanks. And as a quick follow-up, you mentioned that China has flipped their trade flows in the Epoxy, I think. And just curious, if you’re concerned at all about that as it relates to caustic or other chlorine products just because — if your outlook does call for potentially increased caustic margins, or ECU margins, because of reductions in operating rates due to chlorine weakness, what — do you expect more exports to wind up on the West Coast or the East Coast here because the returns are so great? And — or is that unlikely? And then, I guess, just on that note, are you satisfied, I guess, with the 865,000 tons of closures. Does that kind of take care of all of your high-cost capacity, or would you expect to take more action on that side? Thanks.
Scott Sutton — President and Chief Executive Officer
Yeah. Sure. I mean, look, what you described has already been happening. I mean, with the slowdown generally in China demand relative to production, we’ve already seen additional caustic exports out of China, just like there’s been a lot of extra PVC exports as well.
So that has been going on. And our model is already adapted to offset that exposure. And we’ve seen those flows come in, and we’re working around flows. And still, we go out in certain cases and purchase some liquidity out of the global market space and maybe move it to a different area.
I mean, look, with regard to the 865,000 ECU tons, and just as a reminder, that 865,000 ECU tons included shutting down the remaining 200,000 tons of ECU capacity that is diaphragm based in McIntosh, Alabama. And we have already accomplished that. In fact, we pulled it forward, so all of the diaphragm capacity is down in McIntosh, Alabama. We’ll have to see we’re satisfied with that.
I mean, certainly, that’s made a difference in our ability to be nimble and drive for value. But that number has taken us to a reasonable point for now. There’s always other options.
Steve Byrne — Bank of America Merrill Lynch — Analyst
Thank you. Just a couple questions regarding the statement about you’re running — you could run your assets at 50% rates for a year. Where would you estimate your operating rates are likely to be in the third quarter? And can you comment on the significance of the one-year phase? Is that — is there something implicit in running at rate that is really unsustainable beyond just the financial impacts?
Scott Sutton — President and Chief Executive Officer
Yes. Sure. I mean the only business that we really provided indications on where we’re running is our Epoxy business. And we’ve said we’re running that business pretty close to 50% operating rates.
I would just say in our CAPB business that we’re well above that level and have plenty of room there. The only significance in the one year is we were trying to demonstrate what is the lowest full-year EBITDA that Olin might have in its future. So we picked a pretty long recession scenario. In other words, one year where the global economy declined so much that we had to run at that rate every day for a full year.
We’re trying to be a bit conservative here because clearly Olin’s equity value is driven by the view that under that kind of scenario, our EBITDA must be much lower than where we believe it is. So we’re just trying to present a compelling case that says we are good in a recession. And in fact we can create value via a really good capital allocation right through the middle of that recession. So that’s the idea that’s behind that 12-month window.
Mike Leithead — Barclays — Analyst
Got it. Makes sense. And then maybe just a second, I want to circle back to I think your answer to Jeff’s question about Epoxy and China turning to a net exporter. And just – when you look at other chemical products or cycles when you see that happen, things do tend to get a bit sloppy for a bit of time.
So can you just walk through your comfort that that’s not the case for Epoxy or EPI right now and try as you say?
Scott Sutton — President and Chief Executive Officer
Well, no, I would just say that it is already it takes for EPI and Epoxy. There is so much material that used to be imported into China that now because of the mismatch of China’s internal consumption versus their production. Now that material that used to move into China does not anymore. Most of that material came from other Asian countries.
Consequently those other Asian countries have been exporting that material to North America and to Europe. And that’s been going on for a number of months. And that is why our Epoxy earnings came down. We’ve elected not to participate in that have our value remain where it is.
And when that reverses, which it will reverse, we’re left where our volumes return but the return at the pricing level that we had notched it up to.
https://www.nasdaq.com/articles/olin-corporation-oln-q2-2022-earnings-call-transcript
 Everchem Updates Archive
 Sign Up for Email Updates