The Urethane Blog
Everchem Updates
VOLUME XXI

September 14, 2023
Everchem’s exclusive Closers Only Club is reserved for only the highest caliber brass-baller salesmen in the chemical industry. Watch the hype video and be introduced to the top of the league: — read more
October 21, 2021
No Surprises in China’s Slowdown
Q3 GDP growth was largely in line with long-running trends.
By Fisher Investments Editorial Staff, 10/18/2021 Share
Chinese GDP growth slowed to 4.9% y/y in Q3, with most pundits agreeing the problems at Evergrande and associated real estate woes, combined with September’s electricity shortage, took a big bite out of the economy. While we agree those issues did have some negative effects, most of today’s coverage overstated them and ignored a simple but important point: Q3’s growth rate is right in line with the long-running trend. In our view, that makes these results a return to pre-pandemic normal, not a sign of sudden big problems in the world’s second-largest economy—a fine backdrop for stocks.
Also lost in most coverage: Chinese GDP is so far on track to meet the government’s full-year target of at least 6%, as it is up 9.8% year to date from 2020’s first three quarters.[i] Obviously there is some COVID skew there, but according to China’s National Bureau of Statistics’ (NBS) press release, the compound growth rate over the past two years is 5.2%.[ii] That is very much in line with pre-pandemic growth rates. So is Q3’s 4.9% growth, as Exhibit 1 shows—it largely extends the decade-long slowdown from the double-digit growth rates of old.
Exhibit 1: Slowing Growth Is the Norm in China
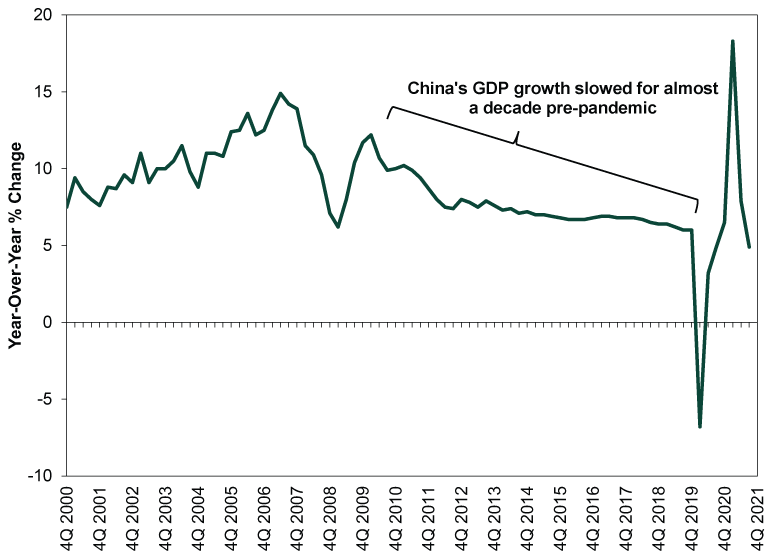
Source: FactSet, as of 10/18/2021.
Much of the sour sentiment today stemmed not from the headline GDP figure, but from September data—specifically industrial production and real estate. The former slowed to 3.1% y/y, the lowest rate since last year’s lockdowns, which pundits interpreted as a sign that the energy crunch is taking a big toll on factories.[iii] Yet slow growth isn’t contraction. Take this with a grain of salt or two, as the accuracy of seasonal adjustments is an open question, but industrial production was about flat month-over-month (up 0.05%, according to the NBS).[iv] Even if reality was a bit worse than that, it doesn’t point to electricity shortages sucker punching heavy industry. Rather, it points to the sector overall doing what it could in the face of a stiff headwind.
Reading into any one month as a sign of things to come is generally an error, but we think that is especially true of September’s industrial production. The electricity crunch is a one-off negative, not a permanent state. Over the past several days, the government has taken a number of steps to ease the electricity shortage, including easing price controls and beefing up coal production. That suggests the power shortage should ease sooner rather than later, giving factories a shot in the arm.
In our view, reading too much into September’s real estate data is similarly shortsighted. Yes, home sales fell -16.9% y/y in the month.[v] But is that any wonder, what with uncertainty over Evergrande and other property developers weighing on sentiment? And with regulators directing banks to restrict credit for developers and home buyers? Those restrictions are already easing, which should help sales stabilize looking forward. Plus, even with the late-summer swoon, home sales are up a whopping 17.8% year to date through September versus 2020’s first 9 months.[vi] Meanwhile, residential real estate investment fell a much milder -1.6% y/y in the month and is up 10.9% year to date.[vii] Here too, we wouldn’t read into one month, but the sharp divide between September’s sales and investment activity shows Evergrande’s woes aren’t representative of the property sector as a whole. The central bank’s recent measures easing liquidity for property developers should further support stability.
At a philosophical level, we think the heightened focus on heavy industry and real estate shows that the West broadly has an inaccurate view of China’s economy. Several outlets have claimed real estate is responsible for 29% of Chinese GDP, which they calculate by folding in furniture sales, construction and anything tangentially related to the sale of a home. In our view, all the assumptions folded into that figure are debatable, making it more accurate to look at pure real estate only. That figure—real estate, renting and leasing activities—was just north of 10% of GDP pre-pandemic, which is bigger than the US but not the driving economic force.[viii] Even if you fold construction into that—which includes a lot of things unrelated to residential and commercial real estate—you wind up at 17%, not nearly 30%.
Similarly, while manufacturing is more important economically in China than in more developed countries, it was still only about 39% of pre-pandemic GDP.[ix] Services, which gets far less attention, now generates the majority of Chinese GDP—53.1% pre-pandemic and in 2020.
China’s economy isn’t in perfect shape, but last we checked, no economy in the history of the world was ever perfect. All economies have pockets of strength and weakness at any given time. China’s weaker pockets are getting all the attention right now, but the stronger areas are more than offsetting them and helping the world’s second-largest economy continue adding to global GDP. That is a just-fine economic environment for stocks globally, in our view.
https://www.fisherinvestments.com/en-us/marketminder/no-surprises-in-chinas-slowdown
October 21, 2021
Dow Inc. (DOW) CEO Jim Fitterling on Q3 2021 Results – Earnings Call Transcript
Oct. 21, 2021 12:03 PM ETDow Inc. (DOW)
Dow Inc. (NYSE:DOW) Q3 2021 Earnings Conference Call October 20, 2021 8:00 AM ET
Company Participants
Jim Fitterling – Chief Executive Officer
Howard Ungerleider – Chief Financial Officer
Pankaj Gupta – Investor Relations
Jim Fitterling
Thank you, Pankaj and thanks everyone for joining us today. Starting on slide 3. In the third quarter, Dow achieved top and bottom-line growth, both year-over-year and sequentially. I’m incredibly proud of the Dow team for delivering these results and doing so safely, despite industry supply disruptions from hurricanes on the U.S. Gulf Coast. Our pro-active storm preparations enabled us to maintain the safety of our team and community and recover quickly. We delivered a 53% sales increase year-over-year with double digit gains in every segment, business and region. We also recorded a 7% increase in sales over the prior quarter. We captured strong price momentum driven by tight supply demand balances across our key value chain.
And we achieved volume growth of 2%, both year-over-year and sequentially, supported by continued strong end-market demand despite supply and logistics constraints. We increased operating EBITDA by more than $2.1 billion year-over-year, with improvements in all segments and businesses and $58 million higher sequentially. Key contributors included year-over-year margin expansion of 1170 basis points driven by price momentum and demand growth, and increased equity earnings up 189 million from margin expansion at our Sadara and Kuwait joint ventures. Our continued focus on cash generation and our balanced, disciplined capital allocation enabled us to deliver cash flow from operations of 2.7 billion, up 958 million year-over-year, driven by margin expansion from price momentum in key value chain.
We returned a total of 918 million to shareholders through our industry-leading dividend of 518 million plus 400 million in share repurchases, and we also reduced gross debt by more than 1.1 billion in the quarter. Our proactive liability management actions to tender existing notes have resulted in no long-term debt maturities due until 2026, and we’ve reduced annual interest expense by more than 60 million. Overall, Dow continues to deliver on its priorities and we see further strength ahead as we benefit from a favorable macro backdrop and execute our disciplined strategy to decarbonize our footprint and grow earnings, driving significant value for all stakeholders. Moving to our segment performance on Slide 4. In The Packaging and Specialty Plastics segment, operating EBITDA was $2 billion compared to 647 million in the year-ago period.
Sequentially, operating EBITDA was down 60 million. Price gains in both businesses and in all regions led to margin improvement in the core business and increased equity earnings. On a sequential basis, operating EBITDA margins declined by 300 basis points on higher feed stock and energy costs. The packaging and specialty plastics business reported a net sales increase year-over-year, led by local price gains in industrial and consumer packaging, and flexible food and beverage packaging applications. Volumes declined year-over-year due to lower polyethylene supply, as a result of planned maintenance turnarounds and weather related outages in the quarter. Compared to the prior quarter, the business delivered price and volume gains on strong demand in industrial and consumer packaging applications, which were partly offset by a hurricane-related outages.
Moving to the Industrial Intermediates & Infrastructure segment, operating EBITDA w as 713 million, up 609 million year-over-year, primarily due to continued tight supply and demand in both businesses. Sequentially operating EBITDA was up 65 million and operating EBITDA margins expanded by 50 basis points on volume and price gains in both businesses. The Polyurethanes & Construction Chemicals business increased net sales compared to the year-ago period with price gains in all regions on tight supply demand balances. Volume declines year-over-year primarily reflected the planned transition of a low margin co-producer contract, as well as weather related outages and third party supply constraints. Sequentially, the business delivered sales growth due to increased local price and volume from additional supply availability to meet resilient demand.
The Industrial Solutions business delivered a net sales improvement compared to the year-ago period with local price gains in all regions. Volume increased year-over-year on strong demand for materials in industrial manufacturing and energy applications. Net sales also increased sequentially, driven by volume growth primarily in coatings and industrial applications from increased supply and local price gains in all regions. And finally, the performance materials in coatings segment reported operating EBITDA of 284 million, up 209 million versus the same quarter last year as margins increased 750 basis points due to strong price momentum and Robust demand recovery for silicone and industrial coatings offerings. Sequentially, operating EBITDA was up 59 million on price gains, leading to margin expansion of 210 basis points.
The Consumer Solutions business achieved higher net sales year-over-year with price gains in all regions. Volume increased over the prior year on stronger consumer demand for personal care, mobility, and electronics offerings. Sequentially, sales were down as price increases in all regions were more than offset by volume declines as a result of planned maintenance and third party supply and logistics constraints.
The Coatings and Performance Modernist business, delivered increased net sales year-over-year, as higher raw material costs and tight supply demand balances led to price gains in all regions. Volumes were down year-over-year as demand recovery for industrial coatings was more than offset by weather related outages and third party supply and logistics constraints. Sequentially, the business delivered local price gains in all regions supported by increased volume due to continued strong demand for acrylic monomers and architectural coatings and increased supply availability. Now, let me turn it over to Howard to review the modeling guidance.
Howard Ungerleider
We expect these costs to be at approximately $350 million headwind sequentially. Dow will continue to utilize our broad geographic footprint and best-in-class feed stock flexibility to help mitigate these impacts. We also anticipate $175 million tailwind from turnarounds in the quarter as we completed our planned maintenance at our cracker in Canada. In Industrial Intermediates & Infrastructure, continued consumer demand for furniture and bedding, appliances, pharma, and home care, are expected to keep supply tight in our key value chains. Due to the weather related outages in the third quarter, some of our planned turnaround activity was moved to the fourth quarter. Sadara will also start a turnaround at it’s isocyanates facility in the fourth quarter as well. Altogether, we anticipate a $100 million in this segment from turnaround impacts. Short-term increased energy costs in the U.S. Gulf Coast and Europe are expected to be an additional $100 million headwind in the quarter.
We continue to see sequential recovery in industrial activity, particularly for HOG applications. We anticipate this recovery will continue at least through the fourth quarter as industrial production continues to ramp up from very low inventory levels to meet demand and performance materials and coatings demand for electronics, mobility, building construction continues to outpace supply. Demand for architectural coatings is also expected to remain elevated due to persistently low inventory levels across the value chain. Global production for silicone has been impacted by the recent dual control policy enforcement actions in China, with silicon metal prices almost three times their previous highs. We intend to put forward a scheduled turnaround at our facility in Zhangjiagang, China to coincide with government actions to curtail power usage. Our current estimate for the quarter includes a $125 million from increased raw material costs and turnaround impacts.
We’ll continue to work on mitigating the impacts of rising raw material costs through our integrated position in both businesses. Despite higher raw material and energy costs in the fourth quarter, Dow will continue to leverage its advantage global footprint, structural cost, and feedstock advantages, as well as our broad suite of differentiated products to meet growing demand. On slide 6, as we look ahead, we expect robust economic growth to continue. With the Delta variant slowing the reopening of economies around the world, there remains significant pent-up demand globally, particularly across our industrial and consumer end markets. Many industries continue to see elevated order backlogs coupled with low inventory levels as supply chain s struggle to keep up with robust demand. These supply chain disruptions are expected to persist, which will certainly prolong the ability to restock inventories across most value chains.
As a result, we expect tighter than forecasted market conditions to continue of strengthened by China’s recent dual control policy that has impacted both coal-to – olefins and methanol-to – olefins base capacity, which represent more than 30% of China’s total polyethylene production. 2022 GDP growth forecast are well above historical averages in most areas of the world, as industries ramp up to match the robust consumer demand with further upside as global chip shortages continue to extend the recovery in manufacturing.
Industrial Intermediates & Infrastructure, our de – bottlenecking project to add 60,000 metric tons per year of analine will be fully online by year end. And earlier this year, we signed an MOU for a new South China hub to advance local supply and formulating capabilities to serve the fast-growing Asia-Pacific market. In Performance Materials and Coatings, we recently completed a capacity expansion at one of our silicone polymer plants, and by year-end, we will complete a new silicone sealant compounding unit to enable sustainable solutions for high performance building and infrastructure applications.
In addition, our operating investments are also expected to generate another billion dollars in EBITDA as we improve our production capabilities and shift our product mix to higher growth and higher value markets. For example, in Industrial Intermediates & Infrastructure, we’re increasing capabilities and shifting our mix toward higher-margin Polyurethane systems for mobility and consumer applications
Jim Fitterling
Thank you, Howard. Turning to Slide 9. The strategy we outlined at our Investor Day builds on our long history of industry leadership. Our plan enables us to capture demand from sustainability drivers, achieve 0 scope 1 and 2 carbon emissions, and deliver meaningful, underlying earnings, and cash flow growth for years to come. Our path to decarbonize our footprint and grow earnings is a phased, side-by-side approach that both retrofits and replaces end-of-life assets with low carbon emission facility, while also expanding our capacity.
This plan will deliver a 30% reduction in our CO2 emissions between 2005 and 2030 through a disciplined approach that manages timing based on affordability, macro and regulatory drivers around the world. Our Texas 9 cracker proves that we can do this, and do it well, Texas 9 is 60% lower carbon intensity than any asset in our fleet. And that’s without any specific design for carbon capture or hydrogen. The project was delivered with 20% better capital efficiency and 12 months faster than any other crackers built in that wave. Overall, the project has a 65% lower conversion cost, is running consistently at more than a 110% of nameplate capacity and has delivered greater than 15% return on invested capital since startup.
We will leverage key learning from Texas 9 as we plan to build the world’s first ever net 0 carbon emissions ethylene cracker and derivatives complex in Fort Saskatchewan, Alberta, delivering approximately $1 billion in EBITDA, as Howard outlined earlier. This project will more than triple our ethylene and downstream derivative capacity at the site while decarbonizing emissions for 20% of our global ethylene capacity. We selected this site due to the availability of carbon capture infrastructure, advantaged feed stocks, and supportive government policies and incentives. On Slide 10, as we capture leads attractive growth opportunities, we’ll maintain our balanced and disciplined financial approach since spent.
We are committed to keeping CapEx at or below DNA, well below pre -spin levels while targeting return on invested capital above 13% across the economic cycle. We will continue to align our capital spend to the macroeconomic environment, our affordability, and return targets. Our investments align to three categories. First, we’ll maintain our foundation and maximize the return of our existing assets while ensuring safe and reliable operations. Second, we’ll execute our pipeline of faster payback, lower-risk incremental growth projects for downstream and sustainability driven applications, growing faster than GDP. And will invest approximately $1 billion per year to decarbonize our footprint and grow earnings. These investments enable us to capture increasing demand for low carbon footprint products, while de -risking the enterprise with lower emissions assets. In closing on slide 11, Dow is well-positioned to deliver significant long-term value for shareholders.
We have actions in place to both decarbonize our footprint and grow the enterprise. As we achieve an additional $3 billion in underlying EBITDA, maintain industry-leading cash flow generation, and drive towards 0 scope 1 and 2 carbon emissions. Our balanced capital allocation approach targets more than 13% return on invested capital. Keeps CapEx within DNA and returned 65% of net income to shareholders across the economic cycle. All of this is underpinned by our industry-leading portfolio, cost position, and strong track record of innovation that enables us to deliver differentiated products and solutions for our customers and a more sustainable world. With that, I’ll turn it back to Pankaj to open the Q&A.
John Roberts
Thank you. We see all the container ships out in the harbors and all the containers stacked up on the docks and the warehouses are full with drivers waiting to take product to the final customers. Your earlier comment was about polyethylene producer inventories. Do you worry about contained product down stream where it would seem like there’s a lot of inventory in the channel downstream of the converters.
Jim Fitterling
Hey. Good morning John. Yeah it’s — the visibility is hard to track right now. I do think that some of the moves that the government made recently to get the big ports 24/7 operation is going to help the backlog. What happens is typically when those ports get backlog, it spills over into other ports. We don’t use Long Beach as much, but when traffic spills over into other ports it hits us. I would say that almost every value chain has some impact from that, and where we see the biggest impact is being able — it’s kind of blocking material getting out.
And so we’re starting to see some congestion and some competing demand, product coming in. Sometimes it’s faster to reload and empty containers to get it back to China, and so that competes with other materials going out.We don’t see that in every quarter. But certainly on the west coast, we’re seeing that right now. I would say almost every value chain we have, every application we have is short product. And I don’t think there’s enough material tied up in all of that floating inventory or in the warehouses that that is going to alleviate the demand, or fill the demand that’s out there right now. I still think the consumer is strong and we’ve still got other economies that are coming back from COVID that are going to add to that demand.
Christopher Parkinson
Hi, this is for Chris. I was just wondering if you can touch a little bit between II&I and you mentioned third-party supply constraints. Can you just talk about what you’re seeing in terms of those third-party supply constraints and whether you see them easing into the fourth quarter and into the first half of next year, if it’s something that you continue to expect to persist throughout 2022? Thank you.
Jim Fitterling
They are primarily — the third party supply constraints are primarily industrial gas suppliers. They were racked pretty hard earlier in the year from the Texas freeze. And then they got hit again from the hurricanes in Louisiana. it is improving. I expect it will continue to improve through the quarter. And I think they’re working hard. I know they’re working hard to work on reliability and get the assets back up. And we’re working hard as well to make sure that we’ve got redundancy in those supplies. So we’ll take actions, like we do after events like those and make sure that we’ve got redundancy in supply as well. But that was the primary impact.
Matthew Blair
Hey, good morning. Thanks for squeezing me in here. Howard, I think you highlighted the feedstock flexibility in your crackers. Given the volatile energy markets, do you have any specific examples of the kind of changes you’ve been making. For example, are you switching away from propane either in the U.S. or in Europe, and then also if you have any thoughts on the recent widening of the ethane to natural gas spread? I think it’s out to about $0.08 a gallon. Do you see that, as kind of a short-term blip or perhaps something, maybe a little bit more medium term. Thanks.
Jim Fitterling
No, go ahead, Howard
Howard Ungerleider
Jim, look at me. So I will take that. Look, I would just say this, our feedstock selection ability is really a key enabler of our consistent outperformance versus our peers as you’ve seen in the last several years of our annual benchmarking. It includes what I would say is unmatched feedstock flexibility for most of our feet. We’ve got the ability to max ethane on the U.S. Gulf Coast. We also have propane. We can do minimum naphtha if we need to. In Europe, we also have the ability to do max LPG to your point made propane is not necessarily in the slate right now. So you’re not doing that in Europe.
But then you also look at the point that Jim made earlier, which is we’ve got our Canadian advantage. We’ve got the feedstock flexibility in U.S. Gulf Coast. We’ve got the Argentinean advantage and we also have the Middle East. And I also think a lot of people talked about feedstock flexibility. But most of the time what that means is that they have three furnaces that can crack this feed, two furnaces that can crack this feed. When we talk feedstock flexibility it’s in-furnace flexibility. So we have the ability to switch within the furnace and we can do it — frankly, we can do it day by day. Typically, we do it every week. Do you have anything to add?
Jim Fitterling
I’m only going to add two things. It isn’t always the linear equation when you switch from cracking ethane to propane at these propane prices. Some might expect that propane was out of the crack slate. And actually, we’ve been cracking a fair amount of propane because we’re generating a lot more byproducts out of that and we need them all. And so it has been in the slate more than you might expect. And I think as the natural gas prices moderate going into the year, we’re going to see that ethane and propane advantage in the U.S. Gulf Coast is going to be there.
October 21, 2021
ILMA ’21: US trucking issues here to stay
Author: Amanda Hay
2021/10/12
PHOENIX (ICIS)–Trucking issues topped a long list of supply-chain concerns at the Independent Lubricant Manufacturers Association (ILMA) annual meeting and there are few signs of relief.
“This is a challenge like we’ve never seen before,” Bob Costello, chief economist and senior vice president at the American Trucking Associations (ATA), told delegates at Tuesday’s Managing Shipping and Transportation Challenges session.
Costello pointed to year-on-year strength in three main drivers of truck freight: Retail sales (up 20.6%), single-family housing starts (up 23.2%) and manufacturing output (up 7.6%).
“These are not only increasing, they’re increasing nicely,” Costello said, adding that inventories at the retail level are near historic lows.
Manufacturing output is slowing a bit and Costello’s forecast is just under 7% for the year.
How are loads down?
“Supply, supply, supply,” Costello said, meaning availability of both trucks and truck drivers.
Total for-hire contract revenue per mile is up 17.5% in August/September.
“We’ve never seen this,” he said, adding that spot market rates are up by 25.5% for those two months.
Yet fleet counts are declining, with a 5.5% decline in 2021 compared with 2020, which itself was down 2.4% from 2019, according to ATA data.
Trucking lines are reducing truck counts because of the inability to add drivers, selling parked trucks and independent contractors going to the spot market.
“If you were to go back in time and show me this slide (5.5% reduction in 2021), I’d say we’re in a recession,” Costello said. “Obviously, we’re not. We can’t get enough drivers.”
Costello said one ATA member typically buys 100 new trucks every year, but this year they will get none.
Part of the issue is chip shortages, but Costello said that a large original equipment manufacturer (OEM) said that the chip shortage is masking several other supply-chain issues.
“I’ve got fleets telling me they can sell a three-year-old tractor for almost as much as they bought it for new,” Costello said.
Additionally, companies are taking parts from other trucks to keep fleets moving, he said.
Costello said the driver shortage is not new, but is getting worse and driven by demographics and lifestyle.
The average age of long-haul truck drivers is well over 50 and predominantly male, despite females accounting for 47% of the US workforce. New trainees average 35 years old, so the age issue is not improving.
Lifestyle is growing as an inhibitor to attracting drivers, who would rather spend more time at home and be freer in their downtime – meaning they would rather not be drug and alcohol tested – Costello said.
With drivers leaving the industry, the average weekly earnings are increasing at five times the historical average, Costello said, but it goes only so far.
“The best we have done is stop the hemorrhaging,” he said.
Long-haul drivers were down by 21,200 in 2020 and another 200 in 2021, while local truck drivers rose by 5,000 in 2020 and 11,700 in 2021, according to the ATA.
E-commerce delivery workers have grown from 555,000 in 2017 to nearly a million in 2021. These jobs allow workers to be at home every night and they do not randomly drug test like long-haul companies, Costello said.
Jim Mancini, vice president of North American surface transportation for CH Robinson, echoed Costello in saying supply is the main driver.
The trucking market is seeing high fleet utilisation and when that happens, any disruption has an exponential impact on shippers.
Weather and other disruptions, particularly on the Gulf Coast, take months to improve compared with a couple of days previously when the market was not as tight.
Moving to other modes, like rail, does not help as the interdependency creates further disruption, he said, adding that labour shortages result in load/unload times ballooning to two to three hours.
Neither speaker sees improvement in the near term.
“The only way this gets better is the economy slows down, but I don’t see that happening,” Costello said.
Mancini stressed the importance of being flexible, spreading out shipments through the week and optimising your equipment’s use in a day.
“Do everything you can to eliminate waste in load/unload times,” he said.
Asked about driverless technology, Costello said it is moving along and he expects to see an autopilot option for highway trucking in three to five years.
“If any of you are waiting for autonomous trucks, you’ll be out of business. You are not going to take the driver out of the seat for a very, very long time.”
The ILMA annual meeting runs through Tuesday in Phoenix, Arizona.
Focus article by Amanda Hay