The Urethane Blog
Everchem Updates
VOLUME XXI

September 14, 2023
Everchem’s exclusive Closers Only Club is reserved for only the highest caliber brass-baller salesmen in the chemical industry. Watch the hype video and be introduced to the top of the league: — read more
January 16, 2024
LEGGETT & PLATT ANNOUNCES RESTRUCTURING PLAN TO DRIVE IMPROVED PERFORMANCE AND PROFITABLE GROWTH
Jan. 16, 2024 7:00 AM ETLeggett & Platt, Incorporated (LEG)
CARTHAGE, Mo., Jan. 16, 2024 /PRNewswire/ —
- Continuing to adapt Bedding Products strategy to advance innovative, higher-value content and provide additional product solutions for our customers
- Optimizing manufacturing and distribution footprint to enhance the efficiency of our business while maintaining ability to service our customers
- Executing plan initiatives expected to generate $40 to $50 million of annualized EBIT benefit when fully implemented in late 2025
- Withdrawing company’s long-term financial targets
- Recording an estimated $450 million long-lived asset impairment charge in 4Q23 related to prior year acquisitions in Bedding Products segment
Diversified manufacturer Leggett & Platt (LEG) announced that it is implementing a Restructuring Plan primarily in its Bedding Products segment and to a lesser extent, in its Furniture, Flooring & Textile Products segment. In response to evolving markets, the Company is taking actions to improve manufacturing and distribution efficiency, advance its product strategy, and further support customer needs. These actions are expected to generate $40 to $50 million in EBIT benefit on an annualized run-rate basis when fully implemented in late 2025.
President and CEO Mitch Dolloff commented, “We are taking actions to create a more focused, agile organization with a portfolio of products and operating footprint aligned with the markets we serve. The bedding market has experienced unprecedented change in recent years and the competitive landscape has continued to evolve. Reshaping our Bedding Products strategy is expected to better position us for long-term success as the leading provider of bedding solutions across the value chain. In addition, optimizing our operating footprint in both Bedding Products and Furniture, Flooring & Textile Products will reduce complexity and enhance the efficiency of our business. Looking forward, we expect to advance key product growth, improve profitability, and drive enhanced value for customers and shareholders.”
OVERVIEW OF INITIATIVES
The major Bedding Products initiatives that are part of the Restructuring Plan include:
- Refocusing Strategy: We are continuing to reshape our Bedding Products business to focus on innovative, higher-value content, driven by customer and end-consumer needs. We are proud of our long history of providing product solutions our customers value and see further opportunities to do so in both innersprings and specialty foam, from components to private label finished goods.
- Optimizing Manufacturing and Distribution Footprint: We plan to consolidate certain locations across the Bedding Products segment, reducing our manufacturing and distribution footprint of 50 facilities to approximately 30 to 35 facilities. Creating a new and more efficient regional distribution network will support our ability to maintain sufficient manufacturing capacity in fewer, higher-output facilities to effectively serve our customers and better align with anticipated future market demand. These actions should allow us to integrate our specialty foam and innerspring capabilities while maintaining market- leading service and product quality levels and improving overall efficiency.
The initiatives outlined above are expected to enable profitable growth through expanded product capabilities and increased content at attractive price points, reduce costs, and create shareholder value.
In Furniture, Flooring & Textile Products we plan to consolidate a small number of production facilities in Home Furniture and Flooring Products to better align capacity with regional demand and drive operating efficiencies.
FINANCIAL IMPACT
In total, the initiatives are expected to reduce annual sales by approximately $100 million and generate $40 to $50 million in EBIT benefit on an annualized run-rate basis when fully implemented in late 2025, with some of the benefit starting to be realized in the second half of 2024. Additionally, we anticipate receiving approximately $60 to $80 million in net cash proceeds from the sale of real estate associated with the initiatives, with transactions largely complete by the end of 2025.
We expect to incur restructuring and restructuring-related costs of $65 to $85 million, of which approximately half are anticipated to be incurred in 2024 and the remainder in 2025. This includes $30 to $40 million in cash costs, the majority of which are anticipated to be incurred in 2024. In the first half of 2024, we anticipate $20 to $25 million of restructuring and restructuring-related costs (approximately half in cash costs).
LONG-TERM FINANCIAL TARGETS
In connection with the Restructuring Plan, we are withdrawing our previously stated Total Shareholder Return goal of 11–14% and financial targets, including revenue growth, EBIT margin, and dividend payout ratio. Revised financial targets will be issued at a future date. We are not changing our objectives of maintaining our investment grade debt ratings and our current dividend practices.
FOURTH QUARTER 2023 IMPAIRMENT CHARGE
In addition, but unrelated to the Restructuring Plan, we are impairing an estimated $450 million of long-lived assets (primarily intangibles) associated with prior year acquisitions in the Bedding Products segment. Prolonged weak demand and changing market dynamics have created disruption and financial instability for some of our customers. As a result, recent efforts by certain customers to improve their financial position are expected to reduce our future sales and earnings. We are not otherwise updating guidance for, or reporting upon, our fourth quarter 2023 or full year 2023 financial results. These financial results and 2024 full year guidance will be released on February 8, 2024.
January 10, 2024
Chemical Deal Results
| Seller | Buyer | Business | Date |
|---|---|---|---|
| OCI NV | Koch | Iowa Fertilizer’s nitrogen fertilizer complex (including ammonia, urea, urea ammonium nitrate) – $3,600v | 4th Quarter 2023 |
| TLC Ingredients | Shrieve Chemical | distribution of food ingredients, industrial chemicals, and phenolic resins | 4th Quarter 2023 |
| American Chemie | TR International | distribution | 4th Quarter 2023 |
| OpenGate Capital | Samyang Holdings | Verdant Specialty Solutions (surfactants for personal care products and industrial applications) – $210s/$250v | 4th Quarter 2023 |
| Ampac Intermediate Holdings | NewMarket Corporation | American Pacific (additives used in solid rocket motors for space launch and military defense applications) – $700v | 4th Quarter 2023 |
| Lyondell | Ineos | ethylene oxide and derivatives business, including a plant at Bayport, TX – $700v | 4th Quarter 2023 |
| Teckrez | Hidden Harbor Capital | tackifier resins and acrylic monomer solutions | 4th Quarter 2023 |
| Aquapharm Chemicals | PCBL | water treatment chemicals – $250s/$455v | 4th Quarter 2023 |
| IFF | Clariant | personal care ingredients maker Lucas Meyer Cosmetics and another ingredient brand, IBR – $810v | 4th Quarter 2023 |
| Polymax | Geon | thermoplastic elastomer (TPE) materials | 4th Quarter 2023 |
| Seller | Buyer | Business | Date |
|---|---|---|---|
| International Protein Colloids | Gum Products International (Benford Capital) | gelatin and other protein blends for pet treat and pet food applications | 4th Quarter 2023 |
| Eager Polymers | Reynolds Advanced Materials | distribution business in mold-making materials, epoxies and urethanes. | 4th Quarter 2023 |
| Incitec Pivot | CF Industries | ammonia production complex in LA | 4th Quarter 2023 |
| Chemtrade | Trecora | lubricant additives – $43v | 4th Quarter 2023 |
| Valley Paint | Rodda Paint | industrial coatings | 4th Quarter 2023 |
| Strohmeyer & Arpe | Gehring Montgomery | wax division for the US market. | 4th Quarter 2023 |
| Lubrizol | Coast Southwest | surfactants plant in CA | 4th Quarter 2023 |
| Core Industrial Partners | SK Capital | J&K Ingredients (food ingredients) | 4th Quarter 2023 |
| HIG Capital | CapVest Partners | Recochem (branded, private label and bulk automotive aftermarket and household fluids used in consumer and industrial applications) | 4th Quarter 2023 |
| MF Paints | Protech | architectural paints and stains | 4th Quarter 2023 |
| Seller | Buyer | Business | Date |
|---|---|---|---|
| West Penetone | OpenGate Capital (IPG) | specialty cleaners and degreasers for military and aerospace applications | 4th Quarter 2023 |
| Gilbert & Jones | Shrieve Chemical | distribution | 4th Quarter 2023 |
http://www.chemicaldeals.com/Results.aspx?searchtext=&quarter=4th+Quarter+2023
January 8, 2024
De-industrialisation in Germany dramatically reduces emissions in 2023

Germany led Europe in reducing emissions in 2023, but the fall had more to do with the painful de-industrialisation the country is going through as a result of the end of cheap Russian gas rather than green policies. / bne IntelliNews
By bne IntelliNewsJanuary 5, 2024
Germany led the way in reducing emissions in 2023, but the fall had more to do with the dramatic de-industrialisation due to the effects of the war in Ukraine and soaring energy costs than it did with green policies.
Greenhouse gas emissions in Germany fell by approximately 20% in 2023, reaching their lowest level since the 1950s, according to a report by Berlin-based think-tank Agora Energiewende, as reported by the Financial Times on January 4.
The country emitted 673mn tonnes of carbon dioxide equivalent in 2023, with about half of the reduction attributed to a decline in coal-fired power generation.
However, emissions from the construction and transport industries remained largely unchanged in 2023, following several years of failure to reach reduction targets. The chemical industry, Germany’s third largest industrial sector, has also lost 23% of its production volume within two years, Handelsblatt reports. As a result, Germany is expected to miss EU-wide emission reduction goals as set out under the so-called Effort Sharing Regulation, Agora said.
Leading industrial managers in the German chemistry are sceptical as to whether the industry will be able to return to the production volume of 2021 in the next few years. “We are in the middle of a deep, long valley,” Markus Steilemann, president of the Chemical Industry Association (VCI) and CEO of Covestro, told Handelsblatt, one of Germany’s leading business newspapers.
0124 EURO German chemical production index HANDELSBLATT
This failure highlights that the headline reduction in emissions has more to do with Germany’s economic slowdown than successful implementation of green policies. Lethargic German industrial activity, influenced by the war in Ukraine and energy price crises, played a crucial role, accounting for half of the emissions drop, the report found, whereas the growth in renewable energy contributed 15% to the fall in emissions.
However, the leading German industrial companies report that the fall in customer orders since spring 2023 is now slowing and the market appears to be finding a new, albeit lower, equilibrium, according to leading suppliers such as BASF and the world’s largest chemical retailer Brenntag. But that’s not enough to create any optimism, because there is a lack of real growth. German companies’ hopes are based on a slow recovery starting in the second half of 2024.
As reported by bne IntelliNews, the sanctions on Russia and the halt in delivery of Russian piped gas after the Nord Stream 1 & 2 gas pipelines were destroyed last September have had a heavy impact on Germany’s heavy industry.
Accounting for about a quarter of German GDP – twice the level of other large European powers – some 10% of heavy industry has been forced to close down or dramatically reduce production.
German chemical companies are now very cautious when it comes to investing at home: around 40% of them will reduce their investments in Germany in 2023 and 2024, according to recent industry survey. However, the majority of companies are planning to increase foreign investments or leave completely.
Up to a third of Germany’s heavy industry is either planning to move, or has already started the process of moving, abroad to lower-cost markets. The biggest hope for the chemical industry is China, where almost half of global chemical demand already comes from.
The German industrial lobby has said that German heavy industry should start recovering in 2025, but that assumes energy prices will fall to previous levels. A recent IMF white paper concluded that the higher prices, caused by the remake of Europe’s energy markets and the end of cheap Russian gas imports, means the higher energy prices are likely to be a permanent change that will fundamentally affect Germany’s business model.
Germany’s economy has already stalled as a result of the seismic changes to its economic make-up. Agora said that while preliminary figures showed German economic output dropped 0.3% in 2023, the equivalent figure for energy-intensive production in industries such as chemicals and steel was 11%, the FT reports.
German Vice-Chancellor Robert Habeck acknowledged the decline in fossil fuel use but highlighted the importance of distinguishing between the impact of the war and energy price crises on industrial production. He emphasised the need to maintain Germany as a strong industrial location while transitioning to climate neutrality.
Siegfried Russwurm, president of Germany’s industrial lobby, criticised the government for not grasping the critical situation facing manufacturing businesses, the FT reported. Rising energy costs and a lack of government support were identified as challenges for industries aiming to be both green and globally competitive.
Agora Energiewende stressed the importance of preventing emissions from being relocated abroad and called for a stable framework to encourage investment in climate-friendly technologies. The think-tank highlighted the need for an “investment offensive” to achieve long-term goals, including the rollout of hydrogen pipelines and improvements to electricity grids.
While the 21% drop in emissions is a positive development, after Germany shuttered its six nuclear power stations last year it has been forced to start importing electricity. However, that also contributed to the drop in its emissions, as almost half of electricity imports came from renewable sources, mainly hydro and wind, and another quarter from nuclear. Coupled with a 5% increase in domestic renewable energy supplies thanks to record solar and wind production investments, this took the share of total renewable energy in Germany to more than 50% for the first time.
https://intellinews.com/de-industrialisation-in-germany-dramatically-reduces-emissions-in-2023-306518
January 7, 2024
Visualizing 50 Years Of Video Game Revenues, By Platform
by Tyler Durden
Sunday, Jan 07, 2024 – 08:45 AM
Video killed the radio star.
And the video game industry’s explosive growth over the last five decades has killed any skepticism of its strength and staying power in the larger media and entertainment space.
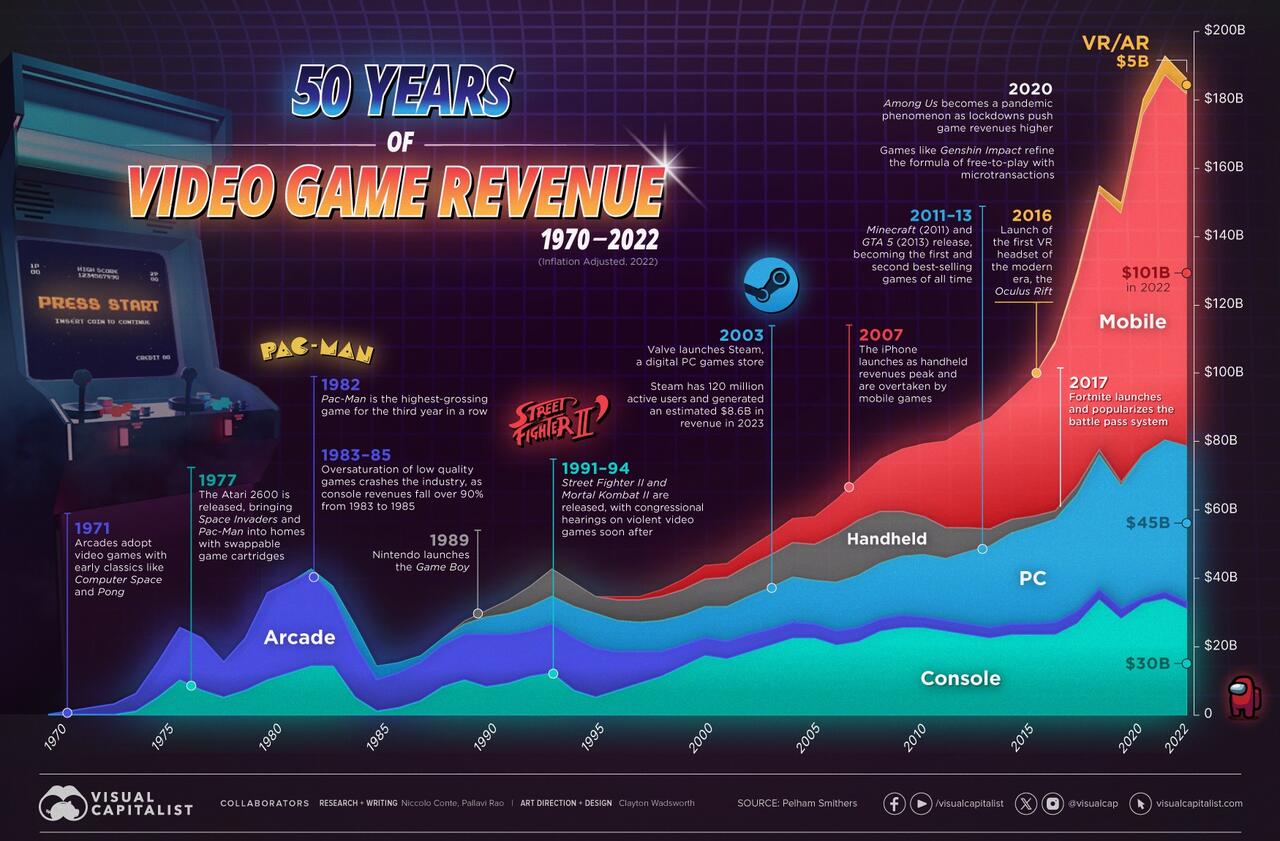
Visual Capitalist’s Pallavi Rao and Niccolo Conte visualize the video game industry’s inflation-adjusted revenues every year, from its humble beginnings in 1970 to the media juggernaut it is now, worth more than $180 billion of revenue in 2022.

All data presented in the chart and in this article was provided by UK-based market intelligence firm Pelham Smithers.
| Year | Total Game Industry Revenue (USD, Billions) | % Increase (YoY) |
|---|---|---|
| 1970 | $0 | N/A |
| 1971 | $1 | N/A |
| 1972 | $2 | 100% |
| 1973 | $3 | 50% |
| 1974 | $6 | 100% |
| 1975 | $15 | 150% |
| 1976 | $25 | 67% |
| 1977 | $22 | -12% |
| 1978 | $15 | -32% |
| 1979 | $22 | 47% |
| 1980 | $35 | 59% |
| 1981 | $38 | 9% |
| 1982 | $42 | 11% |
| 1983 | $37 | -12% |
| 1984 | $26 | -30% |
| 1985 | $14 | -46% |
| 1986 | $15 | 7% |
| 1987 | $17 | 13% |
| 1988 | $22 | 29% |
| 1989 | $27 | 23% |
| 1990 | $30 | 11% |
| 1991 | $33 | 10% |
| 1992 | $37 | 12% |
| 1993 | $42 | 14% |
| 1994 | $38 | -10% |
| 1995 | $34 | -11% |
| 1996 | $34 | 0% |
| 1997 | $34 | 0% |
| 1998 | $36 | 6% |
| 1999 | $39 | 8% |
| 2000 | $43 | 10% |
| 2001 | $44 | 1% |
| 2002 | $48 | 10% |
| 2003 | $52 | 8% |
| 2004 | $57 | 9% |
| 2005 | $57 | 1% |
| 2006 | $62 | 9% |
| 2007 | $68 | 10% |
| 2008 | $74 | 8% |
| 2009 | $77 | 4% |
| 2010 | $78 | 2% |
| 2011 | $79 | 1% |
| 2012 | $83 | 5% |
| 2013 | $85 | 3% |
| 2014 | $91 | 7% |
| 2015 | $97 | 6% |
| 2016 | $108 | 11% |
| 2017 | $128 | 19% |
| 2018 | $152 | 19% |
| 2019 | $147 | -3% |
| 2020 | $177 | 20% |
| 2021 | $190 | 7% |
| 2022 | $183 | -4% |
Note: Numbers are rounded to the nearest billion.
From an industry that was nearly wiped out by a market crash, to the highest-earning media sector today, video games have had a tumultuous journey.
As medium has evolved, so too have the consumer preferences for different gaming platforms. Which formats led the overall industry’s revenue growth through the years?
Arcades, Home Consoles, Handheld Gaming
The history of mass-market consumer-oriented video games starts with Atari.
The company that released Computer Space (1971) and Pong (1972) on coin-operated arcade machines took the market by storm, spawning a series of competitors, earning an estimated $35-40 per day, and selling nearly 8,000 units in two years.
For an industry that barely existed until a couple years prior, those numbers spurred the inception of video games as a legitimate (and profitable) form of entertainment.
| Year | Arcade Revenues (USD, Billions) | Console Revenues (USD, Billions) | Handheld Revenues (USD, Billions) |
|---|---|---|---|
| 1970 | $0 | N/A | N/A |
| 1971 | $1 | N/A | N/A |
| 1972 | $2 | N/A | N/A |
| 1973 | $3 | N/A | N/A |
| 1974 | $5 | $1 | N/A |
| 1975 | $10 | $5 | N/A |
| 1976 | $15 | $10 | N/A |
| 1977 | $15 | $7 | N/A |
| 1978 | $10 | $5 | N/A |
| 1979 | $15 | $7 | N/A |
| 1980 | $25 | $10 | N/A |
| 1981 | $26 | $12 | N/A |
| 1982 | $27 | $14 | N/A |
| 1983 | $20 | $14 | N/A |
| 1984 | $15 | $5 | N/A |
| 1985 | $9 | $1 | N/A |
| 1986 | $10 | $2 | N/A |
| 1987 | $11 | $4 | N/A |
| 1988 | $12 | $8 | N/A |
| 1989 | $13 | $10 | $1 |
| 1990 | $15 | $8 | $2 |
| 1991 | $14 | $9 | $4 |
| 1992 | $13 | $11 | $6 |
| 1993 | $14 | $12 | $8 |
| 1994 | $15 | $7 | $7 |
| 1995 | $14 | $5 | $5 |
| 1996 | $11 | $7 | $6 |
| 1997 | $9 | $9 | $7 |
| 1998 | $7 | $11 | $7 |
| 1999 | $6 | $14 | $8 |
| 2000 | $5 | $17 | $8 |
| 2001 | $5 | $16 | $9 |
| 2002 | $5 | $18 | $9 |
| 2003 | $5 | $20 | $10 |
| 2004 | $5 | $22 | $10 |
| 2005 | $4 | $22 | $11 |
| 2006 | $4 | $20 | $14 |
| 2007 | $4 | $21 | $16 |
| 2008 | $4 | $24 | $15 |
| 2009 | $4 | $25 | $13 |
| 2010 | $3 | $25 | $11 |
| 2011 | $3 | $24 | $9 |
| 2012 | $3 | $23 | $7 |
| 2013 | $3 | $22 | $5 |
| 2014 | $3 | $23 | $4 |
| 2015 | $3 | $23 | $3 |
| 2016 | $4 | $23 | $3 |
| 2017 | $4 | $26 | $3 |
| 2018 | $3 | $33 | $2 |
| 2019 | $3 | $28 | $1 |
| 2020 | $2 | $32 | $0 |
| 2021 | $2 | $33 | $0 |
| 2022 | $2 | $30 | $0 |
| Share of Total Industry Revenue in 2022 | 1.1% | 16.6% | 0.0% |
Note: Numbers are rounded to the nearest billion.
Within just seven years, thanks to the proliferation of arcade games, the video game industry generated more revenue than the American box office and music industry put together.
Then, in the 1980s, a once little-known playing card company in Japan released one of the best-selling video game franchises ever, Super Mario Bros on their home console the Nintendo Entertainment System (NES).
A few years later, at the cusp of the ’90s, Nintendo released the iconic Game Boy on which enthusiasts could play Tetris—a popular arcade game—from the comfort of their bed, cementing video games’ place in consumers’ homes.
PC Gaming, Mobile Gaming, and Virtual Reality
By the ’90s, another technological boom was taking place: the rise of personal computing.
Naturally, companies developed video games (like Doom, Prince of Persia, Dangerous Dave) for this new platform, taking advantage of increased computing power, bigger screens, and more flexibility in programming.
While home consoles still accounted for the majority share of the industry’s revenues, handheld devices and PC gaming split the difference as arcade revenues began to drop rapidly.
| Year | PC Revenues (USD, Billions) | Mobile Revenues (USD, Billions) | VR/AR Revenues (USD, Billions) |
|---|---|---|---|
| 1982 | $1 | N/A | N/A |
| 1983 | $3 | N/A | N/A |
| 1984 | $6 | N/A | N/A |
| 1985 | $4 | N/A | N/A |
| 1986 | $3 | N/A | N/A |
| 1987 | $2 | N/A | N/A |
| 1988 | $2 | N/A | N/A |
| 1989 | $3 | N/A | N/A |
| 1990 | $5 | N/A | N/A |
| 1991 | $6 | N/A | N/A |
| 1992 | $7 | N/A | N/A |
| 1993 | $8 | N/A | N/A |
| 1994 | $9 | N/A | N/A |
| 1995 | $10 | N/A | N/A |
| 1996 | $9 | $1 | N/A |
| 1997 | $9 | $1 | N/A |
| 1998 | $9 | $2 | N/A |
| 1999 | $9 | $3 | N/A |
| 2000 | $9 | $4 | N/A |
| 2001 | $10 | $4 | N/A |
| 2002 | $11 | $5 | N/A |
| 2003 | $12 | $6 | N/A |
| 2004 | $13 | $7 | N/A |
| 2005 | $13 | $8 | N/A |
| 2006 | $14 | $10 | N/A |
| 2007 | $15 | $12 | N/A |
| 2008 | $16 | $15 | N/A |
| 2009 | $17 | $18 | N/A |
| 2010 | $18 | $21 | N/A |
| 2011 | $18 | $25 | N/A |
| 2012 | $21 | $29 | N/A |
| 2013 | $23 | $32 | N/A |
| 2014 | $26 | $35 | N/A |
| 2015 | $28 | $40 | N/A |
| 2016 | $30 | $48 | $1 |
| 2017 | $34 | $60 | $2 |
| 2018 | $39 | $74 | $2 |
| 2019 | $35 | $77 | $3 |
| 2020 | $41 | $98 | $5 |
| 2021 | $44 | $105 | $6 |
| 2022 | $45 | $101 | $5 |
| Share of Total Industry Revenue in 2022 | 24.5% | 55.3% | 2.5% |
Note: Numbers are rounded to the nearest billion.
However, handheld gaming revenues peaked in 2007, the year the iPhone launched, and have steadily declined since then as smartphone adoption has grown.
With smartphones came the mobile gaming juggernaut, which has made up more than half of the gaming industry’s revenues since 2019.
In the last few years however, the development of augmented and virtual reality’s more immersive, and sensory-heavy experiences have created yet another platform for video games, and yet another avenue for growth.
https://www.zerohedge.com/technology/visualizing-50-years-video-game-revenues-platform
January 4, 2024
Spot Container Rates Surge By 173% Due To Red Sea Disruptions
by Tyler Durden
Thursday, Jan 04, 2024 – 07:45 AM
Drone and missile attacks by Yemen’s Iran-backed Houthi militants on commercial vessels in one of the world’s busiest shipping lanes have resulted in firms sending ships around the Cape of Good Hope, entirely avoiding the Red Sea region. Reroutings have added a week or more to sailings, thus straining cargo capacity, which, in return, has sent containerized shipping rates soaring.
Bloomberg cites new data from Freightos, a cargo booking and payment platform, that shows the spot rate for a 40-foot container from Asia to northern Europe has jumped 173% to $4,000 since mid-December.
The price for a 40-foot container from Asia to the Mediterranean has increased to $5,175, as reported by Freightos. Additionally, they noted that major shippers have announced even higher prices, surpassing the $6,000 mark for this route in the next two weeks. Shipping rates from Asia to the East Coast of North America also soared 55% to $3,900.
The Red Sea connects to Egypt’s Suez Canal and is the fastest way to transport consumer goods, petroleum products, and food from Asia and the Middle East to Europe and North America. About 10% to 12% of global trade flows through the critical waterway.
On Wednesday, no container ships with destinations to North America and Europe were transiting the Red Sea. These vessels were rerouted to Africa’s southern Cape of Good Hope to avoid the attacks – adding anywhere from 7 to 20 days to their voyages. This indicates that the Pentagon’s Operation Prosperity Guardian has failed to protect commercial vessels in the region.

Spot container rates are moving higher because diversions around the Cape of Good Hope add extra time to sailings, reducing capacity.
New data from the International Monetary Fund’s PortWatch platform, produced with Oxford University, shows that for the ten days through Monday, sails through the vital Suez Canal trade route plunged 28% compared with a year earlier. This means about 3.1% of global trade has been rerouted from the Red Sea.
Even though container prices are far off Covid highs, prices are more than double from early 2019 levels and come at a time when central banks have unleashed more than a year of interest rate hikes to combat inflation.
Meanwhile, Red Sea disruptions are spreading across the shipping industry, leading to a surge in oil tanker shipping costs.
Shipbroker Braemar said daily shipping costs for a tanker from the Mediterranean to Japan through the Suez jumped from $8,000 a day in early December to $26,000 earlier this week.
“Any route involving the Red Sea is red hot,” the Braemar analysts said.
In a separate note, Goldman’s Daan Struyven shows oil flows via tankers through the Bab-El-Mandeb strait at the southern end of the Red Sea have plunged.
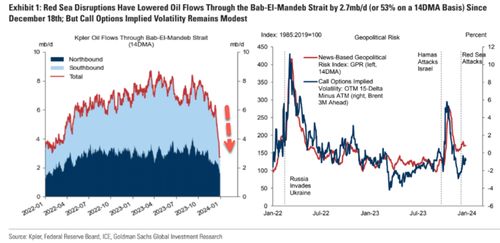
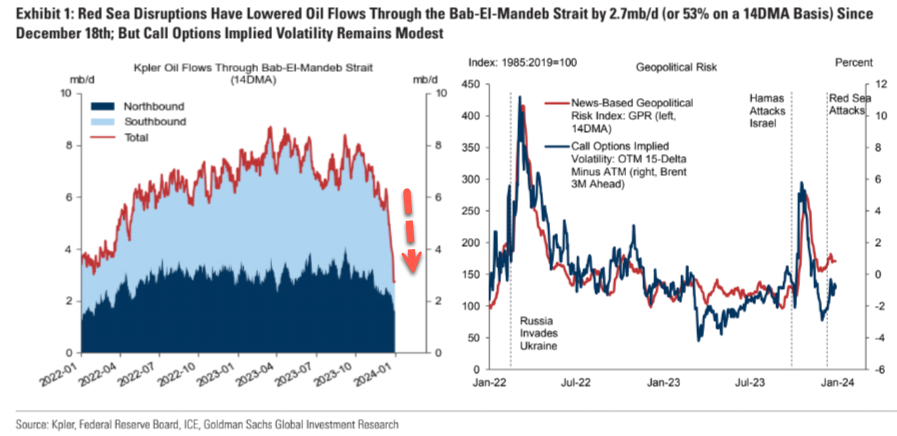
Struyven said, “We estimated a potential $3-4/bbl boost to crude prices from a hypothetical prolonged and full redirection of all oil flows through the Bab-El-Mandeb strait at the southern end of the Red Sea…”
The biggest fear for energy prices, shipping costs, and supply chains is if a regional conflict erupts across the Middle East.
https://www.zerohedge.com/commodities/spot-container-rates-surge-173-due-red-sea-disruptions