The Urethane Blog
Everchem Updates
VOLUME XXI

September 14, 2023
Everchem’s exclusive Closers Only Club is reserved for only the highest caliber brass-baller salesmen in the chemical industry. Watch the hype video and be introduced to the top of the league: — read more
November 16, 2022
Los Angeles imports keep sinking as East Coast gains more ground
LA October imports fell 28% year on year, 2% month on month
· Tuesday, November 15, 2022

The Port of Los Angeles reported yet another month of falling volumes on Tuesday, as the import pendulum continues to swing away from the West Coast and toward container shipping gateways on the East and Gulf coasts.
Los Angeles’ total throughput for October came in at 678,429 twenty-foot equivalent units, down 25% versus October 2021.
Imports totaled 336,307 TEUs, down 28% year on year.
It was the lowest October import tally since 2009 amid the global financial crisis and the lowest monthly imports since May 2020 at the height of the COVID lockdowns. This October’s imports were down 14% from October 2019 prior to the pandemic.
On a positive note, the huge month-on-month slide seen in Los Angeles in September has slowed. Imports fell 15% in September versus August. October’s imports declined only 7,155 TEUs (i.e., a single shipload) or 2% versus September.
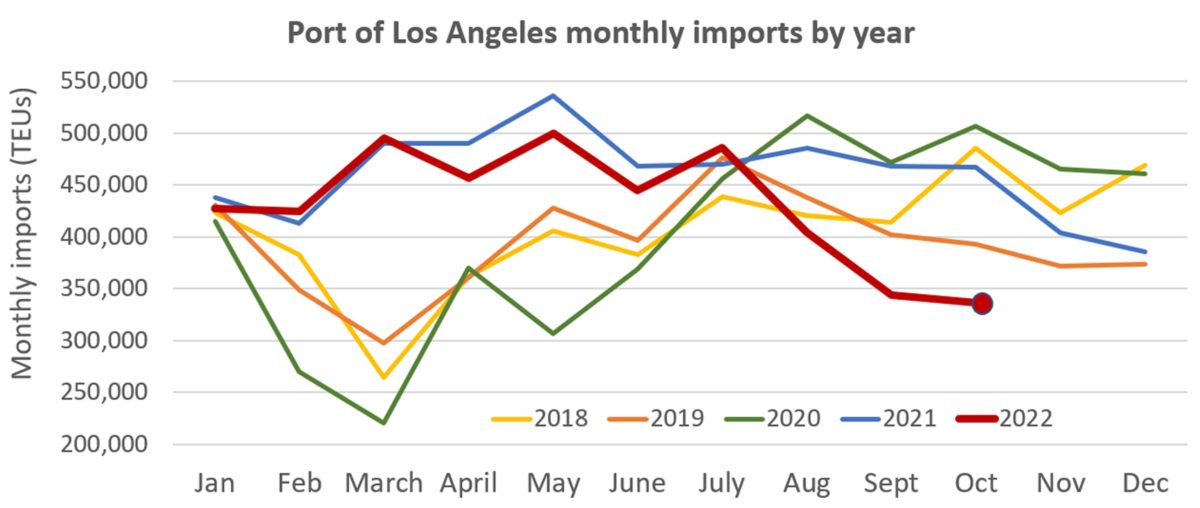
During Tuesday’s news conference, Port of Los Angeles Executive Director Gene Seroka said carriers “blanked” (canceled) 20 sailings in October, removing about 25% of normal service. An additional 20 sailings have been blanked in November and December combined.
“November numbers will be soft, and so will December,” Seroka acknowledged.
‘We need to get labor peace’
Seroka blamed “the steep decline” on three factors: a lack of a West Coast port labor contract, an early peak season and lower consumer spending on durables compared to purchases during the pandemic.
Both Seroka and Los Angeles Mayor Eric Garcetti repeatedly highlighted the labor issue during the news conference. The previous West Coast port labor agreement expired on July 1.
Seroka said that he has been on a “whistlestop tour” and “knocking on doors,” speaking to shippers and carriers in the U.S., Asia and Europe and “looking to get that allocation back to Los Angeles.” But he admitted that “it starts with getting a labor agreement … where they can feel that certainty of the cargo flow and getting to market on time.”
Garcetti stressed “we need to get labor peace and an agreement done.” However, he insisted “there will not be a strike. I don’t say this as someone trying to market [Los Angeles], but the remaining issues are so much more minor than in past years when we’ve been able to resolve this.”
Regarding the cargo shift to the East Coast and the Port of New York/New Jersey recently unseating Los Angeles as America’s busiest port, Seroka said, “We’ve been in the No. 1 position here for 22 consecutive years, and one or two months [in second place] is not going to create a trend. Our dwell times have improved and the ship backlog is nearly gone. We’re eager to ramp volume back up.”
Long Beach month-on-month decline worse than LA’s
Declines in Los Angeles were mirrored in the neighboring Port of Long Beach, highlighting the pressures facing West Coast ports.
On Thursday, Long Beach reported a 24% year-on-year drop in imports to 293,924 TEUs. It was the port’s lowest import number in any month since April 2020 at the beginning of the pandemic. It was Long Beach’s lowest import total for the month of October since 2012 and was down 13% from October 2019, pre-pandemic.
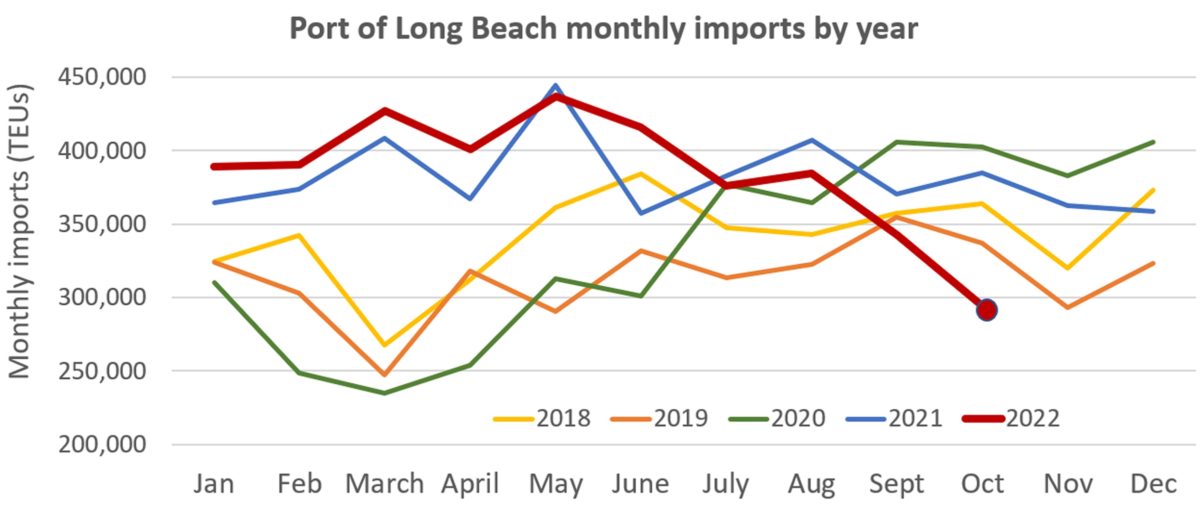
October imports sank 48,747 TEUs or 14% in October versus September, a much steeper month-on-month decline than in Los Angeles.
East Coast ports take more market share
The import picture at East and Gulf Coast ports remains in stark contrast to the situation at West Coast ports. These ports are still near their all-time highs.
On Monday, Savannah, Georgia, reported October imports of 263,828 TEUs, its second best monthly total ever behind the record reached in August. It was the port’s best-ever October for imports, up 2% year on year and up 32% from October 2019, pre-COVID.
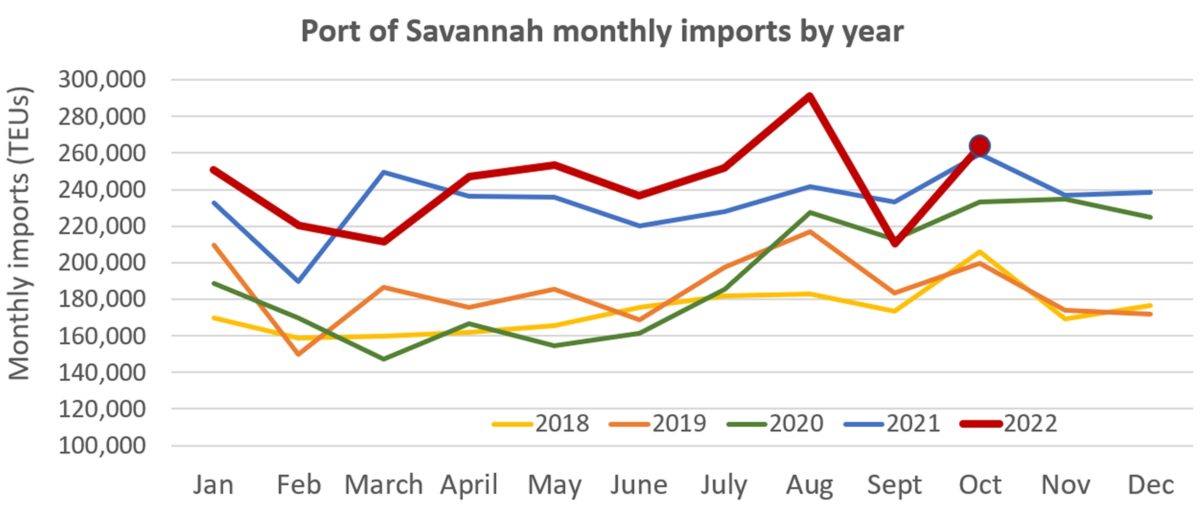
Savannah posted an increase of 53,461 TEUs or 25% in October versus September, when imports were depressed by the Hurricane Ian closure.
In its monthly release in October, the port said it expected to clear its anchorages by the end of November. That is proving too optimistic: As of Tuesday, there were still 33 container vessels at anchor off the coast of Georgia.
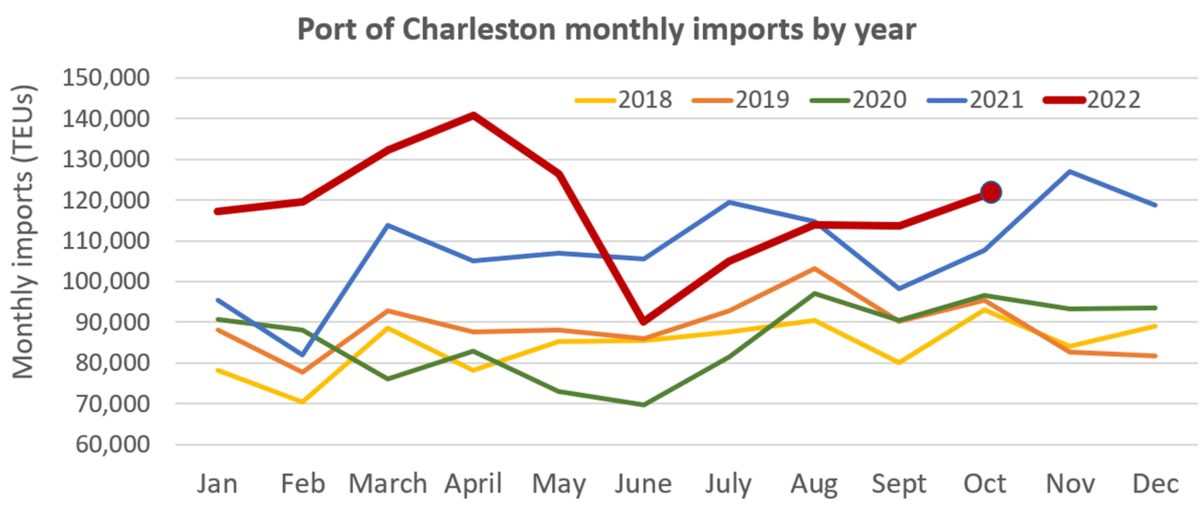
The Port of Charleston in South Carolina also reported its October throughput on Monday. Loaded imports came in at 121,305 TEUs, up 13% year on year, 7% month on month and 27% versus October 2019, pre-pandemic. It was Charleston’s best October for imports ever and its fifth-highest monthly import total.
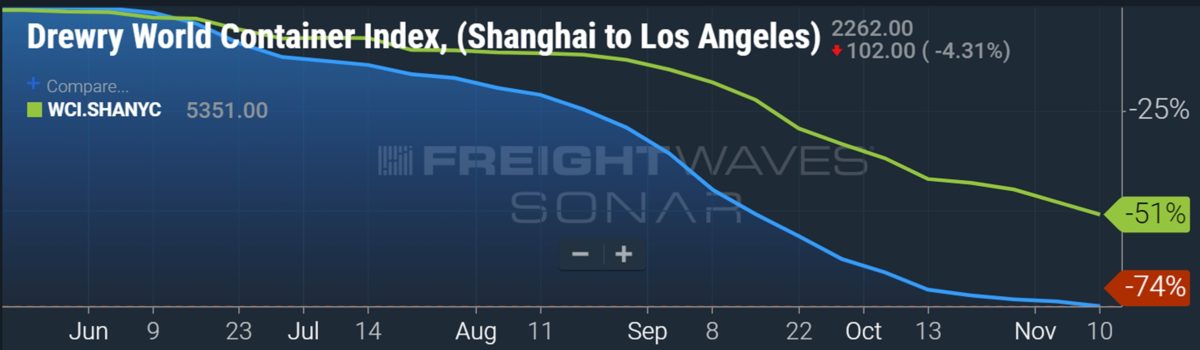
As a result of higher demand and greater congestion, spot rates to the East Coast have not fallen as fast as rates to the West Coast over the past six months. Blue line: Shanghai-Los Angeles. Green line: Shanghai-New York (Chart: FreightWaves SONAR)
November 14, 2022
With heavy hearts, we would like to inform everyone that our owner and founder, Lax Gupta, has passed. Lax developed innovative products that changed the Polyurea coatings industry. Going forward, we will continue honoring his passion, integrity and leadership. You will be missed, Mr. Gupta.
November 10, 2022
Speeches can be streamed, exhibit booths can be power-pointed and screen-shared, but it all pales in comparison to in-person networking. Trade shows are back!

Subscribe to the Urethane blog for more Everchem Updates here
November 7, 2022
Tempur Sealy Reports Third Quarter Results
Nov. 03, 2022 6:37 AM ETTempur Sealy International, Inc. (TPX)
Q3: 2022-11-03 Earnings Summary
EPS of $0.78 beats by $0.03 | Revenue of $1.28B (-5.52% Y/Y) misses by $7.51M
– Consolidated Sales Decreased 5.5%, Direct Channel Sales Increased 8.1%
– Reports EPS of $0.75 and Adjusted EPS(1) of $0.78
– Declares Fourth Quarter Dividend of $0.10 per share
LEXINGTON, Ky., Nov. 3, 2022 /PRNewswire/ — Tempur Sealy International, Inc. (NYSE: TPX) announced financial results for the third quarter ended September 30, 2022. The Company also issued updated financial guidance for the full year 2022.
THIRD QUARTER 2022 FINANCIAL SUMMARY
- Total net sales decreased 5.5% to $1,283.3 million as compared to $1,358.3 million in the third quarter of 2021. On a constant currency basis(1), total net sales decreased 3.1%, with a decrease of 5.4% in the North America business segment and an increase of 7.4% in the International business segment.
- Gross margin was 42.2% as compared to 42.5% in the third quarter of 2021. Adjusted gross margin(1) was 42.5% in the third quarter of 2022. There were no adjustments to gross margin in the third quarter of 2021.
- Operating income decreased 19.5% to $201.0 million as compared to $249.8 million in the third quarter of 2021. Adjusted operating income(1) was $206.7 million as compared to $252.1 million in the third quarter of 2021.
- Net income decreased 25.2% to $132.7 million as compared to $177.4 million in the third quarter of 2021. Adjusted net income(1) decreased 23.3% to $137.8 million as compared to $179.6 million in the third quarter of 2021.
- Earnings before interest, tax, depreciation and amortization (“EBITDA”)(1) decreased 16.9% to $245.4 million as compared to $295.2 million in the third quarter of 2021. Adjusted EBITDA(1) decreased 15.4% to $251.9 million as compared to $297.6 million in the third quarter of 2021.
- Earnings per diluted share (“EPS”) decreased 13.8% to $0.75 as compared to $0.87 in the third quarter of 2021. Adjusted EPS(1) decreased 11.4% to $0.78 as compared to $0.88 in the third quarter of 2021.
Company Chairman and CEO Scott Thompson commented, “Our third quarter results demonstrate the continued strength of our business model and industry-leading products, as they mitigated the unfavorable foreign exchange dynamic and overall challenging operating environment in the quarter. We performed largely in-line with our expectations while working through these headwinds. Over the last couple quarters, we have extended some capital project timelines, and trimmed around the edges, cutting back on expected hiring and expenses. Going forward, we will keep the current operating environment in mind as we drive our competitive advantages to outperform the global bedding market and position ourselves well for the market’s eventual normalization.”
Business Segment Highlights
The Company’s business segments include North America and International. Corporate operating expenses are not included in either of the business segments and are presented separately as a reconciling item to consolidated results.
North America net sales decreased 5.6% to $1,057.7 million as compared to $1,120.0 million in the third quarter of 2021. On a constant currency basis(1), North America net sales decreased 5.4% as compared to the third quarter of 2021. Gross margin was 39.8% as compared to 39.9% in the third quarter of 2021. Adjusted gross margin(1) was 40.2% in the third quarter of 2022. There were no adjustments to gross margin in the third quarter of 2021. Operating margin was 19.4% as compared to 21.2% in the third quarter of 2021. Adjusted operating margin(1) was 19.8% in the third quarter of 2022. There were no adjustments to operating margin in the third quarter of 2021.
North America net sales through the wholesale channel decreased $73.1 million, or 7.4%, to $918.1 million, as compared to the third quarter of 2021, primarily driven by macroeconomic pressures impacting U.S. consumer behavior. North America net sales through the direct channel increased $10.8 million, or 8.4%, to $139.6 million, as compared to the third quarter of 2021.
North America adjusted gross margin(1) improved 30 basis points as compared to gross margin in the third quarter of 2021. The improvement was primarily driven by pricing actions to offset commodity inflation and favorable brand mix, partially offset by operational investments to service our customers. North America adjusted operating margin(1) declined 140 basis points as compared to operating margin in the third quarter of 2021. The decline was primarily driven by advertising investments and operating expense deleverage partially offset by the improvement in gross margin.
International net sales decreased 5.3% to $225.6 million as compared to $238.3 million in the third quarter of 2021. On a constant currency basis(1), International net sales increased 7.4% as compared to the third quarter of 2021. Gross margin was 53.4% as compared to 54.6% in the third quarter of 2021. Operating margin was 14.5% as compared to 21.1% in the third quarter of 2021. Adjusted operating margin(1) was 14.7% as compared to 22.1% in the third quarter of 2021.
International net sales through the wholesale channel decreased $22.9 million, or 21.2%, to $85.1 million as compared to the third quarter of 2021. International net sales through the direct channel increased $10.2 million, or 7.8%, to $140.5 million as compared to the third quarter of 2021. In the third quarter of 2022, International net sales decreased $30 million due to unfavorable foreign exchange.
International gross margin declined 120 basis points as compared to the third quarter of 2021. The decline was primarily driven by the acquisition of Dreams driving unfavorable mix, and foreign currency exchange rates. Dreams’ margin profile is lower than our historical International margins as they sell a variety of products across a range of price points. International adjusted operating margin(1) declined 740 basis points as compared to the third quarter of 2021. The decline was primarily driven by operating expense deleverage, the decline in gross margin, and Asia joint venture performance due to COVID-19 related shutdowns.
Corporate operating expense was $36.6 million, consistent with the third quarter of 2021.
Consolidated net income decreased 25.2% to $132.7 million as compared to $177.4 million in the third quarter of 2021. Adjusted net income(1) decreased 23.3% to $137.8 million as compared to $179.6 million in the third quarter of 2021. EPS decreased 13.8% to $0.75 as compared to $0.87 in the third quarter of 2021. Adjusted EPS(1) decreased 11.4% to $0.78 as compared to $0.88 in the third quarter of 2021.
The Company ended the third quarter of 2022 with total debt of $2.8 billion and consolidated indebtedness less netted cash(1) of $2.7 billion. Leverage based on the ratio of consolidated indebtedness less netted cash(1) to adjusted EBITDA(1) was 2.77 times for the trailing twelve months ended September 30, 2022.
During the third quarter of 2022, the Company repurchased 1.0 million shares of its common stock for a total cost of $25.2 million. Over the last twelve months, the Company has repurchased 24.1 million shares of its common stock for a total cost of $887.7 million. As of September 30, 2022, the Company had approximately $809.5 million available under its existing share repurchase authorization.
Additionally, today the Company announced that its Board of Directors declared a quarterly cash dividend of $0.10 per share, payable on December 1, 2022, to shareholders of record at the close of business on November 17, 2022.
Company Chairman and CEO Scott Thompson commented, “Overall, we are pleased with both our quarterly results and the progress we have made on our long-term initiatives, against an evolving macroeconomic backdrop. We enter this complex macro period with retailers generally in good shape, a strong competitive position, and new innovative products to launch. We are watching macro developments closely and adjusting to the market conditions, while staying aggressive and on strategy.”