
Uncategorized
January 26, 2025
Renovation Barometer for Q1
Strong Q4 performance fuels optimism among remodeling businesses
By Dakota Smith
January 23, 2025 | 10:41 am CST

Photo By Houzz Inc.
Houzz Inc., a platform for home remodeling and design, has released the Q1 2025 Houzz U.S. Renovation Barometer. The report found that businesses across the construction sector and the architecture and design services sector are optimistic about activity in the first quarter of the year. Expectations among construction professionals are at their highest since Q3 2022. Optimism follows improved Q4 business activity compared with Q3. Recent business activity indicators for both industry sectors have increased and are above the 50-point benchmark, indicating that more firms reported improvements than declines in business performance.
“Strong Q4 performance and recent federal interest rate cuts have bolstered confidence among industry professionals as we enter the new year,” said Marine Sargsyan, Houzz staff economist. “With this solid foundation, construction firms are expressing the most positive sentiment we’ve seen for the sector in two and a half years. Confidence levels also remain high among architects and interior designers as new committed projects continue to reinforce demand expectations, though optimism among this sector has softened slightly.”
Q1 2025 Construction Sector Barometer
• The Expected Business Activity Indicator for construction businesses related to project inquiries and newly committed projects increased three points to 65 for Q1.. This marks the highest reading since Q3 2022. Compared with Q4 2024, Q1 2025 expectations for project inquiries increased 10 points to 69, while new committed projects decreased 2 points to 62. The index is above 50 points suggesting businesses expect Q1 2025 performance to be better than Q4 2024. Both build-only and design-build remodelers expect an uptick in Q1 2025 business activity, with the indicators reaching 65 and 66, respectively.
• The Project Backlog Indicator is 5.8 weeks at the beginning of Q1 2025, which is 0.9 weeks shorter than a year ago. Build-only remodelers report a decrease of 1.4 weeks to 5.0 weeks, while design-build remodelers report a 0.4-week decrease in wait times at 6.7 weeks.
• The Recent Business Activity Indicator related to project inquiries and newly committed projects increased to 54 in Q4 2024, up 7 points from the previous quarter, indicating improvement in Q4 business activity compared with Q3. This is driven by a 14-point increase in project inquiries to 60 in Q4, relative to the previous quarter. Newly committed projects remained stable at 48. Both groups reported a 7-point increase in recent business activity, bringing the indicators above 50 points. The recent business indicator reached 53 for build-only remodelers and 55 for design-build remodelers in Q4.
Q1 2025 Architectural and Design Services Sector Barometer
• The Expected Business Activity Indicator related to project inquiries and new committed projects declined to 68 in Q1 2025 (down 3 points from Q4 2024) for the architectural and design services sector. This is driven by a 7-point decline in expectations for project inquiries and stable expectations for new committed projects (66 and 69 points, respectively). While the indicator dipped 12 points for architects (65 points), interior designers expect an improvement in Q1 business activity, up 11 points reaching 72.
• The Project Backlog Indicator is 7.3 weeks at the beginning of Q1, a significant jump of 2.1 weeks compared with last year (5.2 weeks). This year-over-year increase is driven by architects, who report an 8.8-week wait time on average, up 2.7 weeks from last year (6.1 weeks in Q1 2024). Interior designers reported a 1-week increase in wait times (4.6 weeks in Q1 2025) compared with last year (3.6 weeks in Q1 2024).
• The Recent Business Activity Indicator related to project inquiries and new committed projects increased to 58 in Q4 2024 (versus 54 in Q3). This increase is driven by an uptick in project inquiries (up 4 points from Q3 to 56 in Q4) and new committed projects (up 4 points from Q3 to 59 in Q4). While the business activity indicator is only up by 1 point at 61 for architects, interior designers reported a significant 10-point jump in business performance, climbing above the 50-point line to 53 points.
The quarterly Houzz U.S. Renovation Barometer provides timely insights into the residential renovation industry, including expectations, project backlogs, and recent activity among businesses in the U.S. construction and architectural and design services sectors. Scores for each component are computed as a seasonally adjusted diffusion index on a scale of 0 to 100, with index values over 50 indicating that a greater proportion of firms reported quarter-over-quarter increases than those reporting decreases. Detailed methodology and underlying quarterly indices for the construction sector and the architectural and design services sector, and other information on market conditions, can be found on houzz.com/research. The Q1 2025 Barometer was fielded from December 16, 2024, through January 11th, 2025, and garnered responses from over 1,000 home improvement firms on Houzz. n=1,139.
The Houzz community includes more than three million home remodeling and design professionals including architects, interior designers, general contractors, and design-build firms. Houzz Pro provides professionals and their clients with all-in-one project management and design software, including CRM, estimates, and takeoffs.
May 8, 2024
Footwear Tariffs
FDRA Speaks Out: Could Section 301 Tariffs on Footwear be Lifted?
PUdaily | Updated: May 6, 2024
U.S. Section 301 tariffs on footwear has had a profound impact on the American footwear industry. Not only has it caused significant distress to major footwear exporters such as China, but Matt Priest, CEO of the Footwear Distributors & Retailers of America (FDRA), has also called for the elimination of tariffs on footwear.

Since the tariffs were implemented, retail prices for footwear have sharply risen, marking the fastest growth in years and sending a rather alarming signal. Footwear, considered an essential item, has directly felt the impact of tariff increases, with a significant portion of the tariff pressure being passed on to end consumers. The consequent price hikes have placed a heavy economic burden on working-class families. Footwear is taxed at an average rate of 12% in the U.S., while all other imported consumer goods are taxed at an average rate of just 2%, according to FDRA. The working class faces with these high tariffs when purchasing footwear, especially from brands that were meant to be more affordable, further exacerbating financial strains on households.
Of particular concern is the impact of tariffs on kids’ shoes. Kids’ shoes, being a category where replacements are more frequent, experience a compounded effect of tariffs on their prices. Some kids’ shoes have seen their tariff rates double, leading to sharp price increases. This places families under even greater economic strain, especially amid persistently high inflation rates.
The FDRA views the elimination of the 301 tariffs on footwear as an urgent necessity. By eliminating these tariffs, the government could provide direct economic relief to American families due to lowered footwear prices. This move would not only ease the financial burden on consumers but also foster competition in the footwear market, reducing the impact on consumers.
June 21, 2023
Chinese Propylene Oxide Market
Zero Tax Rebate? Technical Limitations? Reasons for China’s Extremely Rare Propylene Oxide Exports
PUdaily | Updated: June 19, 2023
China rarely exports propylene oxide (PO). The country’s PO exports in the past five years only amounted to 53,000 tonnes. In addition to short supply in the domestic market, there are another three reasons for China’s extremely rare PO exports.
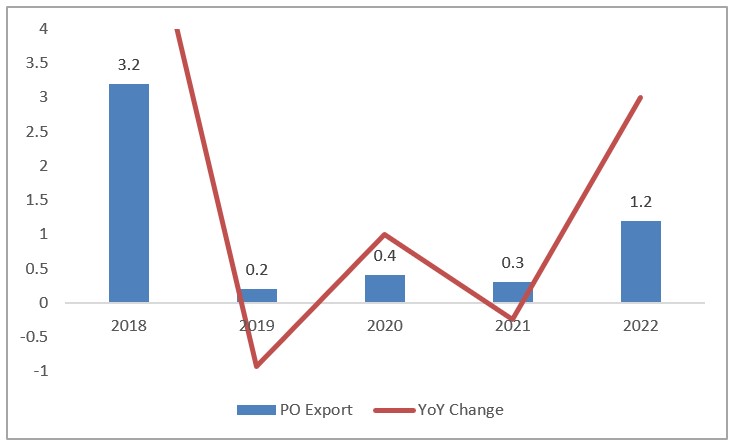
Data Source: PUdaily
1. Zero Tax Rebate
China has kept updating its tax rebate policies and accelerated the tax-rebate process in recent years, which has played a positive role in stabilizing foreign trade. Except for high energy-consuming, highly polluting and resource-based commodities, all exported goods have been completely relieved the tax burden, improving the competitiveness of Chinese goods in the international market. However, Chinese PO suppliers have been paid zero tax rebates since 2007.
2. Technical Limitations
China clearly stated that “controlling the export of high energy-consuming, highly polluting and resource-based commodities… and promoting the upgrading of domestic industries” in Outline of the 11th Five Year Plan for National Economy and Society Development (2005). This proposition is to balance internal and external economic development, guide enterprises to gradually reduce their over-reliance on foreign markets, rely more on and develop the domestic market to achieve endogenous growth; optimize the industrial structure, promote industrial upgrading; strengthen tax incentives to promote resource conservation, emission reduction, environmental protection, and accelerate the transformation of economic development mode.
Due to problems such as severe equipment corrosion and large production wastewater, the chlorohydrin process was included in the Guide Catalogue for Industrial Structural Adjustment (2019) under the restricted category, and constructing new chlorohydrin-based facilities has been prohibited since 2015. At that time, the chlorohydrin process accounted for 58.1% of PO production volume in China, while as of now, the proportion has been reduced to 27.1%.
In the Announcement No.54 (2020) on amending the catalogue of prohibited products in processing trade, it was mentioned that only the hydrogen peroxide to propylene oxide (HPPO) process is allowed to produce exported propylene oxide, and the others are still under the prohibited list. The note on the prohibited export commodities has been modified to “allow HPPO and co-oxidation processes to produce exported propylene oxide, and the others are still under the prohibited list”.
3. Limited Chemical Tankers
A chemical tanker is a type of tanker ship designed to transport liquid chemicals in bulk, including various toxic, flammable, volatile, or corrosive chemicals. PO belongs to Class 3 dangerous goods as a flammable liquid, with a low flashpoint and high danger. So it requires high packaging strength (Packing group I). To ship PO by sea for export, it is necessary to do shipside loading. If the ship docks at an outer port, the goods need to be sent to the hazardous chemicals warehouse.
Since July 2011, China’s chemical tanker market has entered a period of strict capacity control, with limited new capacity added each year. From 2012 to 2018, China’s average annual increase in maritime transportation capacity was only 21,371.43 deadweight tonnages (DWT). Under the strict capacity monitoring system, the total expansion of chemical tanker industry has been relatively slow, and the industry size has been regulated. Under the survival of the fittest mechanism, the industry maintains orderly growth. As of 2022, there were a total of 287 provincial chemical tankers in China (including dual-purpose tankers for oil and chemicals), with a total capacity of 1.399 million dwt, an increase of 3 tankers and 110,000 dwt YoY, with a tonnage increase of 8.5%. In 2022, 28 tankers with a total of 188,000 dwt were added, and 25 tankers with a total capacity of 76,000 dwt were retired from the market ahead of schedule.
With continually growing production capacity, Chinese PO suppliers will face higher sales pressure in the domestic market. While gradually reducing dependence on imported sources, the opening of the export market seems inevitable, but it is unclear whether tax rebates will be available once again.
April 17, 2023
Asian TDI Overview
China TDI Market Rebounds Under Continuous Supply Contraction
PUdaily | Updated: April 14, 2023
China’s TDI market has rebounded rapidly since last Thursday. As of April 13, TDI prices in East China stood around CNY 18,400-19,000/tonne, an increase of over CNY 1,000/tonne compared to last week.
Figure 1: China TDI Price Trend in 2023 (CNY/tonne)
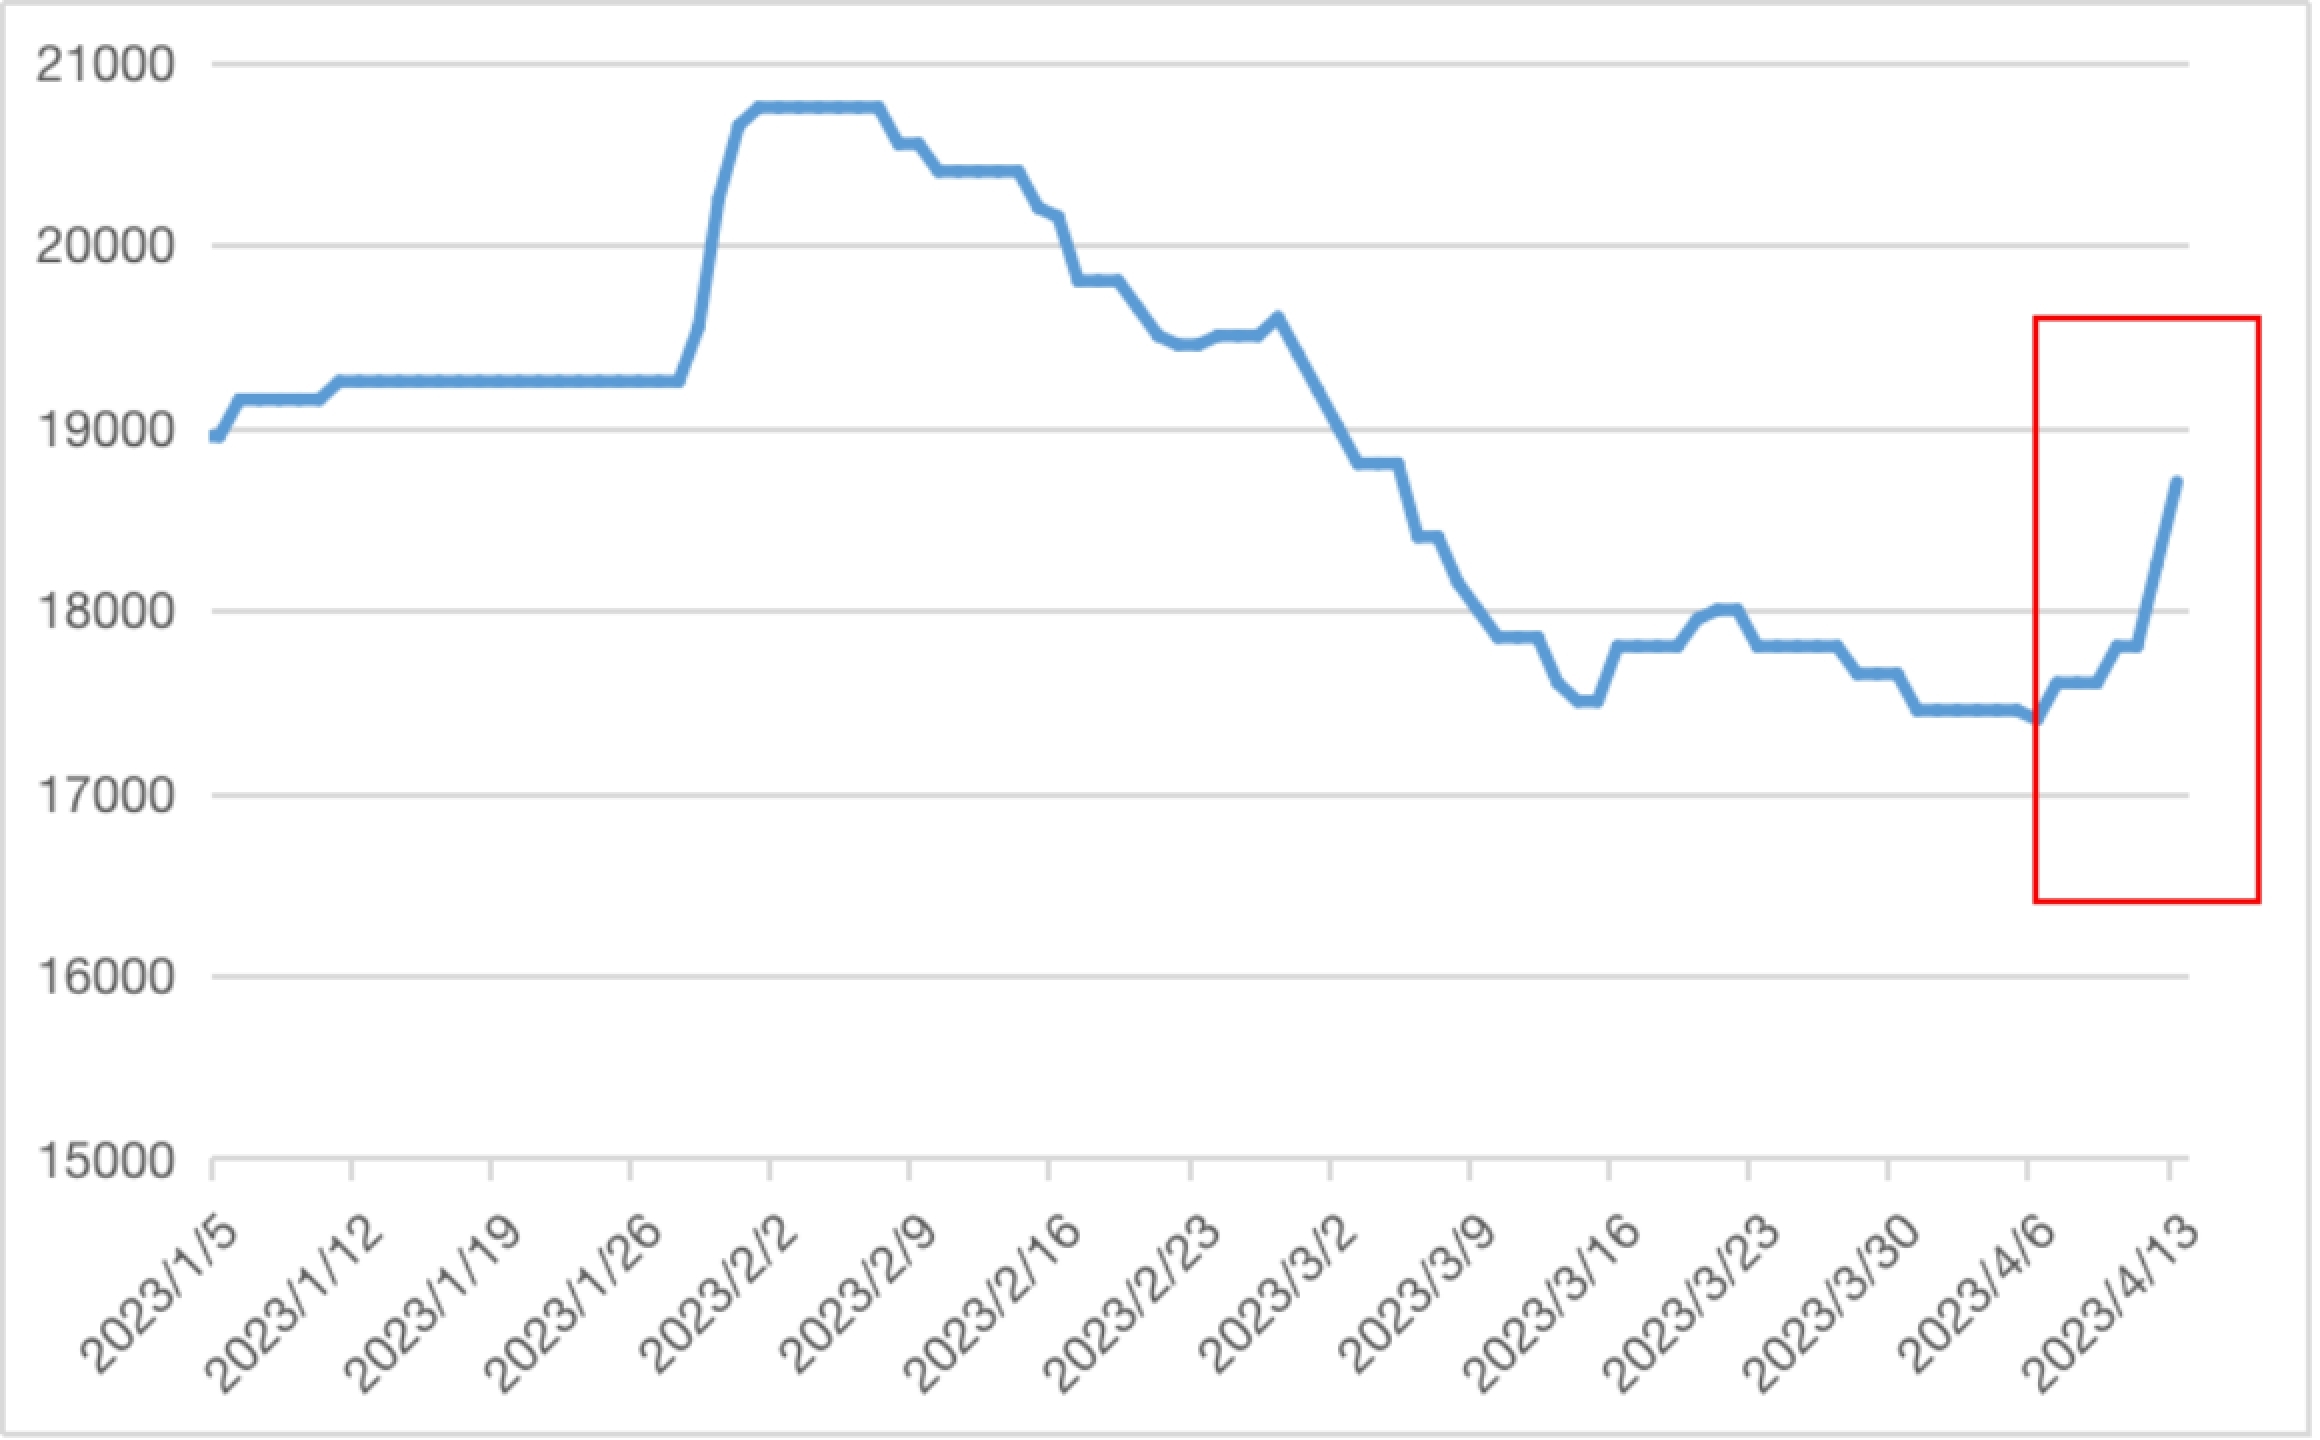
Although China’s TDI market remained strong at the beginning of 2023, with the arrival of the Spring Festival, downstream manufacturers gradually went on holiday, and the trading atmosphere was generally sluggish. After Spring Festival holidays, the TDI market opened with a jump in prices, as not only did Gansu Yinguang Chemical not restart TDI facility, but existing capacity also continued to decline: a 100 ktpa facility in Fujian was shut down permanently from February 1; Covestro and Juli Chemical had significantly reduced operation loads due to equipment issues; and other suppliers did not increase output into the market either. As a result, the TDI spot supply remained relatively tight, with traders raising their quotes, and market prices quickly climbing to quarterly highs. However, due to weaker-than-expected demand, the high market prices were difficult to sustain, and under sales pressure, the market began a lingering downtrend. Despite continuous support from suppliers’ pricing policies, and overall low operating rates, weak purchasing power continued to drag down the market, leading to repeated price declines.
After entering April, the 150 ktpa TDI facility of Juli Chemical has undergone maintenance, while Yinguang Chemical still has not resumed normal production. Previously, due to market expectations that prices would continue to decline after the release of new capacities from Yinguang Chemical and Wanhua Chemical’s Fujian plant, many market participants kept a cautious and wait-and-see attitude. However, it’s reported that there is still no consensus on whether Yinguang Chemical will release its products into the market in April, and the spot market is becoming increasingly tight. Moreover, since the shutdown of TDI facilities by BASF in Europe, Asian TDI suppliers led by BASF in South Korea have provided extensive support for exports. Starting from April 15, Hanwha’s TDI unit in South Korea will also enter maintenance, which will further tighten the supply of Korean TDI exports. This gives more opportunities for Chinese TDI suppliers to increase their overseas market supplies, reduces domestic sales pressure, and provides indirect support for the recent rapid rebound of TDI prices.
February 14, 2023
Chinese Polyol Balances
China Import and Export of Other Polyether Polyols in Primary Forms 2022
PUdaily | Updated: February 9, 2023
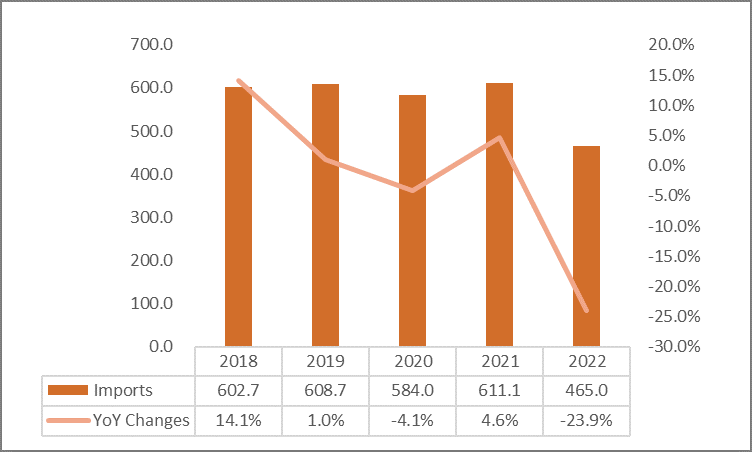
China’s polyether polyols are unbalanced in structure and highly dependent on imports for raw materials. In order to meet domestic demand, China imports high-quality polyethers from foreign suppliers. Dow’s plant in Saudi Arabia and Shell in Singapore are still the main import sources of polyethers for China. China’s import of other polyether polyols in primary forms in 2022 totalled 465,000 tonnes, a year-on-year decrease of 23.9%. Import sources included a total of 46 countries or regions, led by Singapore, Saudi Arabia, Thailand, South Korea and Japan, according to China customs.
China Imports of Other Polyether Polyols in Primary Forms & YoY Changes, 2018-2022 (kT, %)
With liberalized anti-epidemic measures and continuously increasing consumer demand, Chinese polyether suppliers had gradually expanded their production capacity. China’s polyether polyols import-dependency ratio decreased significantly in 2022. Meanwhile, Chinese polyether polyol market saw significant structural excess capacity and fierce price competition. Many suppliers in China turned to target overseas markets to solve the prickly issue of overcapacity.
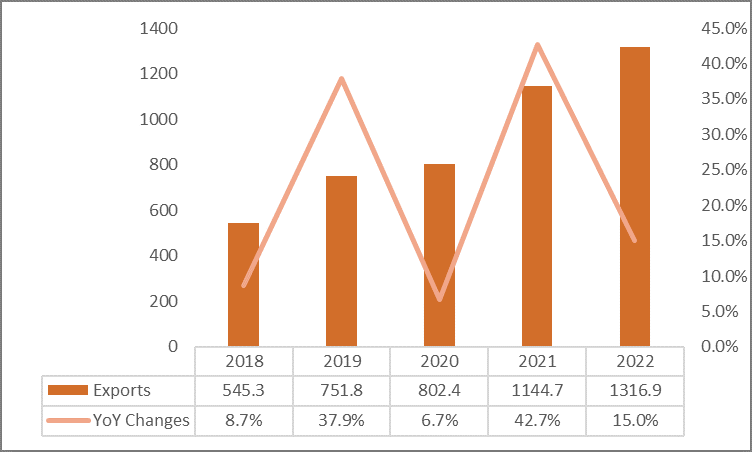
China’s polyether polyol exports kept rising from 2018 to 2022, at a CAGR of 24.7%. In 2022, China’s export of other polyether polyols in primary forms totalled 1.32 million tonnes, a year-on-year increase of 15%. Export destinations included a total of 157 countries or regions. Vietnam, the United States, Turkey and Brazil were the main export destinations. Rigid polyols were mostly exported.
China Exports of Other Polyether Polyols in Primary Forms & YoY Changes, 2018-2022 (kT, %)
China’s economic growth is expected to reach 5.2% in 2023, according to IMF’s latest forecast in January. The boost of macro policies and the strong momentum of development reflect the resilience of China’s economy. With increased consumer confidence and revived consumption, the demand for high-quality polyethers has grown, thus China’s polyether imports will witness a slight increment. In 2023, thanks to capacity expansion plans of Wanhua Chemical, INOV, Jiahua Chemicals and other suppliers, China’s new polyether polyols capacity is projected to reach 1.72 million tonnes per annum, and the supply will further increase. However, due to limited domestic consumption, Chinese suppliers are considering going global. China’s fast economy recovery will drive the global economy. IMF predicts that global growth would reach 3.4% in 2023. The development of downstream industries will inevitably push up the demand for polyether polyols. Therefore, China’s polyether polyols export is expected to further increase in 2023.
 Everchem Updates Archive
 Sign Up for Email Updates