Asian Markets
August 1, 2018
Tosoh Results
08/01/2018 | Press release | Distributed by Public on 07/31/2018 22:13
Tosoh Reports on First-Quarter Consolidated Results for Fiscal 2019
Tokyo, Japan- Tosoh Corporation is pleased to announce its consolidated results for the first quarter of fiscal 2019, from April 1, 2018, to June 30, 2018. The company’s consolidated net sales totaled ¥204.4 billion (US$1.9 billion), up ¥14.0 billion, or 7.3%, over the first quarter of fiscal 2018. The increase was attributable to increases in prices for fuel and raw materials, such as naphtha; the resulting rise in petrochemical product prices; and a strengthening of markets overseas.
Operating income also increased, ¥3.3 billion, or 15.5% over the same period the preceding year, to ¥24.7 billion (US$226.5 million). The gain resulted from an increase in sales prices that exceeded the increases in fuel prices and, in turn, improved trade conditions. Ordinary income climbed ¥4.5 billion, or 18.9%, compared with the first quarter of fiscal 2018, to ¥28.1 billion (US$257.7 million). This rise was due to foreign exchange gains resulting from the continued depreciation of the yen. Net profit attributable to owners of the parent company totaled ¥19.2 billion (US$176.0 million), an increase of ¥2.7 billion, or 16.3%, compared with the same period a year earlier.
During the first quarter of fiscal 2019, Japan’s economy showed signs of a gradual recovery. Individual consumption rose amid higher corporate earnings and an improved employment and income environment. The future, however, remains difficult to predict. The global economy, led by the United States, was firm overall, but with continued trade friction between the US and China, political uncertainty in Europe, and heightened geopolitical risk in the Middle East, there is still the possibility of an economic slowdown.
Results by Business Segment
Petrochemical Group
Petrochemical Group net sales fell ¥3.0 billion, or 6.4%, to ¥43.2 billion (US$395.9 million), compared with the first quarter of fiscal 2018. Operating income also decreased, ¥1.3 billion, or 30.9%, to ¥3.0 billion (US$27.2 million).
Shipments of olefin products, such as ethylene and propylene, decreased in line with a decrease in production volume attributable to fiscal 2019 being a scheduled maintenance year. The group raised prices for these products to reflect increased naphtha costs.
Shipments of polyethylene resin in Japan decreased, but prices rose to reflect the increase in naphtha costs. Chloroprene rubber saw decreased shipments due to a decrease in production volume, but export prices rose, driven by strong overseas demand.
Chlor-alkali Group
The Chlor-alkali Group’s net sales increased ¥8.6 billion, or 11.3%, to ¥84.0 billion (US$770.0 million). The group’s operating income likewise rose, ¥3.3 billion, or 39.8%, to ¥11.5 billion (US$105.8 million), compared with the corresponding period the preceding year, primarily due to improved trade conditions.
Domestic shipments and exports of caustic soda and vinyl chloride monomer were strong, and product prices rose because of a revision in domestic prices and improved conditions overseas. Polyvinyl chloride resin product prices also rose because of changes in domestic prices.
Domestic shipments of cement trended strongly upward, while exports stagnated. Methylene diphenyl diisocyanate shipments decreased, but export prices rose, reflecting improved conditions overseas.
http://www.publicnow.com/view/DB324A974938E03CB34CA9F90854D45B5F24E9FF
July 23, 2018
Chinese Propylene Oxide Update
Will the High PO Price in H1 2018 Continue into the Future?
2018-07-20 [Source:PUdaily]
share:
PUdaily, Shanghai– Recently, the price of propylene oxide has been rising as demand exceeded supply, with low offer barely heard. At this special point of midyear, PUdaily would like to take the opportunity to summarize the PO market in the first half of the year and share our views on the market outlook.
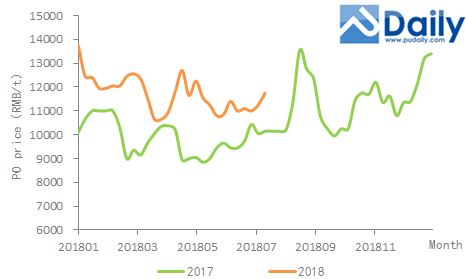
Figure 1 2017-2018 China PO Price
As shown in Figure 1, the PO price in 2017 mostly fluctuated around RMB 10,000 yuan. As the government’s extensive environmental inspection resulted in lower loads for PO facilities in China, the high price used to be seen in September and October (peak season) was seen in advance in the middle of August. However, the price dropped soon after the buyers stocked enough inventories and therefore demand decreased.
In the first half of 2018, the PO price consistently stayed above RMB 10,000 yuan and was significantly higher than that of 2017. According to PUdaily, the average price for PO in the first half of the year increased by 18% year over year. The price rebounded due to the sudden shutdown of a plant in Shandong after it fell in early March. In early June, as the SCO Summit was held, the transportation of dangerous chemicals was banned and the facility loads of major PO manufacturers declined. As a result, the price rose slightly again. Recently, on the arrival of the good news that some plants in Shandong and northeast China were shut down for maintenance, the PO price rose even if downstream demand was modest.
Overall, in H1 2018, the PO price was driven up several times by multiple positive factors such as facility overhaul and reduced loads by PO manufacturers. However, as the government carried out the action of “revisit” as part of its environmental inspection campaign, downstream small sponge and paint manufacturers had to close their plants or reduce facility loads, which resulted in sluggish demand for polyether polyols. This in turn affected the demand for PO. Although the inspection is coming to an end, the general trend toward environmentally-friendly business will not change. Rectification of downstream small environmentally-unfriendly manufacturers will continue. Thus, the demand for upstream polyether polyols and further PO will continue to be sluggish.
Looking ahead, PUdaily expects that in the second half of the year, new PO facilities in China with a combined capacity of 200k t/a will come on-stream, including Hongbaoli’s 120k t/a facility and CITIC Guoan Chemical Company Limited’s 80k t/a facility. Meanwhile, S-Oil’s new 300k t/a facility is also likely to supply the market in mainland China. After new plants are put into production, the landscape of supply and demand is bound to change. Though it is reasonable to have certain expectation for the peak season of September and October, the market is expected not to be as strong as it was in the past.
It is worth noting that the period from this year to 2021 will witness a large number of newly-built PO plants in China. PUdaily estimates that over the next four years, new PO facilities with a combined capacity of over 2.4 million t/a will be put into production. As for the production processes, most of the new plants will adopt more environmentally- friendly processes such as cooxidation process and direct oxidation proccess. PUdaily believes that such move is in line with the trend toward environmental-friendly production as required by the environmental inspection teams, and it is such trend that will lead to the transformation and upgrading of the PO industry. The PO industry will have a brighter future.
http://www.pudaily.com/News/NewsView.aspx?nid=72823
July 23, 2018
Chinese Propylene Oxide Update
Will the High PO Price in H1 2018 Continue into the Future?
2018-07-20 [Source:PUdaily]
share:
PUdaily, Shanghai– Recently, the price of propylene oxide has been rising as demand exceeded supply, with low offer barely heard. At this special point of midyear, PUdaily would like to take the opportunity to summarize the PO market in the first half of the year and share our views on the market outlook.
Figure 1 2017-2018 China PO Price
As shown in Figure 1, the PO price in 2017 mostly fluctuated around RMB 10,000 yuan. As the government’s extensive environmental inspection resulted in lower loads for PO facilities in China, the high price used to be seen in September and October (peak season) was seen in advance in the middle of August. However, the price dropped soon after the buyers stocked enough inventories and therefore demand decreased.
In the first half of 2018, the PO price consistently stayed above RMB 10,000 yuan and was significantly higher than that of 2017. According to PUdaily, the average price for PO in the first half of the year increased by 18% year over year. The price rebounded due to the sudden shutdown of a plant in Shandong after it fell in early March. In early June, as the SCO Summit was held, the transportation of dangerous chemicals was banned and the facility loads of major PO manufacturers declined. As a result, the price rose slightly again. Recently, on the arrival of the good news that some plants in Shandong and northeast China were shut down for maintenance, the PO price rose even if downstream demand was modest.
Overall, in H1 2018, the PO price was driven up several times by multiple positive factors such as facility overhaul and reduced loads by PO manufacturers. However, as the government carried out the action of “revisit” as part of its environmental inspection campaign, downstream small sponge and paint manufacturers had to close their plants or reduce facility loads, which resulted in sluggish demand for polyether polyols. This in turn affected the demand for PO. Although the inspection is coming to an end, the general trend toward environmentally-friendly business will not change. Rectification of downstream small environmentally-unfriendly manufacturers will continue. Thus, the demand for upstream polyether polyols and further PO will continue to be sluggish.
Looking ahead, PUdaily expects that in the second half of the year, new PO facilities in China with a combined capacity of 200k t/a will come on-stream, including Hongbaoli’s 120k t/a facility and CITIC Guoan Chemical Company Limited’s 80k t/a facility. Meanwhile, S-Oil’s new 300k t/a facility is also likely to supply the market in mainland China. After new plants are put into production, the landscape of supply and demand is bound to change. Though it is reasonable to have certain expectation for the peak season of September and October, the market is expected not to be as strong as it was in the past.
It is worth noting that the period from this year to 2021 will witness a large number of newly-built PO plants in China. PUdaily estimates that over the next four years, new PO facilities with a combined capacity of over 2.4 million t/a will be put into production. As for the production processes, most of the new plants will adopt more environmentally- friendly processes such as cooxidation process and direct oxidation proccess. PUdaily believes that such move is in line with the trend toward environmental-friendly production as required by the environmental inspection teams, and it is such trend that will lead to the transformation and upgrading of the PO industry. The PO industry will have a brighter future.
http://www.pudaily.com/News/NewsView.aspx?nid=72823
July 13, 2018
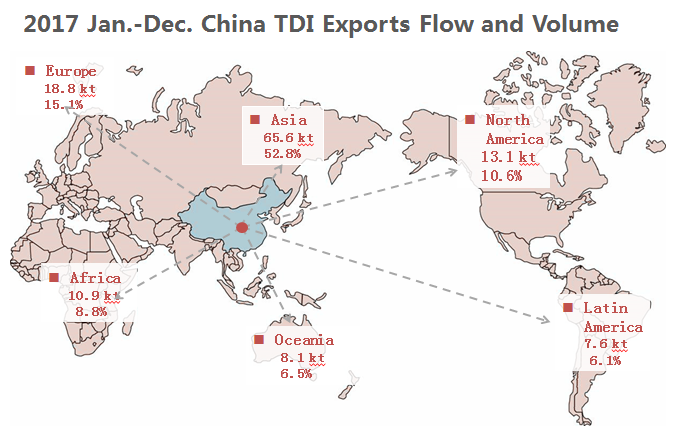
Chinese TDI Export Flow
Three Charts Show China’s TDI Exports and How They Went in 2017
PUdaily, Shanghai–China’s TDI exports totaled 124,000 tons in 2017, down 8.6% from previous year. This is mainly due to the high domestic TDI price in 2017. Except Fujian Southeast Electrochemical, whose TDI exports increased significantly, most TDI manufacturers have little enthusiasm for export. Next, using three charts PUdaily will carry out an analysis of the TDI exports and how they went in 2017.
How China’s TDI exports went in 2017
①Data for 2017 shows that China’s TDI exports mainly went to Asia, which accounted for 52.8% of China’s total exports. Domestic TDI manufacturers were also gaining a foothold in markets in Europe and North America. In 2017, China’s adipic acid exports to the two regions accounted for 15.1% and 10.6% of China’s total exports, respectively.
②In 2017, Asian countries importing TDI from China include Taiwan (China), India, Pakistan, Indonesia, the Philippines, Vietnam, Thailand, Hong Kong (China), Sri Lanka, Saudi Arabia and other countries and regions. The top 10 countries/regions accounted for 92.1% of China’s total exports to Asia.
③In 2017, European countries importing TDI from China include Germany, Belgium, Albania and the United Kingdom. Of which Germany and Belgium accounted for 98.5 per cent of China’s total exports to Europe.

Top 10 Countries/regions importing TDI from China in 2017 (In tons)
①The top 10 countries/regions accounted for 70% of China’s total TDI exports. Of which the United States made up 11%, followed by Germany and Taiwan, which made up 8.5% and 7.7%, respectively.
②Covestro is the major supplier exporting TDI to Germany, the United States, India and Belgium.
③Major suppliers exporting TDI to Taiwan are Covestro, Yantai Juli and Fujian Southeast Electrochemical. Of which Covestro accounted for 99% of the total exports.
④The main suppliers exporting TDI to Pakistan include Fujian Southeast Electrochemical, Cangzhou Dahua, Covestro, BASF and Yantai Juli. Among them, Southeast Electrochemical made up 34 percent, Cangzhou Dahua 21.6 percent, Covestro 21 percent, BASF 20.8 percent, and Yantai Juli 2.7 percent of the total exports to the country.
⑤The major suppliers exporting TDI to Indonesia are Covestro, Dow Chemical and Southeast Electrochemical. Among them, Covestro accounted for 97% of the total exports.
⑥The main suppliers exporting the same chemical to Australia are Covestro, Yantai Juli and Southeast Electrochemical. Of which Covestro accounted for 93% of the total exports.
⑦The major suppliers exporting this product to the Philippines are Covestro and Yantai Juli. Of which Covestro accounted for 96% of the total exports.
⑧The main suppliers exporting TDI to Vietnam are Covestro and Southeast Electrochemical. Of which Covestro accounted for 88% of the total exports.
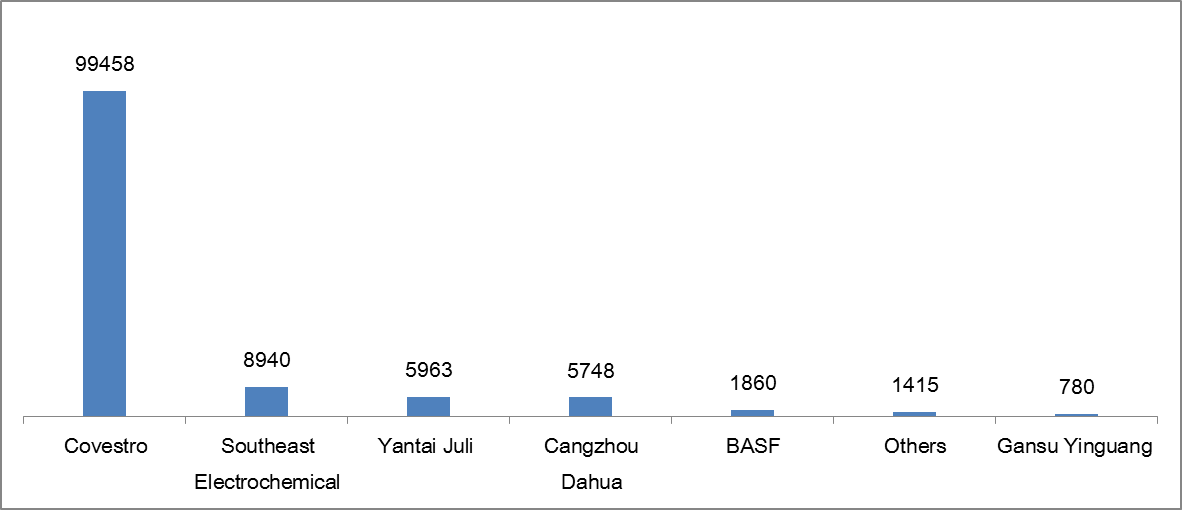
TDI exporters in China in 2017 (In tons)
①Covestro remained the largest TDI exporter in China. The company exported 99,458 tons of TDI in 2017, accounting for 80% of China’s total TDI exports. The top five exporters accounted for 98% of the total exports.
②Costco’s main export destinations include the United States, Germany, Taiwan (China), India, Belgium, Indonesia, the Philippines, Australia, Vietnam, Thailand and other countries and regions. The top 10 countries/regions accounted for 81.6% of its total exports.
③In terms of BASF, in 2017 it exported only 1,860 tons of TDI, down sharply from 2016. And its main export destination is Pakistan, which is partially a result of Pakistan’s preferential tariff on TDI imports from China.
④As for Fujian Southeast Electrochemical, it exported 8,940 tons of TDI in 2017, increasing significantly from 2016. Its main export destinations are Asia, Africa and Latin America, with little TDI exported to Europe and Oceania. Its TDI exports to the Asia accounted for 58 per cent of its total exports.
Postscript: created by PUdaily, “Everyday News on PU” is a column providing high-quality and original contents, covering the review of PU raw material market, the forecast of future price movement and the operation status of manufacturers’ facilities, etc. Thank you! If you have different views, please feel free to leave a message or contact PUdaily for discussion via mobile phone 18221824746!
http://www.pudaily.com/News/NewsView.aspx?nid=72658
July 13, 2018
Chinese TDI Export Flow
Three Charts Show China’s TDI Exports and How They Went in 2017
PUdaily, Shanghai–China’s TDI exports totaled 124,000 tons in 2017, down 8.6% from previous year. This is mainly due to the high domestic TDI price in 2017. Except Fujian Southeast Electrochemical, whose TDI exports increased significantly, most TDI manufacturers have little enthusiasm for export. Next, using three charts PUdaily will carry out an analysis of the TDI exports and how they went in 2017.
How China’s TDI exports went in 2017
①Data for 2017 shows that China’s TDI exports mainly went to Asia, which accounted for 52.8% of China’s total exports. Domestic TDI manufacturers were also gaining a foothold in markets in Europe and North America. In 2017, China’s adipic acid exports to the two regions accounted for 15.1% and 10.6% of China’s total exports, respectively.
②In 2017, Asian countries importing TDI from China include Taiwan (China), India, Pakistan, Indonesia, the Philippines, Vietnam, Thailand, Hong Kong (China), Sri Lanka, Saudi Arabia and other countries and regions. The top 10 countries/regions accounted for 92.1% of China’s total exports to Asia.
③In 2017, European countries importing TDI from China include Germany, Belgium, Albania and the United Kingdom. Of which Germany and Belgium accounted for 98.5 per cent of China’s total exports to Europe.
Top 10 Countries/regions importing TDI from China in 2017 (In tons)
①The top 10 countries/regions accounted for 70% of China’s total TDI exports. Of which the United States made up 11%, followed by Germany and Taiwan, which made up 8.5% and 7.7%, respectively.
②Covestro is the major supplier exporting TDI to Germany, the United States, India and Belgium.
③Major suppliers exporting TDI to Taiwan are Covestro, Yantai Juli and Fujian Southeast Electrochemical. Of which Covestro accounted for 99% of the total exports.
④The main suppliers exporting TDI to Pakistan include Fujian Southeast Electrochemical, Cangzhou Dahua, Covestro, BASF and Yantai Juli. Among them, Southeast Electrochemical made up 34 percent, Cangzhou Dahua 21.6 percent, Covestro 21 percent, BASF 20.8 percent, and Yantai Juli 2.7 percent of the total exports to the country.
⑤The major suppliers exporting TDI to Indonesia are Covestro, Dow Chemical and Southeast Electrochemical. Among them, Covestro accounted for 97% of the total exports.
⑥The main suppliers exporting the same chemical to Australia are Covestro, Yantai Juli and Southeast Electrochemical. Of which Covestro accounted for 93% of the total exports.
⑦The major suppliers exporting this product to the Philippines are Covestro and Yantai Juli. Of which Covestro accounted for 96% of the total exports.
⑧The main suppliers exporting TDI to Vietnam are Covestro and Southeast Electrochemical. Of which Covestro accounted for 88% of the total exports.
TDI exporters in China in 2017 (In tons)
①Covestro remained the largest TDI exporter in China. The company exported 99,458 tons of TDI in 2017, accounting for 80% of China’s total TDI exports. The top five exporters accounted for 98% of the total exports.
②Costco’s main export destinations include the United States, Germany, Taiwan (China), India, Belgium, Indonesia, the Philippines, Australia, Vietnam, Thailand and other countries and regions. The top 10 countries/regions accounted for 81.6% of its total exports.
③In terms of BASF, in 2017 it exported only 1,860 tons of TDI, down sharply from 2016. And its main export destination is Pakistan, which is partially a result of Pakistan’s preferential tariff on TDI imports from China.
④As for Fujian Southeast Electrochemical, it exported 8,940 tons of TDI in 2017, increasing significantly from 2016. Its main export destinations are Asia, Africa and Latin America, with little TDI exported to Europe and Oceania. Its TDI exports to the Asia accounted for 58 per cent of its total exports.
Postscript: created by PUdaily, “Everyday News on PU” is a column providing high-quality and original contents, covering the review of PU raw material market, the forecast of future price movement and the operation status of manufacturers’ facilities, etc. Thank you! If you have different views, please feel free to leave a message or contact PUdaily for discussion via mobile phone 18221824746!
http://www.pudaily.com/News/NewsView.aspx?nid=72658