
Current Affairs
April 28, 2021
Composites Overview
4/28/2021 |
Playing hard-to-get
The global pandemic, shipping woes and winter storms have wreaked havoc on the composites supply chain. CW attempts to find out how widespread the problem is.
#editorial
Jeff Sloan Editor-in-Chief, CompositesWorld

Photo Credit: Getty Images
If you are reading this, there is a very good chance that you are involved in the composites industry somehow. And if you are involved in the composites industry somehow, there is a very good chance that you design or fabricate composite parts and structures and use polymer-based resin systems and fiber-based reinforcements. And if this is the case, then I don’t need to tell you that the supply of many of the resin and fiber materials used by the composites industry have been, over the last few months, in very short supply.
There are multiple reasons for these shortages, and there are multiple material types being affected, but it appears most of the most pain has been felt in the epoxy resin supply chain and the glass fiber supply chain. CW has already reported on the latter in a story you can find on p. 16 of the May 2021 issue, or on the CW website here: “Glass fiber supply chain struggles amid pandemic, economic recovery.” I also discussed the glass fiber supply situation in my March 2021 editorial.
Featured Content
Challenges of laser-assisted tape winding of thermoplastic composites Increasing demand for composite driveshafts leads to automated production Composite testing challenges, Part 1: Introduction to mechanical testing of composites
The resin shortage, however, has a different genesis. It was triggered primarily by Winter Storm Uri that afflicted Texas and other southern U.S. states in mid-February 2021. This fast-moving front brought sudden and unusual freezing temperatures as far south as Houston, Texas, which is home to a variety of petroleum-based processing facilities, including oil refineries and polymer manufacturing plants. The cold temperatures disrupted supply of water, natural gas and electricity, thus forcing the facility owners to declare force majeure and shut down.
Hexion (Columbus, Ohio, U.S.), which produces bisphenol-A (BPA, a key ingredient of epoxy) at two facilities in Texas, was forced to cease operations. Similarly, epoxy specialist Olin (Clayton, Miss., U.S.) was forced to shut down all operations at its facilities in Texas, Louisiana, Mississippi and Alabama. These and other shutdowns were consequential not just for the epoxy supply chain, but the vinyl ester supply chain as well, which requires epoxy.
To assess the impact of these widespread shortages, CW, working with Gardner Intelligence (CW and Gardner Intelligence are owned by Gardner Business Media), sent a supply chain survey to the CW audience in early April 2021. We received 144 responses, and from those, learned much about the state of resin and fiber supply. Some highlights:
- When asked which resin systems have been more difficult than usual to acquire in the last three months, 49% of those who responded listed vinyl ester; 49% also listed polyester and 36% listed epoxy.
- When asked which fiber types have been more difficult than usual to acquire in the last three months, 78% of those who responded listed glass fiber; 39% listed carbon fiber.
- The fiber formats in shortest supply, according to respondents, were roving (52%), chopped fiber (43%), woven fabrics (35%) and UD tape (20%).
- The core material in shortest supply was foam (53%).
- The reasons cited for the disruptions was balanced: Shipping delays, not weather-related (56%), high demand (48%), inclement weather (36%). Interestingly, we allowed respondents to list other reasons for disruptions, and “COVID-19” topped that list.
Significantly, we asked how supply chain disruptions have affected the ability to meet customer or contract obligations for delivery of finished parts. Responses here were on a 0-100 sliding scale — the bigger the number the greater the impact. Sixty-two percent of respondents fell in the 51-100 range, which indicates moderate to substantial impact on manufacturing operations.
We also asked respondents to look ahead and estimate when the supply situation would return to normal. The leader here was “unknown,” with 41%, followed by “more than 16 weeks from now,” at 28%. And when asked how concerned respondents were about how the supply disruptions would affect their operations, 55% were either moderately or extremely concerned.
Of course, when supplies tighten, there are options. The vast majority of respondents (65%) said they have communicated the problem to their customers. A large fraction (41%) also sought materials from other suppliers or used an alternative material (38%).
Signals from suppliers and anecdotal feedback we’ve received indicate that this tightening in the supply chain will continue into the summer and possibly the early fall as raw materials and staffing levels return to normal. If you have a story to share about your supply chain challenges, feel free to contact me at jeff@compositesworld.com. And keep an eye on your inbox for this survey — we will send it again soon to find if and how the supply situation is improving.
https://www.compositesworld.com/articles/playing-hard-to-get
April 27, 2021
Container Update
“It’s About To Get Much Worse”: Supply Chains Implode As “Price Doesn’t Even Matter Anymore”
by Tyler DurdenTuesday, Apr 27, 2021 – 02:15 PM
By Greg Miller, of FreightWaves,
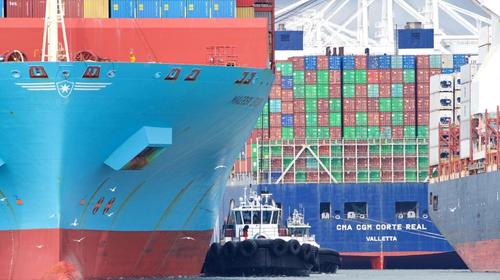
The number of container ships stuck at anchor off Los Angeles and Long Beach is down to around 20 per day, from 30 a few months ago. Does this mean the capacity crunch in the trans-Pacific market is finally easing? Absolutely not, warned Nerijus Poskus, vice president of global ocean at freight forwarder Flexport. “It’s not getting better. It’s getting worse,” he told American Shipper in an interview on Monday.
“What I’m seeing is unprecedented. We are seeing a tsunami of freight,” he reported.
“For the month of May, everything on the trans-Pacific is basically sold out. We had one client who needed something loaded in May that was extremely urgent and who was ready to pay $15,000 per container. I couldn’t get it loaded — and we are a growing company that ships a lot of TEUs [twenty-foot equivalent units]. Price doesn’t always even matter anymore.”
Restocking driving volumes higher
Poskus said that trans-Pacific import volumes are still rising. He noted that January trans-Pacific imports were up 10% versus 2019 (comparisons to 2020 numbers are skewed by COVID) and 13.5% in February, then jumped 51% in March. “So, we’re now at 1.5 times pre-pandemic levels.”
With imports far outpacing retail sales growth, he attributed volumes to inventory restocking. “The restocking is actually affecting the trade even more than growth in demand. That tells me that this will last even longer. Let’s say U.S. consumer demand slows down in Q3 and Q4. That’s not expected, but even if it does, [capacity availability and rates] shouldn’t improve quickly, simply because of the huge restocking demand.”
Poskus also believes there is a growing export backlog piling up each day in Asia, awaiting available ship slots. If that backlog grows too big, he said, “I honestly don’t know what’s going to happen.” As a result of the backlog and restocking demand, he thinks “prices will remain high and shipping will probably remain difficult for the rest of this year. And then after that, you have the peak for Chinese New Year in 2022.”
About to get even worse
He said that the situation today is the worst he’s witnessed — and he believes it’s about to get even more severe.
“Buckle up. The month of May will be the worst people have ever seen,” he predicted. Because some shippers will have to wait in line behind the growing backlog in Asia, he expects “what’s going to happen soon is that some importers won’t even be able to get on the boat. For them, it will almost feel like trade is coming to a halt.”
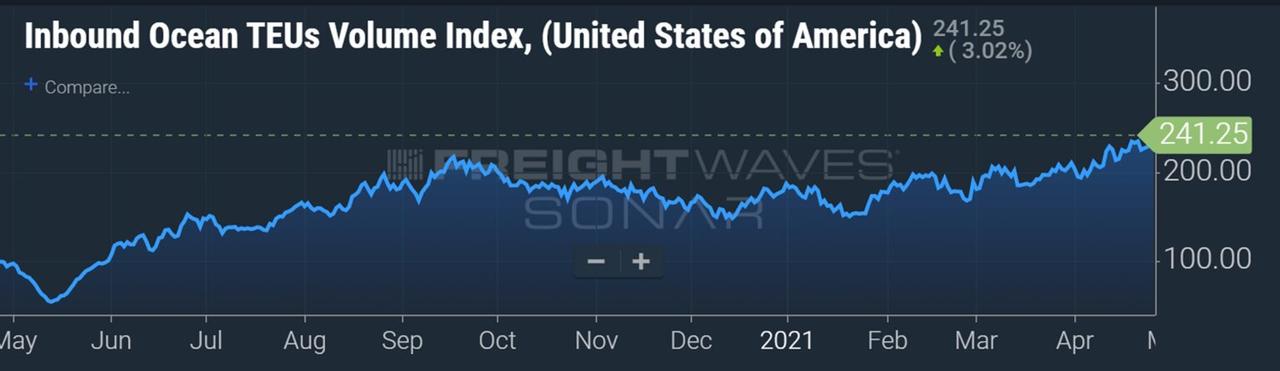
Poskus’ comments mirror cargo bookings data. FreightWaves’ SONAR platform features a proprietary index of shippers’ ocean bookings (SONAR: IOTI.USA). Bookings to the U.S. are measured in TEUs on a 10-day-moving-average basis as of the scheduled date of overseas departure. As of Monday, the index was at a new all-time high and forward bookings data showed a continued rise ahead.
Spot premiums back with vengeance
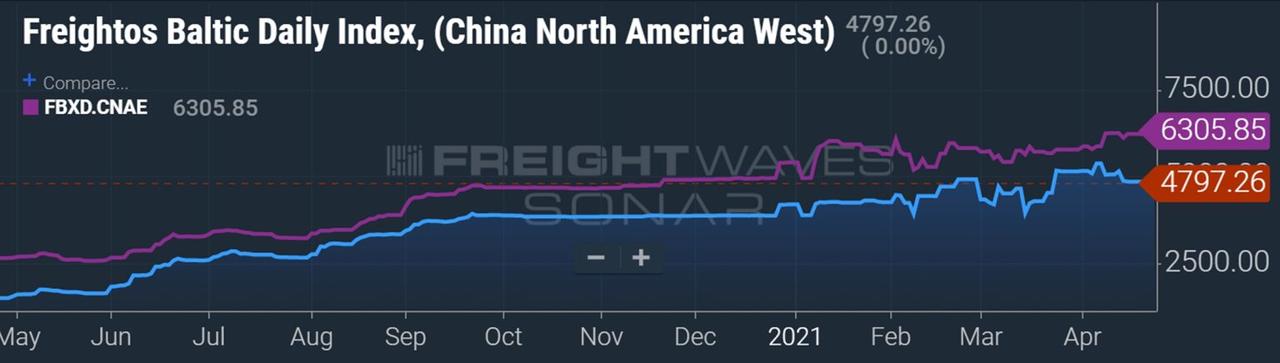
As of Friday, the Freightos Baltic Daily Index assessed the Asia-West Coast spot rate (SONAR: FBXD.CNAW) at $4,797 per forty-foot equivalent unit (FEU) and the Asia-East Coast rate (SONAR: FBXD.CNAE) at $6,306 per FEU — both near all-time highs.
But that’s only part of the rate story. “Indexes are not bills. Premiums are not reflected in the indexes,” said Poskus. Earlier this year, some of the premium charges came down as container availability in Asia improved. That’s reversed, said Poskus, who noted that the Ever Given incident in the Suez Canal pulled container equipment from the market. “Container shortages in Asia are again very bad because of the Ever Given, and it will take another four to six weeks to come back to normal.”
The added premiums to get spot cargo loaded “are back and they’re higher than before,” he said. “They are $2,000-$3,000 above FAK [spot price] and that’s the best case.”
Spot cargo that was booked 21 days prior and was forecast within the shipper’s allocation is still getting FAK pricing on spot, he noted. However, “everything last minute is basically a free-for-all auction. You are basically offering as much money as you can and hoping somebody will take it. Many importers are now struggling. We’re seeing so many new customers approaching us asking for help because they can’t get loaded.”
Contract rates up sharply
A recent presentation by Xeneta, a company that collects contract data, showed Asia-West Coast contracts being negotiated this year at around 30%-50% higher levels than last year.
Poskus’ numbers are around double Xeneta’s. “We are seeing fixed-price increases of slightly over 100% on Asia-West Coast and about 75% on Asia-East Coast,” he said. “Also, almost every single contract rate is subject to peak season surcharges [PSSs], so the prices aren’t exactly fixed. I think the PSSs will reduce the gap between the spot and fixed market.”
Asked about shippers who have yet to conclude their annual contracts, he said, “If you want a fixed price in today’s market, the answer you’ll get from the carriers is that it’s too late. We advised many importers to sign early because the trans-Pacific contract season would close [early] because there’s more demand than supply. And that’s exactly what happened.”
There are exceptions, such as larger shippers with June-to-June contracts who began discussions with carriers earlier this year. “But if you are just a simple importer and you are yet to sign your fixed contract, you will be in the spot market,” said the Flexport vice president.
Advice to importers
Poskus offered several pieces of advice to importers scrambling to get container loads to the U.S.
He noted that carriers need reefers in the U.S. market for refrigerated exports to Asia. On the way back from Asia, these reefers are powered down and can be used as non-operating reefers (NORs) to transport dry cargo. “Believe it or not, carriers are still moving some NORs empty because importers don’t like them. This is a missed opportunity to move cargo in NORs. My advice is: Take that option. If you’re searching for the best solution in this market, you’re going to see even more delays.”
He also suggested moving cargo via less-than-container-load (LCL) shipments. “LCL is still moving. Of course, you cannot move thousands of containers LCL, but if you have something urgent, you can still get space for LCL on May sailings. Instead of waiting, break your some of your shipments down into LCL shipments and at least get some inventory,” he said.
Yet another option: Be creative with routings. For example, direct China-West Coast sailings may be sold out, but cargo can be routed from China through the Panama Canal to Cartagena, Colombia, then back through the canal to the West Coast. “It has a longer transit time but it can be loaded in the same week and it’s an option versus waiting a month and a half to get loaded [for the direct route],” he said.
“Just get your cargo to the continent of North America and from there you can get it to where it needs to go, whether it’s with NORs or LCL or transshipping [through hubs like Cartagena] or shipping it to Canada and then putting it on rail to Chicago and trucking it to New York. It will be expensive, but at least it will get there.
“You have to be flexible. Look for any routing and be creative. It’s a moving target. And don’t wait. If something opens up, act fast.”
April 27, 2021
Container Update
“It’s About To Get Much Worse”: Supply Chains Implode As “Price Doesn’t Even Matter Anymore”
by Tyler DurdenTuesday, Apr 27, 2021 – 02:15 PM
By Greg Miller, of FreightWaves,
The number of container ships stuck at anchor off Los Angeles and Long Beach is down to around 20 per day, from 30 a few months ago. Does this mean the capacity crunch in the trans-Pacific market is finally easing? Absolutely not, warned Nerijus Poskus, vice president of global ocean at freight forwarder Flexport. “It’s not getting better. It’s getting worse,” he told American Shipper in an interview on Monday.
“What I’m seeing is unprecedented. We are seeing a tsunami of freight,” he reported.
“For the month of May, everything on the trans-Pacific is basically sold out. We had one client who needed something loaded in May that was extremely urgent and who was ready to pay $15,000 per container. I couldn’t get it loaded — and we are a growing company that ships a lot of TEUs [twenty-foot equivalent units]. Price doesn’t always even matter anymore.”
Restocking driving volumes higher
Poskus said that trans-Pacific import volumes are still rising. He noted that January trans-Pacific imports were up 10% versus 2019 (comparisons to 2020 numbers are skewed by COVID) and 13.5% in February, then jumped 51% in March. “So, we’re now at 1.5 times pre-pandemic levels.”
With imports far outpacing retail sales growth, he attributed volumes to inventory restocking. “The restocking is actually affecting the trade even more than growth in demand. That tells me that this will last even longer. Let’s say U.S. consumer demand slows down in Q3 and Q4. That’s not expected, but even if it does, [capacity availability and rates] shouldn’t improve quickly, simply because of the huge restocking demand.”
Poskus also believes there is a growing export backlog piling up each day in Asia, awaiting available ship slots. If that backlog grows too big, he said, “I honestly don’t know what’s going to happen.” As a result of the backlog and restocking demand, he thinks “prices will remain high and shipping will probably remain difficult for the rest of this year. And then after that, you have the peak for Chinese New Year in 2022.”
About to get even worse
He said that the situation today is the worst he’s witnessed — and he believes it’s about to get even more severe.
“Buckle up. The month of May will be the worst people have ever seen,” he predicted. Because some shippers will have to wait in line behind the growing backlog in Asia, he expects “what’s going to happen soon is that some importers won’t even be able to get on the boat. For them, it will almost feel like trade is coming to a halt.”
Poskus’ comments mirror cargo bookings data. FreightWaves’ SONAR platform features a proprietary index of shippers’ ocean bookings (SONAR: IOTI.USA). Bookings to the U.S. are measured in TEUs on a 10-day-moving-average basis as of the scheduled date of overseas departure. As of Monday, the index was at a new all-time high and forward bookings data showed a continued rise ahead.
Spot premiums back with vengeance
As of Friday, the Freightos Baltic Daily Index assessed the Asia-West Coast spot rate (SONAR: FBXD.CNAW) at $4,797 per forty-foot equivalent unit (FEU) and the Asia-East Coast rate (SONAR: FBXD.CNAE) at $6,306 per FEU — both near all-time highs.
But that’s only part of the rate story. “Indexes are not bills. Premiums are not reflected in the indexes,” said Poskus. Earlier this year, some of the premium charges came down as container availability in Asia improved. That’s reversed, said Poskus, who noted that the Ever Given incident in the Suez Canal pulled container equipment from the market. “Container shortages in Asia are again very bad because of the Ever Given, and it will take another four to six weeks to come back to normal.”
The added premiums to get spot cargo loaded “are back and they’re higher than before,” he said. “They are $2,000-$3,000 above FAK [spot price] and that’s the best case.”
Spot cargo that was booked 21 days prior and was forecast within the shipper’s allocation is still getting FAK pricing on spot, he noted. However, “everything last minute is basically a free-for-all auction. You are basically offering as much money as you can and hoping somebody will take it. Many importers are now struggling. We’re seeing so many new customers approaching us asking for help because they can’t get loaded.”
Contract rates up sharply
A recent presentation by Xeneta, a company that collects contract data, showed Asia-West Coast contracts being negotiated this year at around 30%-50% higher levels than last year.
Poskus’ numbers are around double Xeneta’s. “We are seeing fixed-price increases of slightly over 100% on Asia-West Coast and about 75% on Asia-East Coast,” he said. “Also, almost every single contract rate is subject to peak season surcharges [PSSs], so the prices aren’t exactly fixed. I think the PSSs will reduce the gap between the spot and fixed market.”
Asked about shippers who have yet to conclude their annual contracts, he said, “If you want a fixed price in today’s market, the answer you’ll get from the carriers is that it’s too late. We advised many importers to sign early because the trans-Pacific contract season would close [early] because there’s more demand than supply. And that’s exactly what happened.”
There are exceptions, such as larger shippers with June-to-June contracts who began discussions with carriers earlier this year. “But if you are just a simple importer and you are yet to sign your fixed contract, you will be in the spot market,” said the Flexport vice president.
Advice to importers
Poskus offered several pieces of advice to importers scrambling to get container loads to the U.S.
He noted that carriers need reefers in the U.S. market for refrigerated exports to Asia. On the way back from Asia, these reefers are powered down and can be used as non-operating reefers (NORs) to transport dry cargo. “Believe it or not, carriers are still moving some NORs empty because importers don’t like them. This is a missed opportunity to move cargo in NORs. My advice is: Take that option. If you’re searching for the best solution in this market, you’re going to see even more delays.”
He also suggested moving cargo via less-than-container-load (LCL) shipments. “LCL is still moving. Of course, you cannot move thousands of containers LCL, but if you have something urgent, you can still get space for LCL on May sailings. Instead of waiting, break your some of your shipments down into LCL shipments and at least get some inventory,” he said.
Yet another option: Be creative with routings. For example, direct China-West Coast sailings may be sold out, but cargo can be routed from China through the Panama Canal to Cartagena, Colombia, then back through the canal to the West Coast. “It has a longer transit time but it can be loaded in the same week and it’s an option versus waiting a month and a half to get loaded [for the direct route],” he said.
“Just get your cargo to the continent of North America and from there you can get it to where it needs to go, whether it’s with NORs or LCL or transshipping [through hubs like Cartagena] or shipping it to Canada and then putting it on rail to Chicago and trucking it to New York. It will be expensive, but at least it will get there.
“You have to be flexible. Look for any routing and be creative. It’s a moving target. And don’t wait. If something opens up, act fast.”
April 25, 2021
Housing Gone Crazy
Home Prices Soar 18% To An All Time High; A Record 58% Of Houses Sell Within Two Weeks Of Listing
by Tyler DurdenSunday, Apr 25, 2021 – 05:25 PM
As if the official government data on soaring home prices wasn’t crazy enough, the latest monthly data from RedFin shows that in April, homes sold at their fastest pace on record with nearly half off-market within one week.
“There has been an ongoing debate at Redfin about whether fear of coronavirus infection was keeping homeowners from selling. With a third of American adults now fully vaccinated and still hardly any homes being listed for sale, we’re close to settling that debate,” said Redfin Chief Economist Daryl Fairweather.
(A quick note on the base effect in the housing market: at this time last year, pandemic stay-at-home orders halted homebuying and selling, which makes year-over-year comparisons unreliable for select housing metrics. As such, this report has been broken into two sections: metrics that are OK to compare to the same period in 2020, and metrics for which it makes more sense to compare to the same period in 2019.)
Metrics to compare to 2020:
- The median home-sale price increased 18% year over year to $344,625, an all-time high. Asking prices reached an all-time high of $356,175.
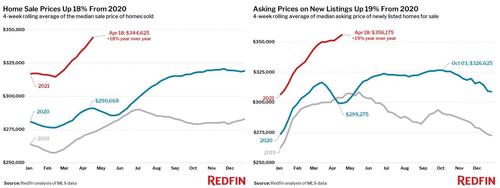
- Homes that sold during the period were on the market for a median of 21 days, the shortest time on market since 2012. This was 16 days fewer than the same period in 2020.
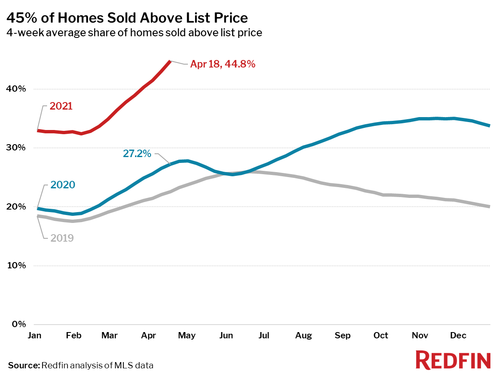
- 45% of homes sold for more than their list price, an all-time high. This was 18 percentage points higher than the same period a year earlier.
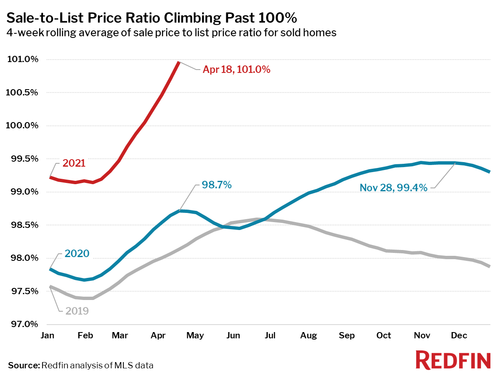
- The average sale-to-list price ratio, which measures how close homes are selling to their asking prices, increased 2.3 percentage points year over year to an all-time high of 101.0%, meaning the average home sold for 1% more than its asking price.
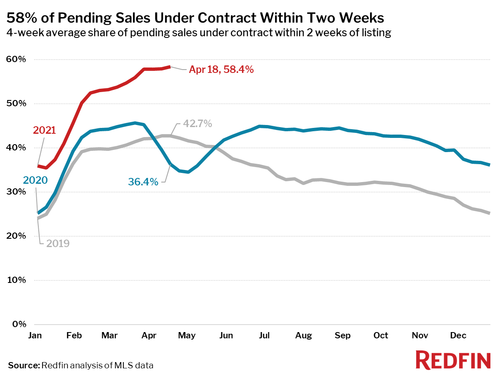
- 58% of homes that went under contract had an accepted offer within the first two weeks on the market. This was a new all-time high (Redfin’s data for this measure goes back to 2012).
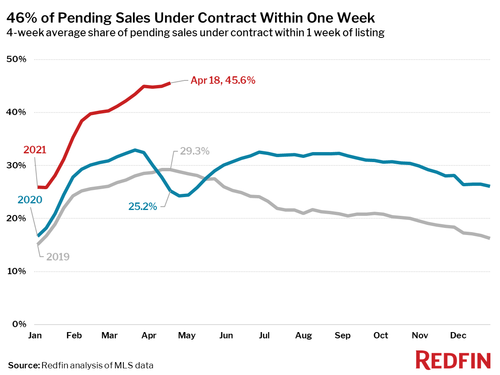
- 46% of homes that went under contract had an accepted offer within one week of hitting the market, an all-time high.
- Meanwhile, with supply at record lows, demand remains near record highs thanks to fiscal stimulus, an exodus from rental units and near-record low mortgage rates.
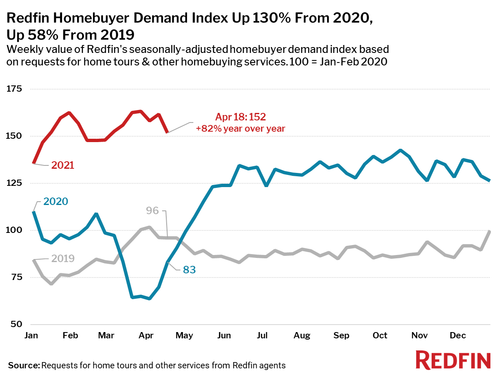
Metrics to compare to 2019:
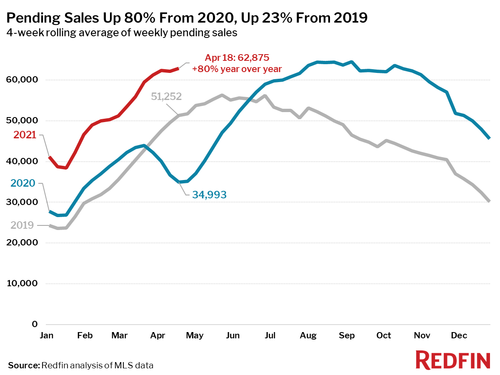
- Pending home sales were up 23% from the same period in 2019.
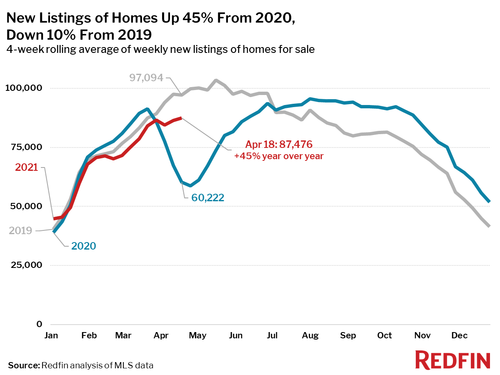
- New listings of homes for sale were down 10% from the same period in 2019.
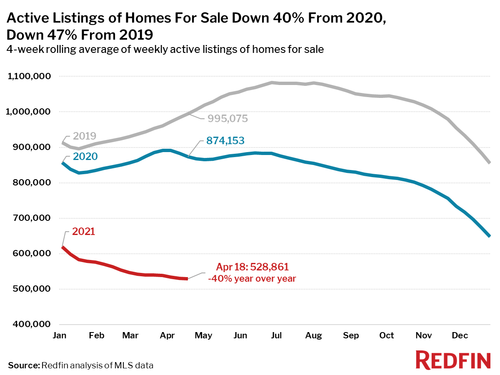
- Active listings (the number of homes listed for sale at any point during the period) fell 47% from the same period in 2019 to a new all-time low.
Fairweather’s conclusion: “Homeowners are staying put because if they move and buy another home they will face a very competitive housing market as buyers, and they don’t need to sell to take advantage of record low mortgage rates. They can just refinance their current home. On top of that, builders are struggling to construct new homes given an ongoing lumber shortage. Without more homeowners listing, buyers are scrambling to compete for the limited number of homes on the market, which continues to drive prices up to new heights.”
April 25, 2021
Housing Gone Crazy
Home Prices Soar 18% To An All Time High; A Record 58% Of Houses Sell Within Two Weeks Of Listing
by Tyler DurdenSunday, Apr 25, 2021 – 05:25 PM
As if the official government data on soaring home prices wasn’t crazy enough, the latest monthly data from RedFin shows that in April, homes sold at their fastest pace on record with nearly half off-market within one week.
“There has been an ongoing debate at Redfin about whether fear of coronavirus infection was keeping homeowners from selling. With a third of American adults now fully vaccinated and still hardly any homes being listed for sale, we’re close to settling that debate,” said Redfin Chief Economist Daryl Fairweather.
(A quick note on the base effect in the housing market: at this time last year, pandemic stay-at-home orders halted homebuying and selling, which makes year-over-year comparisons unreliable for select housing metrics. As such, this report has been broken into two sections: metrics that are OK to compare to the same period in 2020, and metrics for which it makes more sense to compare to the same period in 2019.)
Metrics to compare to 2020:
- The median home-sale price increased 18% year over year to $344,625, an all-time high. Asking prices reached an all-time high of $356,175.
- Homes that sold during the period were on the market for a median of 21 days, the shortest time on market since 2012. This was 16 days fewer than the same period in 2020.
- 45% of homes sold for more than their list price, an all-time high. This was 18 percentage points higher than the same period a year earlier.
- The average sale-to-list price ratio, which measures how close homes are selling to their asking prices, increased 2.3 percentage points year over year to an all-time high of 101.0%, meaning the average home sold for 1% more than its asking price.
- 58% of homes that went under contract had an accepted offer within the first two weeks on the market. This was a new all-time high (Redfin’s data for this measure goes back to 2012).
- 46% of homes that went under contract had an accepted offer within one week of hitting the market, an all-time high.
- Meanwhile, with supply at record lows, demand remains near record highs thanks to fiscal stimulus, an exodus from rental units and near-record low mortgage rates.
Metrics to compare to 2019:
- Pending home sales were up 23% from the same period in 2019.
- New listings of homes for sale were down 10% from the same period in 2019.
- Active listings (the number of homes listed for sale at any point during the period) fell 47% from the same period in 2019 to a new all-time low.
Fairweather’s conclusion: “Homeowners are staying put because if they move and buy another home they will face a very competitive housing market as buyers, and they don’t need to sell to take advantage of record low mortgage rates. They can just refinance their current home. On top of that, builders are struggling to construct new homes given an ongoing lumber shortage. Without more homeowners listing, buyers are scrambling to compete for the limited number of homes on the market, which continues to drive prices up to new heights.”
 Everchem Updates Archive
  Sign Up for Email Updates