
Current Affairs
April 12, 2021
More Logistics Info
This Could Be The Hottest Summer Ever… For Freight
by Tyler DurdenSunday, Apr 11, 2021 – 03:00 PM
By Zach Strickland of FreightWaves,
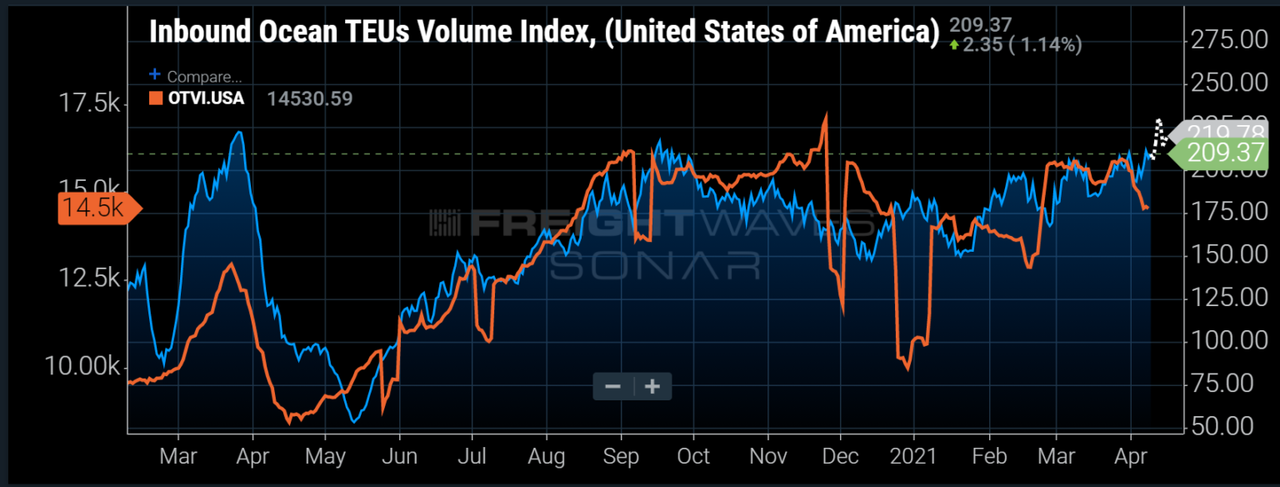
The Inbound Ocean TEU Volume Index (IOTI), which measures maritime bookings for twenty-foot equivalent units for U.S. imports, is set to hit an all-time high this week. The IOTI starts in January 2019 but covers one of the most active periods in maritime shipping thanks to the pandemic. With imports being tied more closely than ever to surface freight volumes and transportation demand, this could be a signal of an extremely active summer for domestic surface transportation providers.
Import booking activity measures freight that will hit the U.S. two to six weeks in advance and has been connected to surface transportation volumes over the past year. After a quicker-than-anticipated recovery in consumer spending on durable goods last spring, shippers found themselves low on inventory and began placing orders at a record pace last May.
Whereas the connection between truckload and import volumes has not always been this close, the urgency of the past year has closed the gap between the time the freight is on the ship to the time it moves on a truck.
With many shippers caught off guard by changing consumer behaviors, there was no budget or plan for what occurred in most of 2020. Companies have found themselves playing catch-up most of the year, and the recent surge in consumer spending thanks to a new stimulus bill and continued quarantine this winter has not helped them recover.
The IOTI shows bookings up to a week in advance, meaning it is measuring freight that is being requested to leave their ports of origin over the next seven days. The spike in bookings over the next week is on the heels of a longer-running increase that began in late January.
Bookings do not necessarily translate to freight being moved, as the maritime providers do not necessarily accept the request, similar to domestic truckload, but it is a sign that shippers are becoming increasingly active in trying to secure capacity on the water. Looking at the Van Outbound Tender Volume Index (VOTVI), there are similar moments when shippers appear to spam their providers just to increase the odds of success.
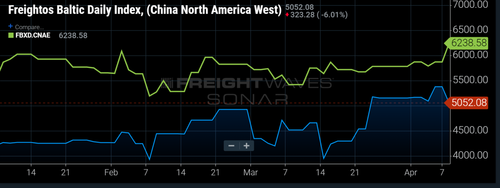
This type of activity keeps upward pressure on rates as little to no gains in total available capacity are occurring, essentially bidding up the price. The Freightos Baltic Daily Indices that measure the average spot price for shipping a forty-foot equivalent unit across the water from China to North America’s East and West coasts continue to hit all-time highs.
The East Coast rate broke $6,000 for the first time this week as shippers are booking more loads to the eastern half of the U.S., attempting to bypass the port congestion in Southern California. This is another sign that freight volumes will continue to flood the U.S. in the coming weeks. It is also a sign that shipping patterns are changing, which will potentially put more pressure on carrier networks as more freight enters in areas they are unaccustomed to servicing at volume.
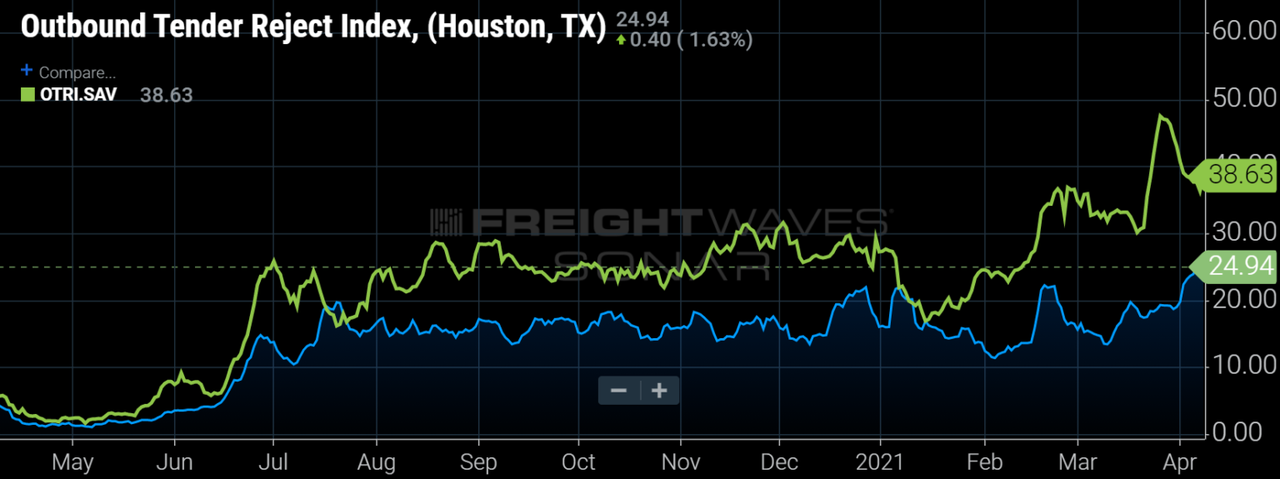
The Houston and Savannah, Georgia, markets have both seen trucking volumes surge over the past month and capacity tighten to record levels — tender rejection rates hit all-time highs in both markets over the past two weeks.
Most carriers have focused on getting trucks to Southern California to take advantage of high mileage, high-paying loads that keep utilization numbers high and margins wide. Houston and Savannah tend to have lower-mileage and smaller-margin loads thanks to regional density of carriers and destinations.
There is already enough freight to keep carriers busy on the West Coast and it is very difficult to alter networks quickly. With more freight on the way, this summer may be the hottest (market) on record.
April 12, 2021
More Logistics Info
This Could Be The Hottest Summer Ever… For Freight
by Tyler DurdenSunday, Apr 11, 2021 – 03:00 PM
By Zach Strickland of FreightWaves,
The Inbound Ocean TEU Volume Index (IOTI), which measures maritime bookings for twenty-foot equivalent units for U.S. imports, is set to hit an all-time high this week. The IOTI starts in January 2019 but covers one of the most active periods in maritime shipping thanks to the pandemic. With imports being tied more closely than ever to surface freight volumes and transportation demand, this could be a signal of an extremely active summer for domestic surface transportation providers.
Import booking activity measures freight that will hit the U.S. two to six weeks in advance and has been connected to surface transportation volumes over the past year. After a quicker-than-anticipated recovery in consumer spending on durable goods last spring, shippers found themselves low on inventory and began placing orders at a record pace last May.
Whereas the connection between truckload and import volumes has not always been this close, the urgency of the past year has closed the gap between the time the freight is on the ship to the time it moves on a truck.
With many shippers caught off guard by changing consumer behaviors, there was no budget or plan for what occurred in most of 2020. Companies have found themselves playing catch-up most of the year, and the recent surge in consumer spending thanks to a new stimulus bill and continued quarantine this winter has not helped them recover.
The IOTI shows bookings up to a week in advance, meaning it is measuring freight that is being requested to leave their ports of origin over the next seven days. The spike in bookings over the next week is on the heels of a longer-running increase that began in late January.
Bookings do not necessarily translate to freight being moved, as the maritime providers do not necessarily accept the request, similar to domestic truckload, but it is a sign that shippers are becoming increasingly active in trying to secure capacity on the water. Looking at the Van Outbound Tender Volume Index (VOTVI), there are similar moments when shippers appear to spam their providers just to increase the odds of success.
This type of activity keeps upward pressure on rates as little to no gains in total available capacity are occurring, essentially bidding up the price. The Freightos Baltic Daily Indices that measure the average spot price for shipping a forty-foot equivalent unit across the water from China to North America’s East and West coasts continue to hit all-time highs.
The East Coast rate broke $6,000 for the first time this week as shippers are booking more loads to the eastern half of the U.S., attempting to bypass the port congestion in Southern California. This is another sign that freight volumes will continue to flood the U.S. in the coming weeks. It is also a sign that shipping patterns are changing, which will potentially put more pressure on carrier networks as more freight enters in areas they are unaccustomed to servicing at volume.
The Houston and Savannah, Georgia, markets have both seen trucking volumes surge over the past month and capacity tighten to record levels — tender rejection rates hit all-time highs in both markets over the past two weeks.
Most carriers have focused on getting trucks to Southern California to take advantage of high mileage, high-paying loads that keep utilization numbers high and margins wide. Houston and Savannah tend to have lower-mileage and smaller-margin loads thanks to regional density of carriers and destinations.
There is already enough freight to keep carriers busy on the West Coast and it is very difficult to alter networks quickly. With more freight on the way, this summer may be the hottest (market) on record.
April 10, 2021
Inflation Pressure
Producer Prices Blow Out
by Wolf Richter • Apr 9, 2021 •
And companies have been reporting that they’re able to pass on those surging costs. So here we go with inflation.
By Wolf Richter for WOLF STREET.
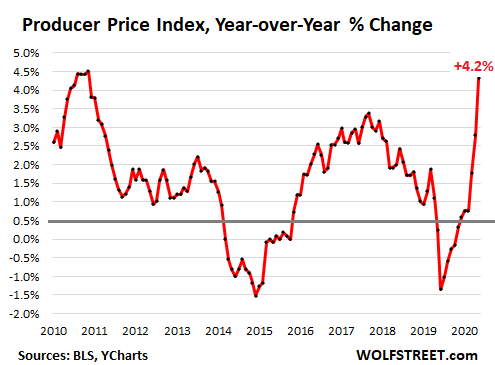
Inflation that producers are experiencing is now blowing out. The surging input costs and the ability to pass on those higher input costs that have been reported by company executives as part of the services PMIs and manufacturing PMIs, and that owners of small businesses have told me about for months, have now solidly fired up the Producer Price Index for final demand, which in March jumped by 1.0% from February – double the rate that economists polled by Reuters had forecast – after having jumped 0.5% in February, and 1.3% in January. The PPI has now taken off, after hovering in fairly benign territory last year.
Compared to March last year, the PPI jumped by 4.2%, the sharpest year-over-year increase since 2011, according to the Bureau of Labor Statistics today. Note the surge over the past three months (data via YCharts):
The “Base Effect” that I discussed yesterday can be blamed for only a portion of the year-over-year increase. A big part of the base effect is going to come in April.
The PPI hit a high in January 2020 with an index value of 119.2. In February and March last year, it dropped 0.5% from the prior month, and in April it plunged 1.1% to an index value of 116.7, driven by the collapse in fuel prices. And that was it in terms of declines. It has been rising ever since (data via YCharts):
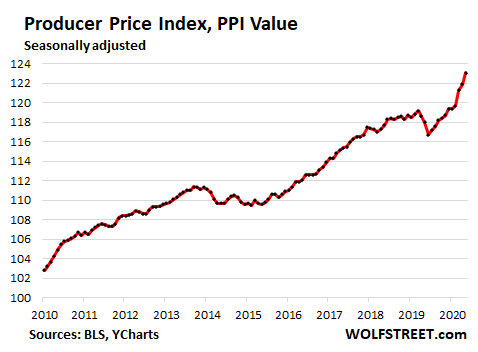
What might April look like? Today’s index value at 123.1 is already 5.5% higher than that of April last year. If the PPI rises 0.5% in April from today’s level, it would make for a 6% year-over-year increase, the highest since the index was started in November 2009. And this would include the full brunt of the base effect.
The index for prices of goods soared 1.7% in March from February, the biggest increase since the data series was started in 2009. Energy costs jumped 5.9% for the month. Within that, gasoline prices jumped 8.8%.
The index for prices of services jumped 0.7%, the third month in a row of increases. These services include wholesaling of machinery and vehicles, which soared 6.7% in March from February, confirming the giant jumps in wholesale prices for used vehicles that I reported on March 27 based on weekly auction data.
Excluding prices of foods, energy, and trade services, the index jumped 0.6% for the month and was up 3.1% year-over-year.
So here we go with inflation pressures building up in the pipeline. The producer price index measures inflation for companies – input cost increases. And these companies are now reporting in the PMIs that they’re able to pass on those price increases, ultimately to consumers.
Enjoy reading WOLF STREET and want to support it? Using ad blockers – I totally get why – but want to support the site? You can donate. I appreciate it immensely. Click on the beer and iced-tea mug to find out how:

Would you like to be notified via email when WOLF STREET publishes a new article? Sign up here.
April 10, 2021
Inflation Pressure
Producer Prices Blow Out
by Wolf Richter • Apr 9, 2021 •
And companies have been reporting that they’re able to pass on those surging costs. So here we go with inflation.
By Wolf Richter for WOLF STREET.
Inflation that producers are experiencing is now blowing out. The surging input costs and the ability to pass on those higher input costs that have been reported by company executives as part of the services PMIs and manufacturing PMIs, and that owners of small businesses have told me about for months, have now solidly fired up the Producer Price Index for final demand, which in March jumped by 1.0% from February – double the rate that economists polled by Reuters had forecast – after having jumped 0.5% in February, and 1.3% in January. The PPI has now taken off, after hovering in fairly benign territory last year.
Compared to March last year, the PPI jumped by 4.2%, the sharpest year-over-year increase since 2011, according to the Bureau of Labor Statistics today. Note the surge over the past three months (data via YCharts):
The “Base Effect” that I discussed yesterday can be blamed for only a portion of the year-over-year increase. A big part of the base effect is going to come in April.
The PPI hit a high in January 2020 with an index value of 119.2. In February and March last year, it dropped 0.5% from the prior month, and in April it plunged 1.1% to an index value of 116.7, driven by the collapse in fuel prices. And that was it in terms of declines. It has been rising ever since (data via YCharts):
What might April look like? Today’s index value at 123.1 is already 5.5% higher than that of April last year. If the PPI rises 0.5% in April from today’s level, it would make for a 6% year-over-year increase, the highest since the index was started in November 2009. And this would include the full brunt of the base effect.
The index for prices of goods soared 1.7% in March from February, the biggest increase since the data series was started in 2009. Energy costs jumped 5.9% for the month. Within that, gasoline prices jumped 8.8%.
The index for prices of services jumped 0.7%, the third month in a row of increases. These services include wholesaling of machinery and vehicles, which soared 6.7% in March from February, confirming the giant jumps in wholesale prices for used vehicles that I reported on March 27 based on weekly auction data.
Excluding prices of foods, energy, and trade services, the index jumped 0.6% for the month and was up 3.1% year-over-year.
So here we go with inflation pressures building up in the pipeline. The producer price index measures inflation for companies – input cost increases. And these companies are now reporting in the PMIs that they’re able to pass on those price increases, ultimately to consumers.
Enjoy reading WOLF STREET and want to support it? Using ad blockers – I totally get why – but want to support the site? You can donate. I appreciate it immensely. Click on the beer and iced-tea mug to find out how:
Would you like to be notified via email when WOLF STREET publishes a new article? Sign up here.
April 5, 2021
PFA Spring Meeting
Polyurethane Foam Association To Offer “Hybrid” Meeting Format
For Spring
The May 26-27 Meeting Will Be Held Live in St. Petersburg, FL And Streamed Online
LOUDON, TN (April 5, 2021)—The Polyurethane Foam Association’s Spring Meeting May 26-
27 will be conducted in a “hybrid” format, with both a live meeting at the Vinoy Renaissance in
St. Petersburg, FL, and a virtual portal for online participation. Registration details are available
at www.pfa.org/2021-spring-meeting.
PFA conducted a poll of members in early March, and respondents strongly favored the hybrid
approach, allowing members to choose in-person or online participation based on health
considerations and company travel policies.
The Vinoy Renaissance has reopened with limited capacity, and has protocols in place to
enhance safety, including mandatory masks in indoor public areas, social distancing, and
frequent sanitation.
“From the moment we opened the registration website, we had people signing up to come to the
live meeting,” noted Russ Batson, PFA’s Executive Director “Many people are eager to get back
to networking and attending conferences. I’ve had several people comment that the constrained
schedule of industry events last year made them realize how much they enjoy getting together
and interacting with colleagues and peers.”
“We wanted to provide our membership with as much flexibility as possible, because we’re still
in a very fluid situation,” said Chip Holton of NCFI Polyurethanes, PFA’s President. “We are
fortunate to have a long-standing relationship with a superb property in the Vinoy Renaissance,
which has taken exceptional measures to protect its guests. And we have the technology
available to connect other members who may not be there in person, but can participate and
contribute remotely.”
The meeting will feature an Industry Issues Session, which will cover topics including
isocyanates, auto industry trends, regulatory topics, and raw material/logistics challenges. A
Technical Program will feature presentations on new flexible foam formulations, manufacturing,
and recycling. A General Business Session will cover association business, celebrate PFA’s 40 th
Anniversary, and feature a keynote address from author Stephen Vogel.
Vogel is the author of Betrayal in Berlin: The True Story of the Cold War’s Most Audacious
Espionage Operation, published in 2019 by Custom House, a William Morrow imprint. He is a
veteran journalist who reported for The Washington Post for more than two decades. His
reporting about the war in Afghanistan was part of a package of Washington Post stories selected
as a finalist for the 2002 Pulitzer Prize.
The Polyurethane Foam Association is a trade association founded in 1980 to help educate foam
users, allied industries, and other stakeholders about flexible polyurethane foam (FPF). PFA
provides facts on environmental, health and safety issues and technical information on the
performance of FPF in consumer and industrial products. FPF is used as a key comfort
component in most upholstered furniture and mattress products, along with automotive seating,
carpet cushion, packaging, and numerous other applications. Learn more at www.pfa.org.
 Everchem Updates Archive
  Sign Up for Email Updates