Current Affairs
June 8, 2022
The New Reality
US Import Demand Is Dropping Off A Cliff
by Tyler DurdenTuesday, Jun 07, 2022 – 07:25 PM
By Henry Byers of FreightWaves
The latest ocean container bookings data reveals that despite the strong levels of inbound cargo during the first five months of 2022, import demand is not just softening — it’s dropping off a cliff. Because capacity on the trans-Pacific has remained relatively stable, Drewry’s container spot rates from China to the West Coast have plunged 41% month-over-month to $9,630.
Freight forwarders will enjoy expanding margins on ocean freight, while U.S. trucking carriers and intermodal volume providers may start to see volume risks.
Consumer buying patterns are rapidly normalizing to pre-COVID levels, and U.S. retailers are stuck with too much inventory. Target shares dropped Tuesday morning after executives said the company would mark down unwanted items, cancel purchase orders and move quickly to get rid of excess inventory.
Container imports bound for the U.S. have dropped over 36% since May 24. (This index measures departing container volumes at the port of origin). This is a troubling sign for domestic U.S. freight markets that have been benefiting from an unprecedented surge of containerized import volumes over the last 18 months. Since ocean transit times for these inbound container volumes have recently been averaging between 30 and 35 days, we will begin seeing the softer volumes show up at U.S. ports in the first couple of weeks of July.
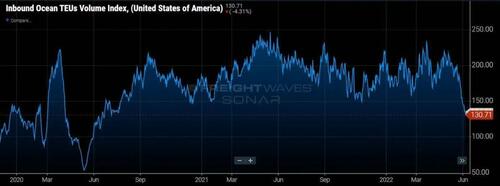
This also puts U.S. containerized imports from all countries of origin down 36% year-over-year, which is a reversion back to the volume levels of the summer of 2020. But what is the cause of the sudden drop in containerized import volumes? Well, there are a few simultaneous factors converging that serve as likely explanations for why volumes are suddenly dropping.
The inventory glut
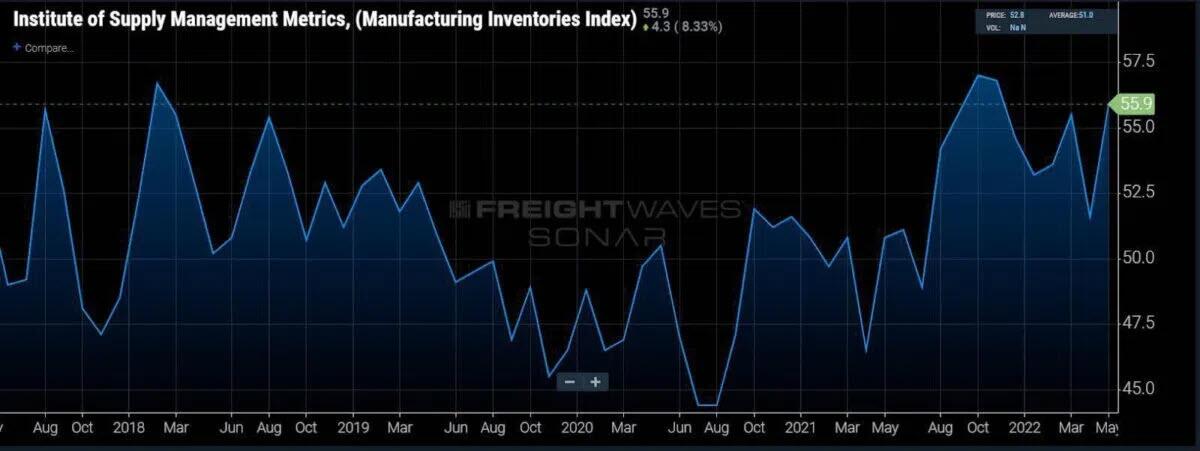
At the forefront of these reasons is the buildup of inventory here in the U.S. resulting from companies attempting to both replenish inventories that were largely depleted in 2021, but also from these companies wanting to keep enough inventory on hand in case of any further disruptions that may occur. Consecutive rounds of COVID lockdowns in China only exacerbated those fears, but after the war between Russia and Ukraine broke out more than 100 days ago, the geopolitical risks seem to only be escalating, and for better or for worse, companies decided that they would rather have the inventory safely here in the U.S. than risk having it abroad should there be a sudden surge in consumer demand.
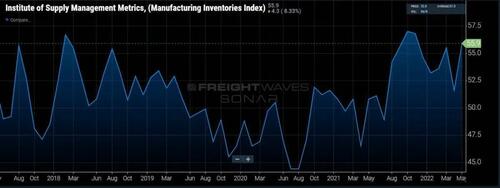
So, if consumers are now shifting buying trends from goods to services, those goods-producing companies may get stuck with too much inventory or the wrong inventory in order to try to capture sales. This buildup of inventory will inevitably lead to a slowdown in new import orders abroad and thus will only add to the demand destruction we are seeing for containerized imports into the U.S. Just Tuesday Target announced an “aggressive” inventory reduction plan led by canceling orders and marking down even more inventory.
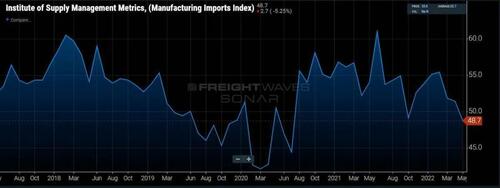
The chart above, displaying rising inventories, and the chart below, displaying falling imports, reveal that retailers are upside down after the last surge of freight to hit the United States’ shores and are throttling down freight velocity in their networks.
The consumer is getting crushed
Conditions for the consumer seem to be getting worse and worse as inflation takes hold and prices get more and more expensive. Just this week, AAA reported a new record high for gasoline prices at $4.51 per gallon on its national index.
Some economists speculate that with the Fed beginning to raise rates and draw down its balance sheet, we may be experiencing “peak inflation.” However, even if inflationary pressures begin to ease, consumers may still be overexposed to rising interest rates through the use of credit in a way that could further deteriorate demand and discretionary spending.
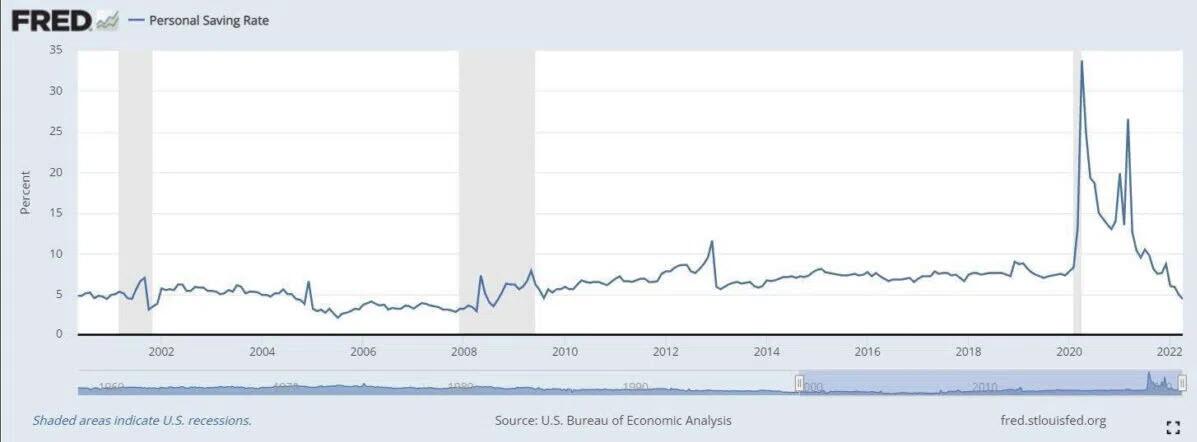
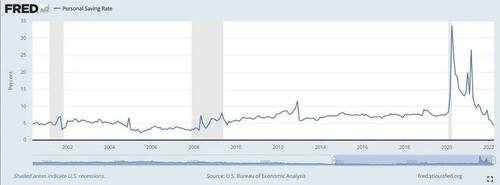
Credit card spending has been accelerating at a time when personal savings rates have continued to decrease and move toward some of their lowest rates (last reading 4.4) since the Great Financial Crisis (4.5 in August 2009). There are two ways to read very low savings rates: either consumers are exceptionally confident and exuberantly spending their money or consumers are spending every last dollar they have in an attempt to keep their heads above water in a high-inflation environment. Either way, there isn’t any slack left in consumer wallets — it’s hard to imagine consumer spending growing from here.
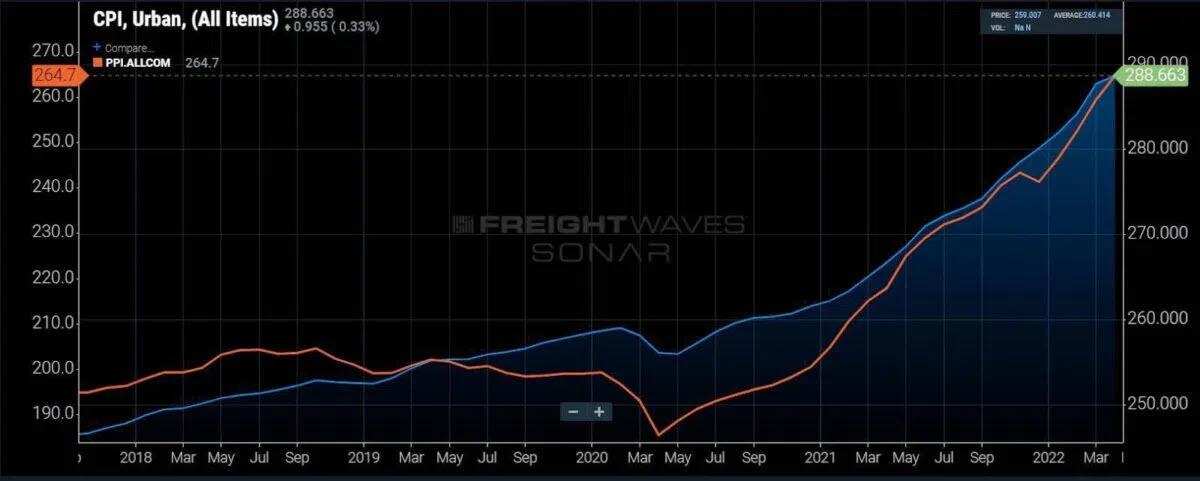
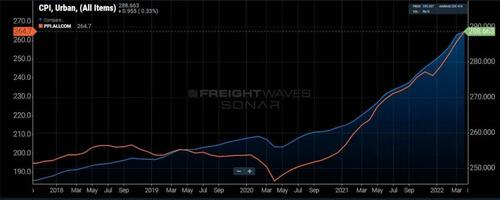
Unfortunately, inflationary pressures in energy and food don’t know or care that American consumers are out of money — inflation in those sectors was caused by supply shocks, not artificially stimulated demand. It is also important to keep in mind that the rate of growth for the Producer Price Index has been outpacing the Consumer Price Index, so some producers may still be taking some hits from rising costs that have not yet been passed on to the consumer.
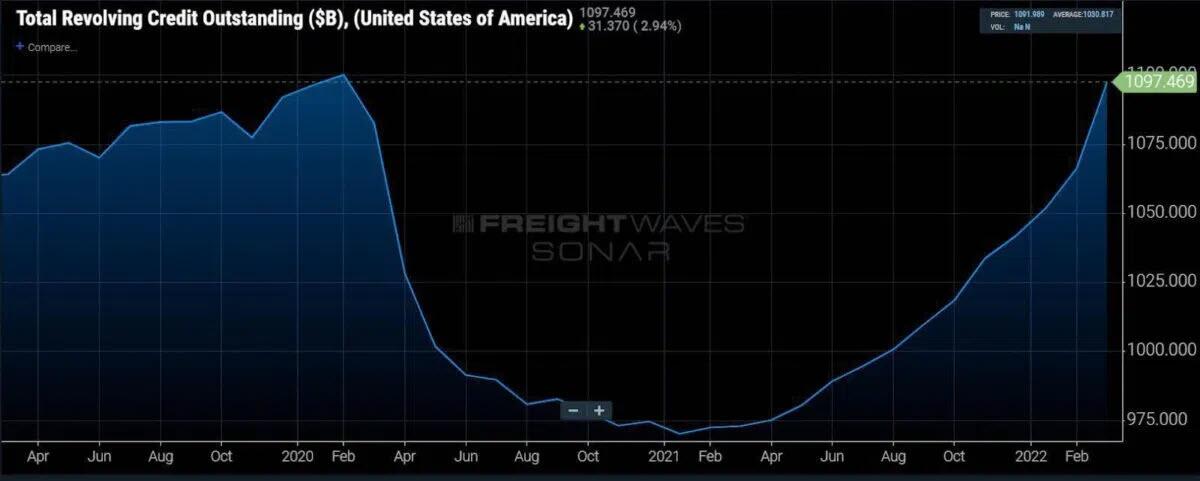
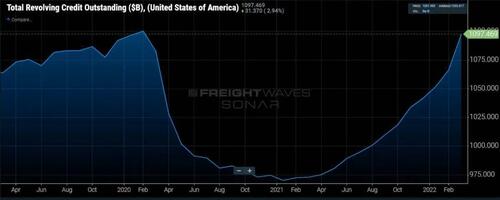
So even though total revolving credit outstanding is just at pre-pandemic levels, it is nonetheless accelerating, and if prices continue to rise, it is reasonable to expect that revolving credit outstanding will rise as well.
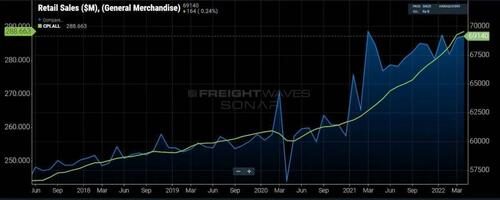
At first glance, one may look at retail sales (charted below) and conclude that they are growing, but keep in mind that the report is measured in nominal dollars unadjusted for inflation and represents increases in the prices of goods being sold — not so much the strength or resilience of consumers. Goods-producing companies will not be alone. Services and tech companies will also be under pressure in the coming months, and sell-offs could lead to layoffs.
As we see a growing number of signs pointing toward further demand destruction from U.S. consumers, and thus a further reversion of import container volumes back to levels closer to 2019, it is worth examining the trade lane that handles a majority of that volume: China to the U.S.
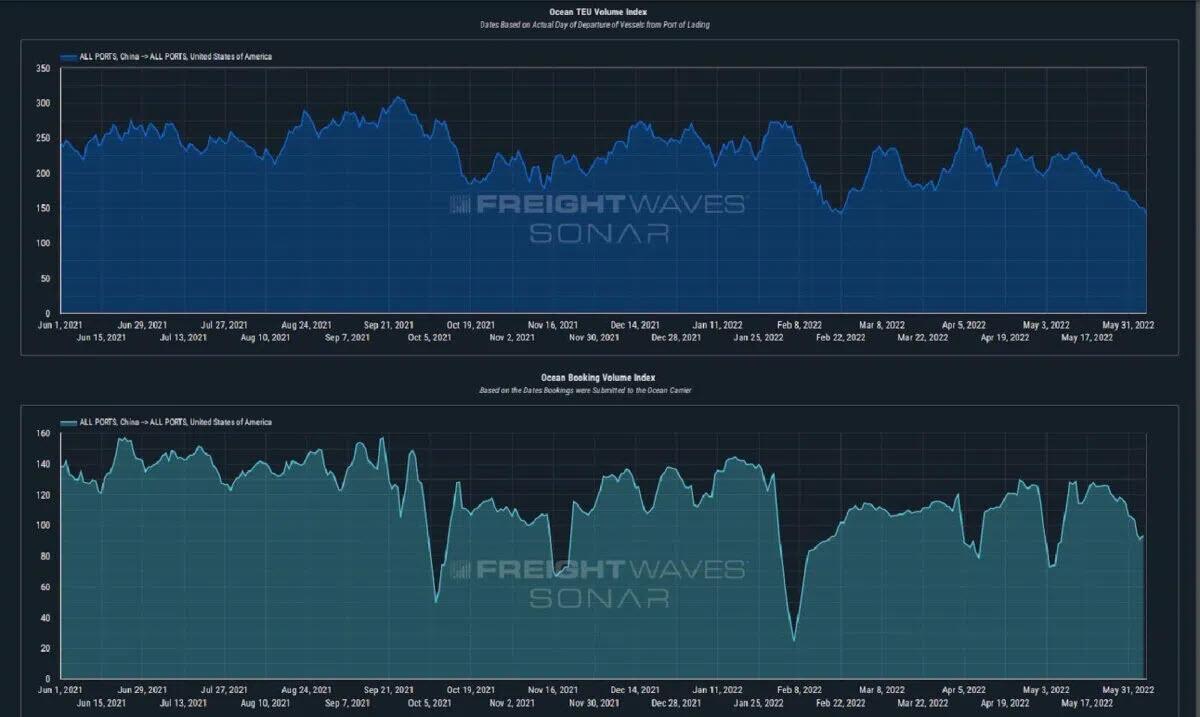
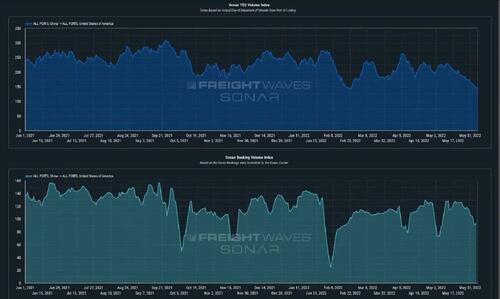
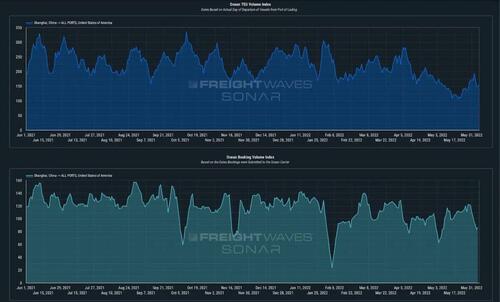
When looking at aggregated volumes from China to all U.S. ports, we are able to see that volumes have been declining from the “peak of peak season” in September 2021 through Tuesday (currently down 51% from that peak). While late March through the beginning of May is historically (pre-trade war/pre-pandemic) a softer period for volumes on this trade lane, it is important to realize that this decline in volumes has also been amplified by the COVID restrictions and lockdowns implemented by the Chinese government in Shanghai as well as other important manufacturing regions in China (most notably around Beijing and its major nearby port of Tianjin).
Despite the lockdowns, a decline in volumes on this major trade lane was seemingly inevitable in 2022 as the massive volumes moved between these two countries in 2021 were at unprecedented and unsustainable levels. Now some industry observers are calling for a “container surge” as China reopens, but it seems that the demand destruction has already spilled over into this trade lane in a big way.
The ‘container surge’ that never was
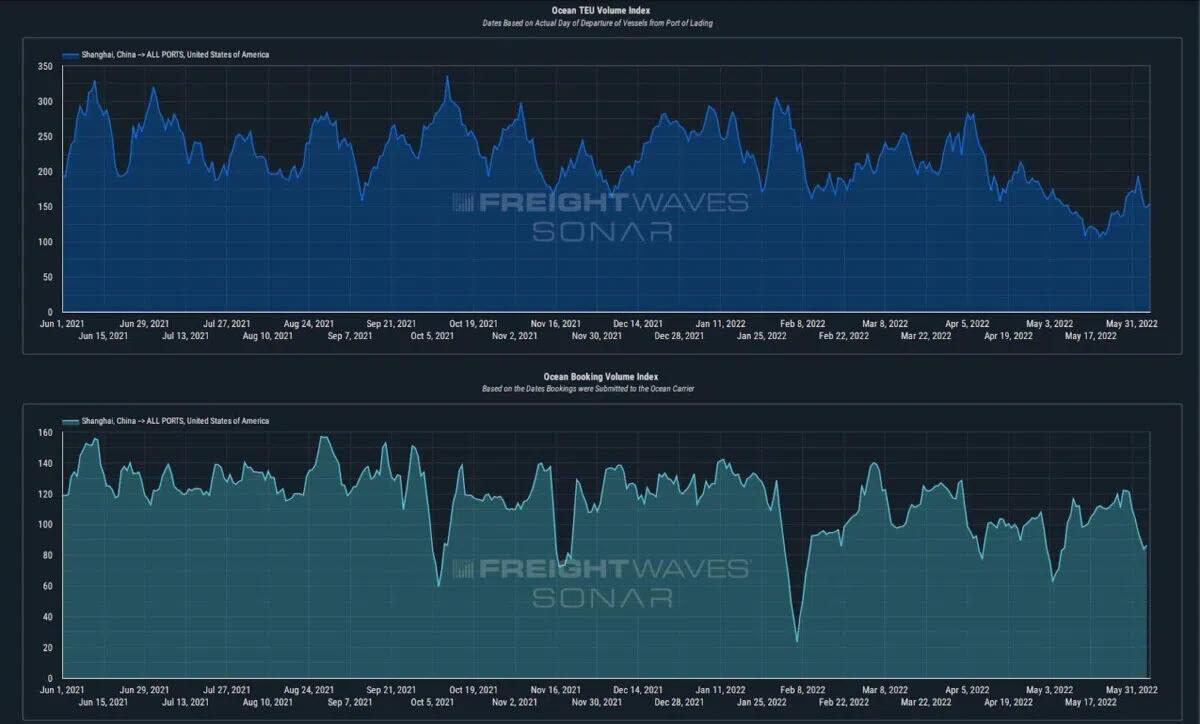
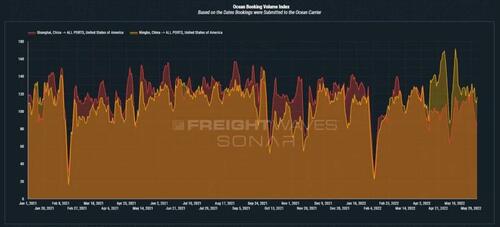
The “container surge” that many have been expecting from Shanghai (thought to be building during the lockdowns) appears to have mostly already been rerouted through the Port of Ningbo (yellow). With access to the Port of Shanghai being largely blocked due to landside restrictions (i.e., road closures), shippers were quick to reroute volumes through the closest alternate major port to the Port of Shanghai (red). Since the lockdowns began in Shanghai in late March, the decline in Shanghai new bookings (and thus load volumes) has been more than offset by a surge of volumes through Ningbo from rerouted containers. This led to booking lead times hitting their lowest levels on record as shippers scrambled to get their volumes moving.
Despite the reopening of Shanghai, total container volumes from China to the U.S. have continued their downward trajectory, and that trend is not likely to be reversed by an easing of COVID restrictions alone. As of the latest data points, if this is the “container surge” from Shanghai to U.S. ports upon its reopening last Wednesday, then right now, it is barely a “blip on the radar” compared to the volumes from Shanghai to the U.S. that what we have seen over the last 18 to 22 months. This could easily change within our bookings data for the weeks ahead, and if there is pent-up demand, it will undoubtedly show up in the bookings data, but as of Tuesday, it has not yet materialized in any significant way.
This steady decline in volumes from China to the U.S. has also put significant downward pressure on spot rates from the demand side. As capacity remained relatively consistent in the first few weeks post-lockdown (March 28 onward), the drop in volumes caused a decline in both the Freightos Baltic Daily Index and the Drewry World Container Index spot rates from China/East Asia to the U.S. West Coast (down 41% per FEU month-over-month [m/m] – $9,630), as well as from China/East Asia to the U.S. East Coast (down 36% per FEU m/m – $11,907). While this has been a welcome downturn in spot rates for shippers that battled the record-setting spot rates of 2021, we should also keep in mind that these spot rates remain elevated on a y/y basis (73% to the West Coast and 59% to the East Coast).
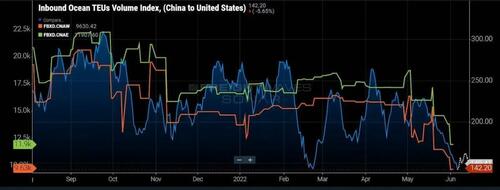
If bookings continue to soften through June, we expect to see spot rates on this trade lane decline further, but ocean carriers may go to greater lengths than ever before to try and protect their record-setting earnings. They have already been cutting capacity on major trade routes through measures such as blank sailings and reassigning vessels to other services, but if the decline in volumes accelerates in the weeks ahead, we may see the alliances test their strength and discipline like never before.
If rates start dropping quickly, it is reasonable to suspect that the ocean carriers that have not locked in a majority of their allocations in longer-term contracts may begin aggressively undercutting one another as they compete in the spot market.
Interestingly enough, the last port labor negotiations at LAX/LGB that caused disruptions to supply chains (and thus led to a buildup of inventory in the U.S.) in 2014-15 created a similar situation. Coming off of a record year, that may sound like an unlikely scenario, but there is a distinct possibility that sharply softening spot rates could cause a shakeup and/or reorganization of the current alliances.
https://www.zerohedge.com/markets/us-import-demand-dropping-cliff
June 8, 2022
The New Reality
US Import Demand Is Dropping Off A Cliff
by Tyler DurdenTuesday, Jun 07, 2022 – 07:25 PM
By Henry Byers of FreightWaves
The latest ocean container bookings data reveals that despite the strong levels of inbound cargo during the first five months of 2022, import demand is not just softening — it’s dropping off a cliff. Because capacity on the trans-Pacific has remained relatively stable, Drewry’s container spot rates from China to the West Coast have plunged 41% month-over-month to $9,630.
Freight forwarders will enjoy expanding margins on ocean freight, while U.S. trucking carriers and intermodal volume providers may start to see volume risks.
Consumer buying patterns are rapidly normalizing to pre-COVID levels, and U.S. retailers are stuck with too much inventory. Target shares dropped Tuesday morning after executives said the company would mark down unwanted items, cancel purchase orders and move quickly to get rid of excess inventory.
Container imports bound for the U.S. have dropped over 36% since May 24. (This index measures departing container volumes at the port of origin). This is a troubling sign for domestic U.S. freight markets that have been benefiting from an unprecedented surge of containerized import volumes over the last 18 months. Since ocean transit times for these inbound container volumes have recently been averaging between 30 and 35 days, we will begin seeing the softer volumes show up at U.S. ports in the first couple of weeks of July.
This also puts U.S. containerized imports from all countries of origin down 36% year-over-year, which is a reversion back to the volume levels of the summer of 2020. But what is the cause of the sudden drop in containerized import volumes? Well, there are a few simultaneous factors converging that serve as likely explanations for why volumes are suddenly dropping.
The inventory glut
At the forefront of these reasons is the buildup of inventory here in the U.S. resulting from companies attempting to both replenish inventories that were largely depleted in 2021, but also from these companies wanting to keep enough inventory on hand in case of any further disruptions that may occur. Consecutive rounds of COVID lockdowns in China only exacerbated those fears, but after the war between Russia and Ukraine broke out more than 100 days ago, the geopolitical risks seem to only be escalating, and for better or for worse, companies decided that they would rather have the inventory safely here in the U.S. than risk having it abroad should there be a sudden surge in consumer demand.
So, if consumers are now shifting buying trends from goods to services, those goods-producing companies may get stuck with too much inventory or the wrong inventory in order to try to capture sales. This buildup of inventory will inevitably lead to a slowdown in new import orders abroad and thus will only add to the demand destruction we are seeing for containerized imports into the U.S. Just Tuesday Target announced an “aggressive” inventory reduction plan led by canceling orders and marking down even more inventory.
The chart above, displaying rising inventories, and the chart below, displaying falling imports, reveal that retailers are upside down after the last surge of freight to hit the United States’ shores and are throttling down freight velocity in their networks.
The consumer is getting crushed
Conditions for the consumer seem to be getting worse and worse as inflation takes hold and prices get more and more expensive. Just this week, AAA reported a new record high for gasoline prices at $4.51 per gallon on its national index.
Some economists speculate that with the Fed beginning to raise rates and draw down its balance sheet, we may be experiencing “peak inflation.” However, even if inflationary pressures begin to ease, consumers may still be overexposed to rising interest rates through the use of credit in a way that could further deteriorate demand and discretionary spending.
Credit card spending has been accelerating at a time when personal savings rates have continued to decrease and move toward some of their lowest rates (last reading 4.4) since the Great Financial Crisis (4.5 in August 2009). There are two ways to read very low savings rates: either consumers are exceptionally confident and exuberantly spending their money or consumers are spending every last dollar they have in an attempt to keep their heads above water in a high-inflation environment. Either way, there isn’t any slack left in consumer wallets — it’s hard to imagine consumer spending growing from here.
Unfortunately, inflationary pressures in energy and food don’t know or care that American consumers are out of money — inflation in those sectors was caused by supply shocks, not artificially stimulated demand. It is also important to keep in mind that the rate of growth for the Producer Price Index has been outpacing the Consumer Price Index, so some producers may still be taking some hits from rising costs that have not yet been passed on to the consumer.
So even though total revolving credit outstanding is just at pre-pandemic levels, it is nonetheless accelerating, and if prices continue to rise, it is reasonable to expect that revolving credit outstanding will rise as well.
At first glance, one may look at retail sales (charted below) and conclude that they are growing, but keep in mind that the report is measured in nominal dollars unadjusted for inflation and represents increases in the prices of goods being sold — not so much the strength or resilience of consumers. Goods-producing companies will not be alone. Services and tech companies will also be under pressure in the coming months, and sell-offs could lead to layoffs.
As we see a growing number of signs pointing toward further demand destruction from U.S. consumers, and thus a further reversion of import container volumes back to levels closer to 2019, it is worth examining the trade lane that handles a majority of that volume: China to the U.S.
When looking at aggregated volumes from China to all U.S. ports, we are able to see that volumes have been declining from the “peak of peak season” in September 2021 through Tuesday (currently down 51% from that peak). While late March through the beginning of May is historically (pre-trade war/pre-pandemic) a softer period for volumes on this trade lane, it is important to realize that this decline in volumes has also been amplified by the COVID restrictions and lockdowns implemented by the Chinese government in Shanghai as well as other important manufacturing regions in China (most notably around Beijing and its major nearby port of Tianjin).
Despite the lockdowns, a decline in volumes on this major trade lane was seemingly inevitable in 2022 as the massive volumes moved between these two countries in 2021 were at unprecedented and unsustainable levels. Now some industry observers are calling for a “container surge” as China reopens, but it seems that the demand destruction has already spilled over into this trade lane in a big way.
The ‘container surge’ that never was
The “container surge” that many have been expecting from Shanghai (thought to be building during the lockdowns) appears to have mostly already been rerouted through the Port of Ningbo (yellow). With access to the Port of Shanghai being largely blocked due to landside restrictions (i.e., road closures), shippers were quick to reroute volumes through the closest alternate major port to the Port of Shanghai (red). Since the lockdowns began in Shanghai in late March, the decline in Shanghai new bookings (and thus load volumes) has been more than offset by a surge of volumes through Ningbo from rerouted containers. This led to booking lead times hitting their lowest levels on record as shippers scrambled to get their volumes moving.
Despite the reopening of Shanghai, total container volumes from China to the U.S. have continued their downward trajectory, and that trend is not likely to be reversed by an easing of COVID restrictions alone. As of the latest data points, if this is the “container surge” from Shanghai to U.S. ports upon its reopening last Wednesday, then right now, it is barely a “blip on the radar” compared to the volumes from Shanghai to the U.S. that what we have seen over the last 18 to 22 months. This could easily change within our bookings data for the weeks ahead, and if there is pent-up demand, it will undoubtedly show up in the bookings data, but as of Tuesday, it has not yet materialized in any significant way.
This steady decline in volumes from China to the U.S. has also put significant downward pressure on spot rates from the demand side. As capacity remained relatively consistent in the first few weeks post-lockdown (March 28 onward), the drop in volumes caused a decline in both the Freightos Baltic Daily Index and the Drewry World Container Index spot rates from China/East Asia to the U.S. West Coast (down 41% per FEU month-over-month [m/m] – $9,630), as well as from China/East Asia to the U.S. East Coast (down 36% per FEU m/m – $11,907). While this has been a welcome downturn in spot rates for shippers that battled the record-setting spot rates of 2021, we should also keep in mind that these spot rates remain elevated on a y/y basis (73% to the West Coast and 59% to the East Coast).
If bookings continue to soften through June, we expect to see spot rates on this trade lane decline further, but ocean carriers may go to greater lengths than ever before to try and protect their record-setting earnings. They have already been cutting capacity on major trade routes through measures such as blank sailings and reassigning vessels to other services, but if the decline in volumes accelerates in the weeks ahead, we may see the alliances test their strength and discipline like never before.
If rates start dropping quickly, it is reasonable to suspect that the ocean carriers that have not locked in a majority of their allocations in longer-term contracts may begin aggressively undercutting one another as they compete in the spot market.
Interestingly enough, the last port labor negotiations at LAX/LGB that caused disruptions to supply chains (and thus led to a buildup of inventory in the U.S.) in 2014-15 created a similar situation. Coming off of a record year, that may sound like an unlikely scenario, but there is a distinct possibility that sharply softening spot rates could cause a shakeup and/or reorganization of the current alliances.
https://www.zerohedge.com/markets/us-import-demand-dropping-cliff
June 6, 2022
Inventories
Massive US retail inventory pile-up a big warning for chems
Joseph Chang
18-May-2022Full storyRelated newsRelated contentContact us SHARE THIS
NEW YORK (ICIS)–A massive pile-up in inventories at key US big-box retailers may be a warning sign for chemicals demand, which has partly been propped up by the overbooking of orders.
- Walmart and Target disappointing Q1 results show huge inventory builds
- Retailers to start unwinding stocks through next couple quarters
- Retail destocking to trickle down to chemicals demand
The Q1 downside earnings shocker at No 1 US retailer Walmart on 17 May was followed up by much of the same at Target on 18 May. The main culprit? A huge inventory build-up, as the companies misjudged consumer demand for certain products. Inflation was also a factor in the higher inventory numbers.
Logistics tangles didn’t help either, as some products arrived too early and others too late.
Walmart’s Q1 inventories rose 8.3% from Q4 2021 and a stunning 32.0% year on year to $61.2bn. Target’s Q1 inventories were up 8.5% quarter on quarter and 43.1% year on year.
The magnitude of the retail earnings misses and huge inventory builds were a key factor in the collapse of the US stock market on 18 May. Chemical equities were also hit hard but suffered less than the overall market.
For Walmart, inventories ballooned to 43% of total Q1 sales versus 34% in the year-ago period. Walmart saw US consumer spending shifting away from discretionary items such as apparel, patio furniture and landscaping supplies and more towards food and consumables.
“Most of the increased inventory and related costs were related to buying over the past several quarters with a keen focus on in-stock, and now we’re in a short period of rightsizing it,” said Walmart chief financial officer Brett Biggs on the company’s Q1 earnings conference call.
INVENTORY UNWIND ON ITS WAY
The period of “aggressive inventory buys” through the past several quarters is now over, and a big inventory unwind is on its way.
Target’s inventories stood at 61% of Q1 sales versus 44% from a year ago. It underestimated the magnitude of the consumer shift away from certain goods and towards services, leading to burgeoning inventories in “bulky categories” such as kitchen appliances, TVs and outdoor furniture.
These bulkier items tend to have a high chemicals component. Home and kitchen appliances use plastics such as polypropylene (PP), polystyrene (PS) and acrylonitrile butadiene styrene (ABS), which have largely replaced metals, ceramics and glass for electrical appliances such as food blenders, according to website Kitchen Buds.
TVs likewise use ABS and high impact PS (HIPS), along with polycarbonate (PC) and polymethyl methacrylate (PMMA). Outdoor furniture such as tables, chairs, benches and table lamps contain a good amount of high density polyethylene (HDPE) as well as PMMA.
Target sees consumer spending instead shifting to categories such as food and beverage, beauty and personal care, and household essentials.
“Our team is focused on doing everything necessary to ensure we enter the fall season with an appropriate level of inventory by category,” said Michael Fiddelke, chief financial officer of Target.
It will likely take several quarters for the big inventory builds to normalise (Walmart also estimates a couple of quarters), and impairments are also probable, especially for seasonal items.
GOODS INFLATION MAY EASE
On the bright side, bloated inventories will likely lead to price markdowns as retailers look to move excess stock. Walmart estimates it took a $100m hit to gross profit in Q1 from higher-than-normal markdowns. Management would not quantify potential gross margin impact in the coming quarters. Target likewise marked down items to move inventory in Q1.
CONSUMER SPENDING STILL HEALTHY
On a macro level, US retail sales overall rose 0.9% in April from March and was up 8.2% year on year – not surprising given the level of inflation.
“A good leading indicator is combined sales for furniture and furnishings (0.7% gain month on month), and electronics and appliances (1.0% gain month on month), and it was a good showing here. Consumers are still in the game,” said ICIS senior economist Kevin Swift.
“However, the inventory figures for those companies (Walmart, Target) are worrisome, and could result in destocking,” he added.
The US consumer is clearly still spending, and the year-on-year gains in overall sales for both Walmart and Target bear that out. But what is just as clear is that retailers severely overestimated the magnitude of consumer demand for goods – the so-called bulkier goods in particular.
It’s shocking to see some of the largest US big box retailers caught so flat-footed on inventory management when you’d expect this to be a core capability.
Perhaps it would be slightly less shocking if one paid more attention to ecommerce retailer Amazon’s Q1 earnings results on 28 April where it saw inventories rise 7% from Q4, and 47% year on year to $35.0bn.
Shares of Walmart fell 11.4% when it announced earnings on 17 May, and declined a further 6.8% on 18 May. Target’s stock plunged almost 25% on its earnings announcement on 18 May, underscoring the market’s surprise.
CHEMICALS TO FEEL DESTOCKING IMPACT
US chemicals companies mostly reported solid Q1 earnings, with essentially no signs of demand destruction even in the face of continuing price hikes.
This could be due to customers overbooking orders and continuing to build inventory given the dismal state of the supply chain.
Panellists at the 12th ICIS World Surfactants Conference on 10 May indicated that the trend of buyers overbooking to ensure sufficient supply is unlikely to end anytime soon as logistics constraints persist.
However, the burgeoning inventories at big box retailers may be the canary in the coal mine. As retailers wind down inventories in the quarters ahead, this impact should start to be felt down the supply chain, all the way down to chemicals and plastics.
Insight article by Joseph Chang
June 6, 2022
Inventories
Massive US retail inventory pile-up a big warning for chems
Joseph Chang
18-May-2022Full storyRelated newsRelated contentContact us SHARE THIS
NEW YORK (ICIS)–A massive pile-up in inventories at key US big-box retailers may be a warning sign for chemicals demand, which has partly been propped up by the overbooking of orders.
- Walmart and Target disappointing Q1 results show huge inventory builds
- Retailers to start unwinding stocks through next couple quarters
- Retail destocking to trickle down to chemicals demand
The Q1 downside earnings shocker at No 1 US retailer Walmart on 17 May was followed up by much of the same at Target on 18 May. The main culprit? A huge inventory build-up, as the companies misjudged consumer demand for certain products. Inflation was also a factor in the higher inventory numbers.
Logistics tangles didn’t help either, as some products arrived too early and others too late.
Walmart’s Q1 inventories rose 8.3% from Q4 2021 and a stunning 32.0% year on year to $61.2bn. Target’s Q1 inventories were up 8.5% quarter on quarter and 43.1% year on year.
The magnitude of the retail earnings misses and huge inventory builds were a key factor in the collapse of the US stock market on 18 May. Chemical equities were also hit hard but suffered less than the overall market.
For Walmart, inventories ballooned to 43% of total Q1 sales versus 34% in the year-ago period. Walmart saw US consumer spending shifting away from discretionary items such as apparel, patio furniture and landscaping supplies and more towards food and consumables.
“Most of the increased inventory and related costs were related to buying over the past several quarters with a keen focus on in-stock, and now we’re in a short period of rightsizing it,” said Walmart chief financial officer Brett Biggs on the company’s Q1 earnings conference call.
INVENTORY UNWIND ON ITS WAY
The period of “aggressive inventory buys” through the past several quarters is now over, and a big inventory unwind is on its way.
Target’s inventories stood at 61% of Q1 sales versus 44% from a year ago. It underestimated the magnitude of the consumer shift away from certain goods and towards services, leading to burgeoning inventories in “bulky categories” such as kitchen appliances, TVs and outdoor furniture.
These bulkier items tend to have a high chemicals component. Home and kitchen appliances use plastics such as polypropylene (PP), polystyrene (PS) and acrylonitrile butadiene styrene (ABS), which have largely replaced metals, ceramics and glass for electrical appliances such as food blenders, according to website Kitchen Buds.
TVs likewise use ABS and high impact PS (HIPS), along with polycarbonate (PC) and polymethyl methacrylate (PMMA). Outdoor furniture such as tables, chairs, benches and table lamps contain a good amount of high density polyethylene (HDPE) as well as PMMA.
Target sees consumer spending instead shifting to categories such as food and beverage, beauty and personal care, and household essentials.
“Our team is focused on doing everything necessary to ensure we enter the fall season with an appropriate level of inventory by category,” said Michael Fiddelke, chief financial officer of Target.
It will likely take several quarters for the big inventory builds to normalise (Walmart also estimates a couple of quarters), and impairments are also probable, especially for seasonal items.
GOODS INFLATION MAY EASE
On the bright side, bloated inventories will likely lead to price markdowns as retailers look to move excess stock. Walmart estimates it took a $100m hit to gross profit in Q1 from higher-than-normal markdowns. Management would not quantify potential gross margin impact in the coming quarters. Target likewise marked down items to move inventory in Q1.
CONSUMER SPENDING STILL HEALTHY
On a macro level, US retail sales overall rose 0.9% in April from March and was up 8.2% year on year – not surprising given the level of inflation.
“A good leading indicator is combined sales for furniture and furnishings (0.7% gain month on month), and electronics and appliances (1.0% gain month on month), and it was a good showing here. Consumers are still in the game,” said ICIS senior economist Kevin Swift.
“However, the inventory figures for those companies (Walmart, Target) are worrisome, and could result in destocking,” he added.
The US consumer is clearly still spending, and the year-on-year gains in overall sales for both Walmart and Target bear that out. But what is just as clear is that retailers severely overestimated the magnitude of consumer demand for goods – the so-called bulkier goods in particular.
It’s shocking to see some of the largest US big box retailers caught so flat-footed on inventory management when you’d expect this to be a core capability.
Perhaps it would be slightly less shocking if one paid more attention to ecommerce retailer Amazon’s Q1 earnings results on 28 April where it saw inventories rise 7% from Q4, and 47% year on year to $35.0bn.
Shares of Walmart fell 11.4% when it announced earnings on 17 May, and declined a further 6.8% on 18 May. Target’s stock plunged almost 25% on its earnings announcement on 18 May, underscoring the market’s surprise.
CHEMICALS TO FEEL DESTOCKING IMPACT
US chemicals companies mostly reported solid Q1 earnings, with essentially no signs of demand destruction even in the face of continuing price hikes.
This could be due to customers overbooking orders and continuing to build inventory given the dismal state of the supply chain.
Panellists at the 12th ICIS World Surfactants Conference on 10 May indicated that the trend of buyers overbooking to ensure sufficient supply is unlikely to end anytime soon as logistics constraints persist.
However, the burgeoning inventories at big box retailers may be the canary in the coal mine. As retailers wind down inventories in the quarters ahead, this impact should start to be felt down the supply chain, all the way down to chemicals and plastics.
Insight article by Joseph Chang
June 6, 2022
Congestion Eases
Ports get ‘much needed respite’ as container-ship traffic jam eases
Ship queues down off Southern California, Virginia and Charleston
Greg Miller Follow on Twitter Wednesday, June 1, 2022 3 minutes read

Listen to this article 0:00 / 4:11 BeyondWords
It could be the relative calm before the peak-season, post-Shanghai-lockdown storm. Or it could be the final unwinding of COVID-era congestion as inflation takes hold. What happens next is still highly uncertain. But as of now, U.S. port queue numbers remain down from highs.
“This appears to be a much needed respite for some ports that have seen significant delays over the course of the year to date,” said S&P Global Commodity Insights.
“Congestion is easing in [some] areas,” said Flexport. It advised importers to “take advantage of currently available space.”
There were only 25 container ships waiting to berth in the ports of Los Angeles and Long Beach on Friday, according to data from the Marine Exchange of Southern California. That’s the lowest tally since July 28, 2021. As of Wednesday, there were 28 ships waiting. Current numbers are far below the all-time high of 109 ships waiting on Jan. 9.

The reduction in the Los Angeles/Long Beach ship queue is partially due to cargo being redirected to East Coast ports. Yet even East Coast ports are down from peaks.
In late February, ship-position data from MarineTraffic showed 70 container ships waiting offshore of East and Gulf Coast ports. By mid-May, the count had fallen to 45.
As of Wednesday, it had climbed back up to 58. Traffic jams off Virginia and Charleston, South Carolina, are down. The biggest queues now are off New York/New Jersey — 17 container ships — and Savannah, Georgia, where 25 vessels are waiting. Savannah’s numbers are the main driver of the recent East Coast uptick in recent days; Hapag-Lloyd reported only seven ships at anchor there on Friday.

A temporary reprieve?
Inbound arrivals could soon increase, according to Sea-Intelligence. If so, port congestion improvements are temporary.
Sea-Intelligence said that offered trans-Pacific capacity jumped 21% from 535,200 twenty-foot equivalent units for departures in the week of May 15-21 to 646,500 TEUs this week.
Ships departing overseas ports this week will arrive by the end of June. Last year, the queue numbers in Los Angeles/Long Beach fell through the third week of June, then reversed, heading back up thereafter.
Asia-West Coast freight rates appear to have stabilized at high levels, at least temporarily, after significant recent declines. The Drewry Shanghai-Los Angeles assessment was at $8,720 per forty-foot equivalent unit last week. The Freightos Baltic Daily Index (FBX) assessment for that route (which includes premiums) was at $10,762 per FEU as of Tuesday.

Freight futures traded against the FBX show expectations for rebounding rates.
Peter Stallion of brokerage Freight Investor Services wrote in a market update on Wednesday: “Trans-Pacific westbound has seen a severe erosion of freight rates. [But] forward market sentiment, rather than carrying down any further significant price decreases, has flattened out the curve.”
The calendar-year 2023 futures contract for Asia-West Coast is now trading above the current price, at $11,500 per FEU. That contract price “held steady through the month [of May],” said Stallion.
“This is a drastic change since the start of the year, and indeed through most of 2021,” when current prices were at a premium to forward contract prices.
 Everchem Updates Archive
  Sign Up for Email Updates