
The Urethane Blog
September 21, 2026
Asia-US container rates soar past $11,000, near pandemic records
Carriers add East Coast capacity
· Friday, September 18, 2026
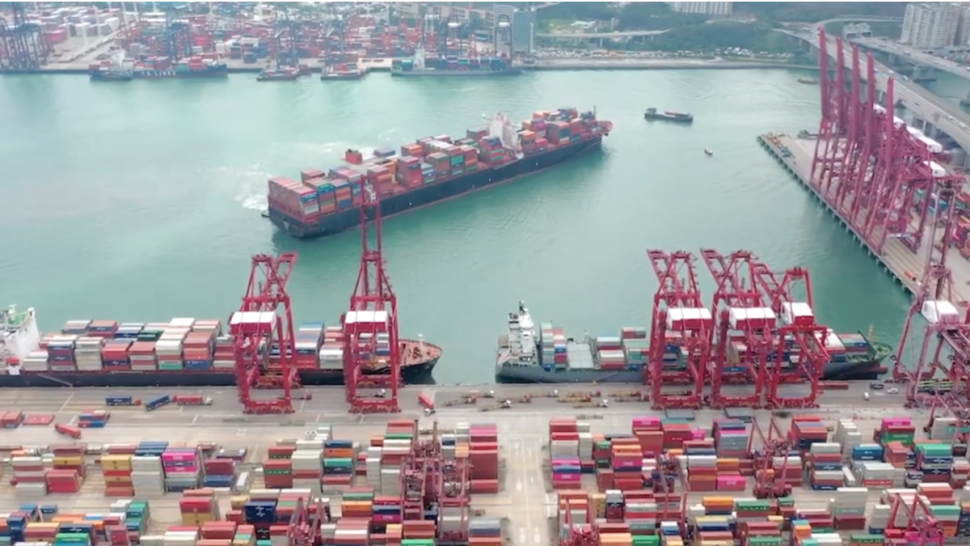
Ocean carriers are capitalizing on an extraordinary spike in container freight rates from Asia to the United States, with spot prices now within roughly 18% of their pandemic-era highs on the West Coast and 11% on the East Coast, according to Xeneta data.
Rates from the Far East to the U.S. West Coast reached $7,960 per forty foot equivalent unit as of Sept. 17, while Far East-U.S. East Coast prices climbed to $11,259 per FEU. Both trades have more than quadrupled since late February, before the Hormuz crisis disrupted global shipping markets.
East Coast trade closest to record
The Far East-U.S. East Coast trade appears the likelier candidate to set a new all-time rate record, Xeneta Chief Analyst Peter Sand said.
The current East Coast spot rate is just 11.2% below its record of $12,683 per FEU, established Jan. 1, 2022, amid the supply-chain disruption of the Covid-19 era. The Far East-U.S. West Coast rate remains 17.9% below its $9,699-per-FEU peak, set Feb. 1, 2022.
“Spot rates from Far East to U.S. West Coast and U.S. East Coast are up 324% and 325% respectively since pre-Hormuz crisis at the end of February,” Sand said. “That leaves freight rates on these critical trades just 18% and 11% short of the all-time high set during the Covid-19 disruption.”
Rising bunker costs could further increase carrier fuel surcharges and push rates higher, he said, making a breach of pandemic records possible.
“If a freight rate record is broken, it is most likely to occur on the trade into U.S. East Coast,” Sand said. “But even if we do not see a new all-time high, the fact we are even discussing the possibility demonstrates how sensitive critical ocean container shipping trades are to geopolitical forces and how a regional conflict in the Middle East can have major implications at a global level.”
Capacity increases ahead of potential turn
Carriers are adding space from the Far East to the U.S. East Coast as demand and pricing remain strong, according to Xeneta. Offered capacity on that route in September is 6% to 7% above August levels.
Sand said carriers are moving to take advantage of the current pricing environment before market conditions potentially begin to change within the next two to three weeks.
“Carriers are seizing the opportunity while the market is hot,” he said. “Adding capacity into U.S. East Coast ahead of what could be a turn in the market” may help carriers capture elevated revenue while rates remain near historical highs.
That capacity response could eventually restrain the rapid escalation in spot pricing, particularly after the seasonal rush connected with China’s Golden Week holiday period.
Another rate push expected before Golden Week
Xeneta expects a further attempt by carriers to lift spot rates in early October as shippers accelerate exports from Asia before factory shutdowns and reduced production during Golden Week.
“We should expect one more freight rate push at the start of October as shippers rush cargo out of Asia ahead of the Golden Week shutdown,” Sand said. “Before rates start to soften, or at least the pace of growth will slow.”
The expected post-Golden Week slowdown would not necessarily mean rates fall immediately. Rather, it could mark an end to the sharp upward trajectory that has characterized the market since late February.
Europe trades also rise sharply
The disruption has extended beyond US import trades, although the magnitude of increases has varied considerably by route.
| Trade lane | Sept. 17 spot rate | Change since Feb. 28 |
| Far East-US West Coast | $7,960 per FEU | 323.6% |
| Far East-US East Coast | $11,259 per FEU | 324.7% |
| Far East-North Europe | $4,103 per FEU | 84.9% |
| Far East-Mediterranean | $4,434 per FEU | 33.2% |
| North Europe-US East Coast | $2,956 per FEU | 100.1% |
(Chart: Xeneta)
The Far East-North Europe trade rose nearly 85% from pre-crisis levels to $4,103 per FEU, while the Far East-Mediterranean route increased 33.2% to $4,434 per FEU. North Europe-U.S. East Coast spot rates more than doubled, reaching $2,956 per FEU.
The gap between U.S. and European price escalation shows that price pressure is concentrated on Asia-U.S. container trades, particularly services moving through or affected by the Middle East disruption and the changing economics of vessel deployment, fuel costs and available capacity.
September 17, 2026
€300/ton! Wanhua’s Hungarian plant initiates price hikes for European MDI and TDI
2026-09-17 14:26:17Source:ChemNet中文

On September 16, Wanhua Chemical’s overseas subsidiary Hungary’s BorsodChem officially released a price adjustment notice. Affected by the recent fluctuations in raw material prices and the continuous rise in energy costs in the European region, the company decided to unifyly increase the prices of all MDI, TDI and polyol products in the European market, with an increase of 300 euros per ton.
This price adjustment will take effect immediately. New orders will directly implement the new price, and existing orders will be fulfilled in accordance with the original contract terms. BorsodChem stated that this price adjustment aims to hedge against the continuously rising comprehensive production costs. The company will continue to ensure stable supply of goods in the European region, maintain high-standard customer service capabilities, and fully guarantee the normal production and operation of downstream manufacturing industries.
As the core polyurethane raw material production base in Europe, BorsodChem’s full-range price adjustment this time marks the official launch of a new round of price increases for polyurethane raw materials in Europe, which will directly transmit costs to local downstream industrial chains such as insulation, furniture, automobiles and building materials.
Overseas giants frequently adjust prices, and the global market is facing linked price hikes
Since September, the global polyurethane industry chain has entered a concentrated price increase cycle. International chemical leaders such as BASF, Huntsman and Wanhua have successively released price adjustment announcements, covering mainstream markets such as Europe, Southeast Asia, South Asia, the Middle East and other regions.
In early September, BASF took the lead in increasing the prices of MDI and TDI in Southeast Asia and South Asia markets by 250 US dollars per ton, and the price adjustment took effect immediately, which was mainly supported by raw material costs, logistics fees and tight regional supply and demand. On September 14, Wanhua Chemical followed up to adjust the sales prices in Southeast Asia and South Asia, raising the prices of MDI and TDI by 300 US dollars per ton, and polyether polyol by 400 US dollars per ton.
Meanwhile, Huntsman announced that starting from October 1, it will increase the prices of all MDI products in Europe, the Middle East, Africa and India by 285 euros per ton, further consolidating the upward trend of overseas market prices. Multiple enterprises have simultaneously released signals to support prices, and the overall global polyurethane raw material prices have entered an upward channel.
Domestic market also rises simultaneously, and raw material prices continue to stabilize and rise
Driven by overseas price hikes, combined with domestic plant maintenance and supply contraction, the domestic MDI, TDI and polyol markets have simultaneously warmed up, and prices have continued to rise.
Data shows that the spot price of domestic polymeric MDI has continued to rise since September. As of September 16, the mainstream market quotation has increased by more than 8% compared with the beginning of the month. The domestic TDI market remains high and firm, and local goods quotations have steadily climbed. Affected by the maintenance of major units such as Wanhua Yantai, the effective market supply has shrunk, the industry inventory is at a low level, and manufacturers have a strong willingness to support prices. In addition, foreign-funded enterprises such as Covestro have also raised the domestic TDI guidance prices simultaneously, further boosting the domestic market trend.
Polyol products have also followed the upward trend of the industrial chain. Driven by upstream raw material price increases and downstream rigid demand restocking, the domestic polyether polyol market has strengthened steadily, transaction prices have steadily increased, and market trading atmosphere has continued to improve.
Clear price increase logic, future market trend continues to improve
The collective price increase of polyurethane raw materials at home and abroad this round is driven by multiple favorable factors. On the one hand, the prices of international crude oil and basic chemical raw materials have fluctuated upward, and the bottom of the industrial chain costs has risen; on the other hand, European energy prices are running at a high level, the operation of multiple overseas units has been restricted, and the overall global supply is tight. At the same time, the traditional downstream peak season is coming, the terminal procurement demand has been steadily released, and the supply and demand pattern has continued to optimize.
Industry analysts said that the simultaneous price adjustments of global chemical leaders have significant regional linkage effects, and overseas price hikes will continue to be transmitted to the domestic market. In the short term, the prices of MDI, TDI and polyol raw materials will remain relatively strong, and the subsequent market trend will continue to dynamically adjust following the trend of crude oil, plant operating rate and changes in downstream terminal demand.
September 16, 2026
Dow Inc. (DOW) Presents at Morgan Stanley’s 14th Annual Laguna Conference Transcript
Sep 16, 2026, 3:51 PM ETDow Inc. (DOW) Stock
Dow Inc. (DOW) Morgan Stanley’s 14th Annual Laguna Conference September 16, 2026 1:00 PM EDT
Company Participants
Jeffrey Tate – Chief Financial Officer
Jeffrey Tate
Chief Financial Officer
Great. Thank you, [ Mark. ] And good morning, everyone, and thank you for having me today. Before we get into your questions, I’d like to begin with just a few remarks to paint a picture of how the third quarter has evolved. I’ll share Dow’s views on the external factors and market conditions that have the greatest impact on our business as well as an overview of our self-help actions, continued financial discipline and our near-term priorities.
Now I’ll start on Slide 2, with the current environment. The macro backdrop remains dynamic and largely unchanged from what we outlined in July at our earnings. Specific to Dow, our strategically advantaged global footprint and local supply chains in every region continue to be differentiators for us. The oil-to-gas spread remains elevated as geopolitical tensions in the Middle East continue, supported by recent material escalation of crude pricing, while gas remains largely unaffected. This reinforces the competitive advantage of Dow’s purpose-built asset base and feedstock position that we’ve developed over decades. And while the tariff landscape has become more complex, Dow’s direct exposure remains minimal.
That said, continued volatility and uncertainty in the early part of the third quarter have created some headwinds that we’re working to offset.
Several market developments are working in our favor, which we expect to at least partially offset some of the impacts, but we’ve got more work to do. More specifically, July polyethylene prices in the Americas settled down $0.10 per pound. This reflected declining feedstock prices and margins in the early part of the month when initial expectations for a durable solution to the Middle East conflict began to surface.
In August, however, widespread reporting indicated those expectations were not realistic in the immediate term. In the month, we saw some improvement in the global operating environment along with higher oil prices. This ultimately led to polyethylene prices selling flat month-over-month.
So far in September, we are seeing a strengthening order book, including in Asia. Along with the recent sharp escalation in global feedstock costs, this supports our announced global price increases globally, including $0.10 to $0.12 per pound for polyethylene in the Americas. With a rapidly rising cost environment, we are implementing these price increases with urgency.
So looking at some of the key markets that Dow serves across our portfolio, consumers remain selective with spending trends favoring essential items. Additionally, the building and construction and automotive markets continue to face challenges amid a cautious monetary policy environment. Shipping through the Strait of Hormuz and other regional water was also remains constrained, tightening global supply further. And low water levels in Europe, including the Rhine, are constraining competitor supply across several products, which is leading to higher market prices across our Industrial Intermediates & Infrastructure segment.
So to summarize, the geopolitical and macro backdrops remain volatile and demand signals are mixed. While polyethylene price declines early in the quarter represent a headwind, Dow continues to lead with deliberate actions, and we remain focused on controlling what we can control. Our self-help actions and the breadth of our portfolio are helping to partially offset this impact, and we now expect to deliver EBITDA of $1.5 billion to $1.6 billion for the third quarter. This represents our best estimate based on what we see today, recognizing that a continued volatile environment this month could ultimately influence the outcome.
Next, I’ll share some examples on Slide 3 that outline the ways in which we are taking decisive actions to improve our financial strength. First and foremost, we continue to enhance Dow’s balance sheet and near-term financial performance. To start, our major planned maintenance for the year is now complete at several of our largest assets, which should provide a tailwind in the fourth quarter. In addition, we received the remaining tax withholding related to the NOVA litigation settlement earlier this quarter. We are also actively prioritizing deleveraging with excess cash, and we expect to release more than $500 million of net working capital in the second half of this year.
Looking longer term, we have no substantive debt maturities until 2029. And importantly, we continue to deliver our self-help actions, including our recently upsized in-year target for Transform to Outperform. With this, we now expect to deliver $1.3 billion in total benefits from self-help in 2026.
Our intentional actions continue to strengthen Dow’s credit profile as improved earnings, balanced capital allocation and self-help actions drive higher cash generation and lower leverage. This was evident by a recent rating agency outlook upgrade.
Next on Slide 4. I’ll unpack some additional details on how Transform to Outperform is delivering value as a significant contributor to our self-help improvements. We expect Transform to Outperform will deliver an upsized benefit of approximately $700 million this year, clearly demonstrating the early value we are capturing. Importantly, we remain confident in the more than $2 billion total opportunity that our transformation will deliver, and we’re seeing significant early results from every work stream. A broad range of actions will contribute to the benefits we expect in the second half of this year. And let me highlight just a few examples.
We already implemented approximately 70%, 7-0, of the total Dow role reductions, and we expect to implement nearly all of them before the end of this year. This is expected to contribute more than $200 million of EBITDA uplift in the second half.
Unknown Analyst
Interesting. Let’s shift gears maybe over to Industrial Intermediates & Infrastructure. You touched on some of the softness we’re seeing in some of these markets, housing, obviously, being one of them. But you’re expecting a normal seasonal decline in building and construction in Q3 with some margin pressures in Europe. We’ve all been waiting for this recovery now in the housing market for some time, and yet housing starts and existing home sales are still well below historic averages. What are you seeing thus far this quarter in building and construction? And how are you managing the business through the current higher-for-longer rate environment?
Jeffrey Tate
Chief Financial Officer
Sure. I mean when you look at building and construction for us and specifically in the II&I segment, there are a couple of dynamics that I think are worth mentioning. One, yes, building and construction is a significant portion of the portfolio, but it’s a mixed bag from a demand perspective because data centers also do provide some level of a tailwind within that segment for us. The other thing that I would also mention, [ Mark, ] is we have our Dow Industrial Solutions business as well, that is an II&I segment. That’s the alkoxylation investments that we’ve made over the past couple of years. So again, you think about home care, personal care, pharma, electronics as well, those are areas that are growing higher margin, faster than GDP, which will continue to provide that tailwind for us as we think about year-over-year growth.
Unknown Analyst
Interesting. All right. Maybe just keeping on II&I, you flagged that normalization of peer MDI and PO capacity, which had been disrupted in Q2, is expected to be a headwind in Q3. Market commentary had indicated that the upstream carbon monoxide issue had flared up in early July before fading again. Can you help us size that perhaps? And how quickly have peers restarted, if they have even? And what’s the EBITDA headwind from MDI and PO margin compression that’s embedded in the Q3 guide?
Jeffrey Tate
Chief Financial Officer
Well, the interesting thing is that because of the industrial gas supply issue that I think you’re referring to, the industry supply is still tight. So we’re actually seeing some pricing momentum in this period of tighter supply, which we’re being able to really execute on as we ramp up our operating rates on the U.S. Gulf Coast related to MDI. So that’s one of the areas where if you looked at the beginning of the quarter versus where we are now, it’s giving us a slight tailwind to close out third quarter, which is positive for us.
September 13, 2026
Chinese imports fall sharply in first half of 2026 U.S. imports from China are down 23% in H1 2026, but the country still dominates critical consumer and industrial categories 5-MINUTE READ
What you’ll learn in this article:
How America’s trade with China has evolved since the start of President Trump’s second term. Which industries have weathered the tariff wars, and which have not. What to expect from Xi Jinping’s upcoming meetings in Washington DC.
🎯 Best for: Business planners and strategists, supply chain managers, VPs of Procurement. As U.S. President Donald Trump prepares to host Chinese President Xi Jinping on September 24, America’s efforts to reduce its trade dependency on China are reshaping supply chains, but the results vary dramatically by industry, according to U.S. Census Bureau data analyzed by ImportGenius.
The data shows that total U.S. imports from China are down 23% in the first 6 months of 2026 compared to the same period last year. China continues to dominate the market for products such as children’s goods and some crucial industrial inputs. But China’s dominance in other areas — particularly the lucrative computer industry — is experiencing significant decline. “China still has a chokehold on the supply of certain goods, but in other areas it has now lost substantial ground,” says ImportGenius CEO Michael Kanko. “The data shows that some global supply chains are being reorganized right before our eyes.” On the decline: computers, electronics, aluminum goods During the six-month period from January to June 2026, China’s role as a source of computers, computer accessories, and electronic equipment for the United States has continued to erode. The table below shows some of the largest declines for the most significant import categories by value. 
Source: ImportGenius In addition to electronics, the table shows that American businesses and consumers are also finding new sources for such products as aluminum wheels, gas-powered appliances, and lithium-ion batteries. Countries such as Mexico and Vietnam have stepped in to make up the shortfalls.
“In essence, for computers and everything that connects to them, China now accounts for less than 50% of total U.S. imports,” says Kanko. “It’s a remarkable shift that’s taken place in only about two years.”Still made in China: Kid stuff, microwave ovens, herbicide Meanwhile, China still dominates some other import markets, most notably for anything to do with children’s transportation — from strollers to car seats — as well as children’s books. It remains impossible to raise a family in America without Chinese goods.
As the table below shows, China also provides more than 90% of America’s total imports for multiple other high-value categories, from fireworks to artificial plants to microwave ovens. And its dominance in some industrial inputs, such as glyphosate and glufosinate, has raised national security alarms. 
Source: ImportGenius Glyphosate and glufosinate are broad-spectrum herbicides. Glyphosate, the active ingredient in Roundup, is manufactured in the United States by Bayer. The company recently petitioned for antidumping and countervailing duties against Chinese glyphosate, prompting the U.S. International Trade Commission to launch an investigation. Global trade is changing in real time This latest data on U.S.-China trade underlines two of the themes in ImportGenius’ Global Trade Outlook report from earlier this year. First, America’s trade diversification is real, but still evolving — and creating opportunities as supply chains adjust. Second, trade data has become a leading indicator for signaling competitive shifts and policy impacts.
That next policy shift could come soon, because America’s shrinking dependency on Chinese goods has yet to apply much pressure on China. The country has replaced its shrinking American imports with sales to countries in Latin America, Africa and beyond, insulating its economy from any shock. At the G20 meeting earlier this month, the United States and 18 other countries criticized “non-market based economies pushing out a never-ending stream of cheap exports.”
“The trade data shows how policies set in Washington reverberate on the other side of the globe,” says Kanko. “And if Xi’s visit to Washington this month results in new policy shifts and decisions, their impact will show up first in the data.”
https://mail.google.com/mail/u/0/?shva=1#inbox/FMfcgzQhWLSTJNSppLStkWRdKvNGlhXq
September 10, 2026
EU governments seek import curbs to protect chemicals industry
Sep 10, 2026, 9:16 AM ETFirst Trust STOXX European Select Dividend Idx Fd ETF (FDD), OPPE, VIS, XLI, FIDU, IYJ, BASFY Stock, BFFAF Stock, LNXSF Stock, LNXSY Stock, WKCMF Stock, WKRCF StockBy: Rob Williams, SA News Editor
European governments are preparing to seek broad restrictions on imports of certain chemicals and plastics as low-priced shipments, particularly from China, put additional pressure on the region’s struggling manufacturers, Reuters reported Thursday, citing people familiar with the matter.
France, Italy and potentially Germany plan to request European Union investigations into products including polyethylene terephthalate, or PET, epoxy resin and glass fibers, according to people familiar with the discussions.
PET is a polymer commonly used to make beverage bottles, food containers and other packaging. Epoxy resins are used in coatings, adhesives, electronics and composite materials, while glass fibers reinforce products used in construction, vehicles, wind turbines and military equipment.
The proposals have not been formally submitted and no restrictions have been approved.
For investors, safeguards could support pricing and factory utilization at European chemical producers such as BASF (BASFY)(BFFAF), Lanxess (LNXSF)(LNXSY) and Wacker Chemie (WKCMF)(WKRCF) by limiting the impact of cheaper imports. The protection would come with a tradeoff. Packaging companies, automakers, construction suppliers and other customers could face higher material costs if quotas tighten supply or allow domestic producers to raise prices. Any benefit also may take months to appear because the European Commission must investigate whether imports have increased enough to cause serious harm before recommending action.
The proposal reflects a broader change in European trade policy. Governments are becoming more willing to shelter strategic industries as U.S. tariffs restrict export opportunities and Chinese overcapacity redirects more goods toward Europe.
How safeguards work
Safeguards differ from the EU’s more common anti-dumping duties.
Anti-dumping measures generally target particular products from specific countries after investigators determine that they were sold below a fair price. Safeguards respond to a sharp increase in imports regardless of whether exporters broke trade rules.
Under a safeguard system, a certain volume of a product can enter the EU under normal tariff terms. Imports above that quota face an additional duty. Because the measure applies broadly, it can affect suppliers in countries that have free-trade agreements with the EU, not only China.
That wide reach is one reason Brussels has used safeguards sparingly. The bloc has more than 150 trade-defense measures in force, most involving targeted tariffs, but broad quota systems have been unusual outside sectors such as steel and ferro-alloys.
EU member states must initiate safeguard requests. Final measures would require support from at least 15 of the bloc’s 27 members representing 65% of its population.
Chemical producers face prolonged crisis
Europe’s chemical industry has been squeezed by high energy costs, weak demand and expanding Asian production. The sector relies heavily on natural gas and electricity, leaving European plants at a cost disadvantage against competitors in regions with cheaper energy.
BASF, Lanxess and Wacker Chemie are among the companies eliminating jobs or reducing production. European chemical investment also has fallen sharply as companies reconsider whether aging plants can compete with newer facilities in China, the Middle East and the United States.
China’s growing production capacity has compounded the problem. When domestic demand does not absorb that output, more material can be exported at prices that European producers struggle to match.
The European Chemical Industry Council reported that planned investment in European production capacity fell more than 80% in 2025. Plant closures announced since 2022 affected about 20,000 jobs and removed 17.2 million metric tons of capacity, according to the industry group. Financial Times
Approval is uncertain
France has expressed support in principle for investigating safeguards on selected chemicals and plastics. Italy is interested in products important to defense, automotive manufacturing, energy, shipbuilding and infrastructure.
Germany’s Economy Ministry also is open to considering restrictions, although it said it would evaluate any proposal based on the Commission’s findings. That stance is notable because Germany previously resisted some trade actions against China, an important market for German manufacturers.
Industry groups are approaching the proposal cautiously. Germany’s VCI said companies were preparing to assist governments with possible applications, but the association stopped short of endorsing sweeping restrictions across the chemicals sector.
That hesitation reflects divisions within the supply chain. Chemical producers may welcome protection from inexpensive imports, while companies that purchase those materials could find themselves paying more. Brussels therefore must decide whether safeguards would preserve European industry or simply send the bill to its customers.
 Everchem Updates Archive
 Sign Up for Email Updates