The Urethane Blog
Everchem Updates
VOLUME XXI

September 14, 2023
Everchem’s exclusive Closers Only Club is reserved for only the highest caliber brass-baller salesmen in the chemical industry. Watch the hype video and be introduced to the top of the league: — read more
January 17, 2023
High-frequency truckload data suggests the freight market is stabilizing
Craig Fuller, CEO at FreightWaves
· Monday, January 16, 2023

Listen to this article
0:00 / 2:30BeyondWords
Did the first quarter lull come early, in November and December of 2022?
For carriers, the first quarter is always the most difficult period in the annual freight calendar, when retailers clear their excess holiday inventory, construction takes a pause for the frigid weather and everything is gloomy and cold. The soft first quarter often follows a robust fourth quarter, in which freight companies enjoy the annual peak season and make an outsized portion of their profits. Carriers look forward to spring for some market stability and potential market accelerations.
Is it possible that winter came early this year? Did the freight winter start in November and now we are experiencing an early thaw?
Early freight data and channel checks would suggest the freight market could be stabilizing and clearer skies are ahead.
Over the past week, we’ve spoken with numerous freight executives who have mentioned that the first two weeks of the first quarter are shaping up better than expected, granted, expectations were incredibly low after such a weak peak.
Going into the quarter, executives we spoke with predicted a significant collapse in freight for the first quarter, with a seasoned veteran executive of a large trucking technology firm predicting that the first quarter would be the worst in his four-decade career. It was a fair bet considering how challenging the second half of the 2022 was for most in the freight market.
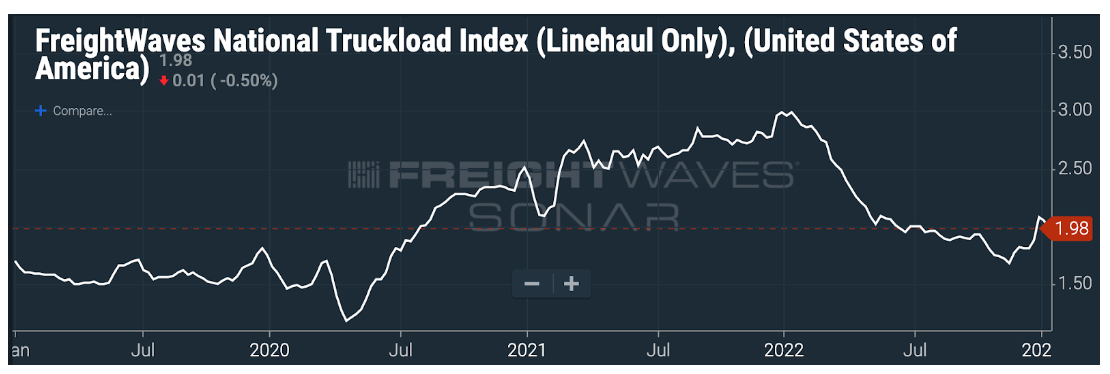
Truckload spot rates, according to the FreightWaves National Truckload Index, hit a low of $1.67 on Nov. 17, 2022, and have since bounced back to $1.98 per mile.
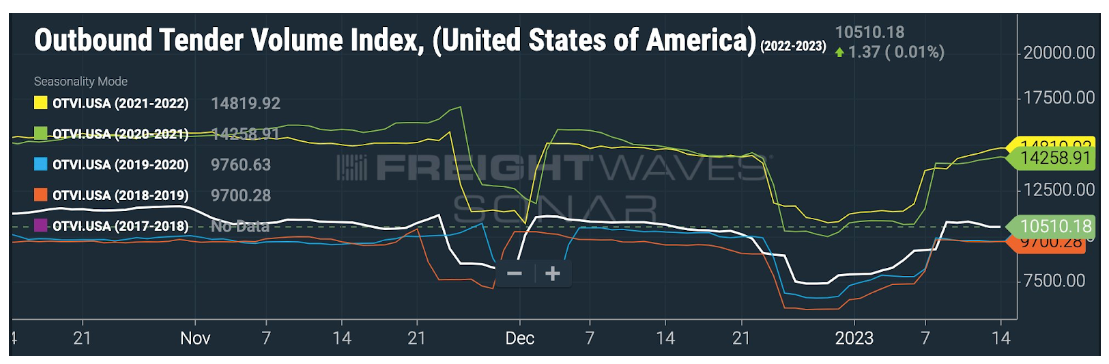
Trucking tender volumes also suggest that the direst of predictions have not played out. Tender volumes on the Outbound Tender Volume Index (OTVI), an index that tracks the volumes of load requests from shippers to carriers, show that volumes briefly dipped below 2019 and 2020 levels, but they have since broken away from this baseline.
If the first few weeks of the new year are an early omen, then the freight market may have bottomed in the fourth quarter and carriers can look forward to a far less volatile market in 2023.
Interested in being the first to know about the changes in the global freight market so that you can prepare your business for market changes before your competitors? All of the data in this article is available via subscription to SONAR, the world’s leading high-frequency data platform.
January 17, 2023
PRESS RELEASE: January 9, 2023 (Lawrenceville, Georgia)
SuperSkinSystems (a Division of American Polymers Corp.)
The owners of American Polymers Corp. would like to announce appointments of Dr. Mahesh
Kotnis as the new President of SuperSkinSystems (a division of American Polymers) and of Stuart
Smith as Vice President of SuperSkinSystems.
SuperSkinSystems is a strategic bolt-on acquisition for the American Polymers Corp adding new
technology platforms and increasing its geographic footprint in the United States. Leveraging our
manufacturing capabilities, R&D resources, and our expansive network of valued partners, we are
in a strong position to scale SuperSkinSystems well proven innovative products used in high
performance coatings, elastomers, and specialty foams.
Dr. Mahesh Kotnis

Prior to joining American Polymers as Executive Vice President, Dr. Kotnis
worked in various senior leadership roles in multinational companies
such as Huntsman, Ciba Specialty Chemicals, and ICI Americas over the
last 30 years. He has a proven track record of building profitable
businesses and high performing teams which have delivered consistent
above-market growth in diverse economic conditions. Dr. Kotnis holds a
Ph.D. from the University of Massachusetts at Amherst in Polymer
Science & Engineering.
“SuperSkinSystems business has grown multifold just in the first year of integration with American
Polymers. These results show the benefits of synergy from American Polymers and that
opportunities for growth are abundant. We are moving to a new site four times bigger than the old
site providing a strategic location in the South East United States for American Polymers and all
affiliate companies.” – Dr. Mahesh Kotnis
Stuart Smith
Stuart has been a scientist, innovator, and entrepreneur over the last 40
years in the polyurethanes industry. He cofounded SuperSkinSystems in 2010.
Stuart holds a B.S. in Plastics Technology from the University of
Massachusetts at Lowell and has been awarded more than 50 U.S. patents
in polyurethane, epoxy, polyurea materials.

January 16, 2023
Judge to rule on United Furniture’s bankruptcy
A federal judge will rule Wednesday on whether to approve the Chapter 11 bankruptcy protection motion of United Furniture Industries Inc.
Judge Selene Maddox conducted Friday a hearing on United’s Chapter 11 motion which would focus foremost on how the sale of its assets would be handled.
Maddox chose not to address the Chapter 7 liquidating motion filed Jan. 6 by Wells Fargo & Co., United’s largest creditor.
Maddox took Friday’s presentations “under advisement,” pending issuing a bench ruling at 4 p.m. Wednesday.
Maddox also chose to reset Wells Fargo’s motion for an interim bankruptcy trustee pending a ruling on the United motion.
The United motions are the company’s first formal legal response since it unexpectedly shut down on Nov. 22.
The shutdown immediately ended the employment and health insurance benefits of about 530 Triad workers and about 2,700 overall in three states.
Wells Fargo claims United’s motion “is an exercise in revisionist history” and only benefits the manufacturer’s majority owner, David Belford.
Wells Fargo said in a Dec. 30 court filing requesting the Chapter 7 liquidation of United that it is owed $99.21 million in secured debt.
However, the bank acknowledged it “estimates that any recoveries from liquidation of (United’s) collateral will result in a recovery equal to a fraction of this amount.”
United made promotional- to mid-priced upholstered furniture in the U.S. under its brand and the Lane Home Furnishings brand. The manufacturer also imported wooden bedroom and dining furniture.
Wells Fargo has pulled no punches in its court filings.
It claims United has performed post-shutdown “various instances of conduct found to establish a lack of integrity,” “gross mismanagement,” “ongoing incompetence,” and “conflicts of interest” involving Belford, and “lack of credibility and creditor confidence.”
Belford made the decision to shut down United.
United claims Wells Fargo’s motion for an interim trustee was filed “solely to hinder the company’s liquidation plan” and that “there is zero proof whatsoever of fraud, dishonesty or gross management” by United’s owner, board of directors or executive team.
United said it hired Kimberly Harper as chief financial officer on Dec. 1 to lead its attempt to “wind down the company … to preserve the company’s assets, prevent loss to the estate and develop a strategy to maximize the company’s value to all stakeholders.”
Those steps involve Harper negotiating with creditors and handling human resources issues. United cited the hiring of a chief restructuring officer and an outside general counsel.
As such, United claimed that the Wells Fargo motion for an interim trustee is unnecessary.
More salacious info here: https://nypost.com/2023/01/04/united-furniture-lenders-reveal-chaos-surrounding-2700-layoffs/
January 14, 2023
These Are North America’s Biggest Sources Of Electricity By State And Province
by Tyler Durden
Friday, Jan 13, 2023 – 08:40 PM
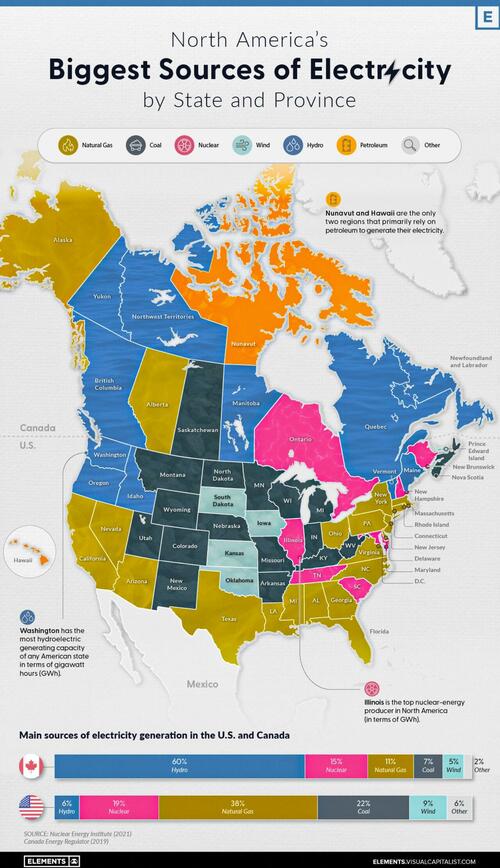
On a national scale, the United States and Canada rely on a very different makeup of sources to generate their electricity.
The U.S. primarily uses natural gas, coal, and nuclear power, while Canada relies on both hydro and nuclear. That said, when zooming in on the province or state level, individual primary electricity sources can differ greatly.
In the infographic below, Visual Capitalist’s Selin Oğuz takes a look at the electricity generation in the states and provinces of these two countries using data from the Nuclear Energy Institute (2021) and the Canada Energy Regulator (2019).
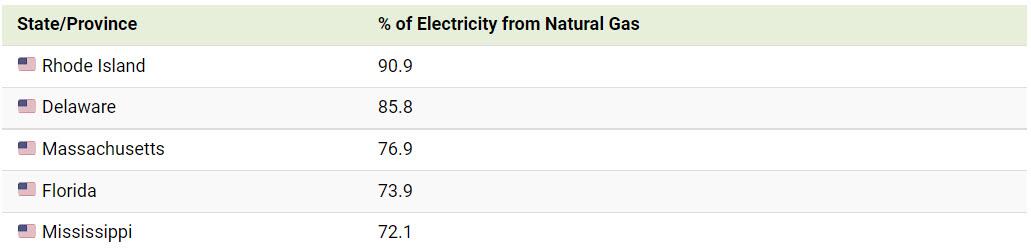
Natural Gas
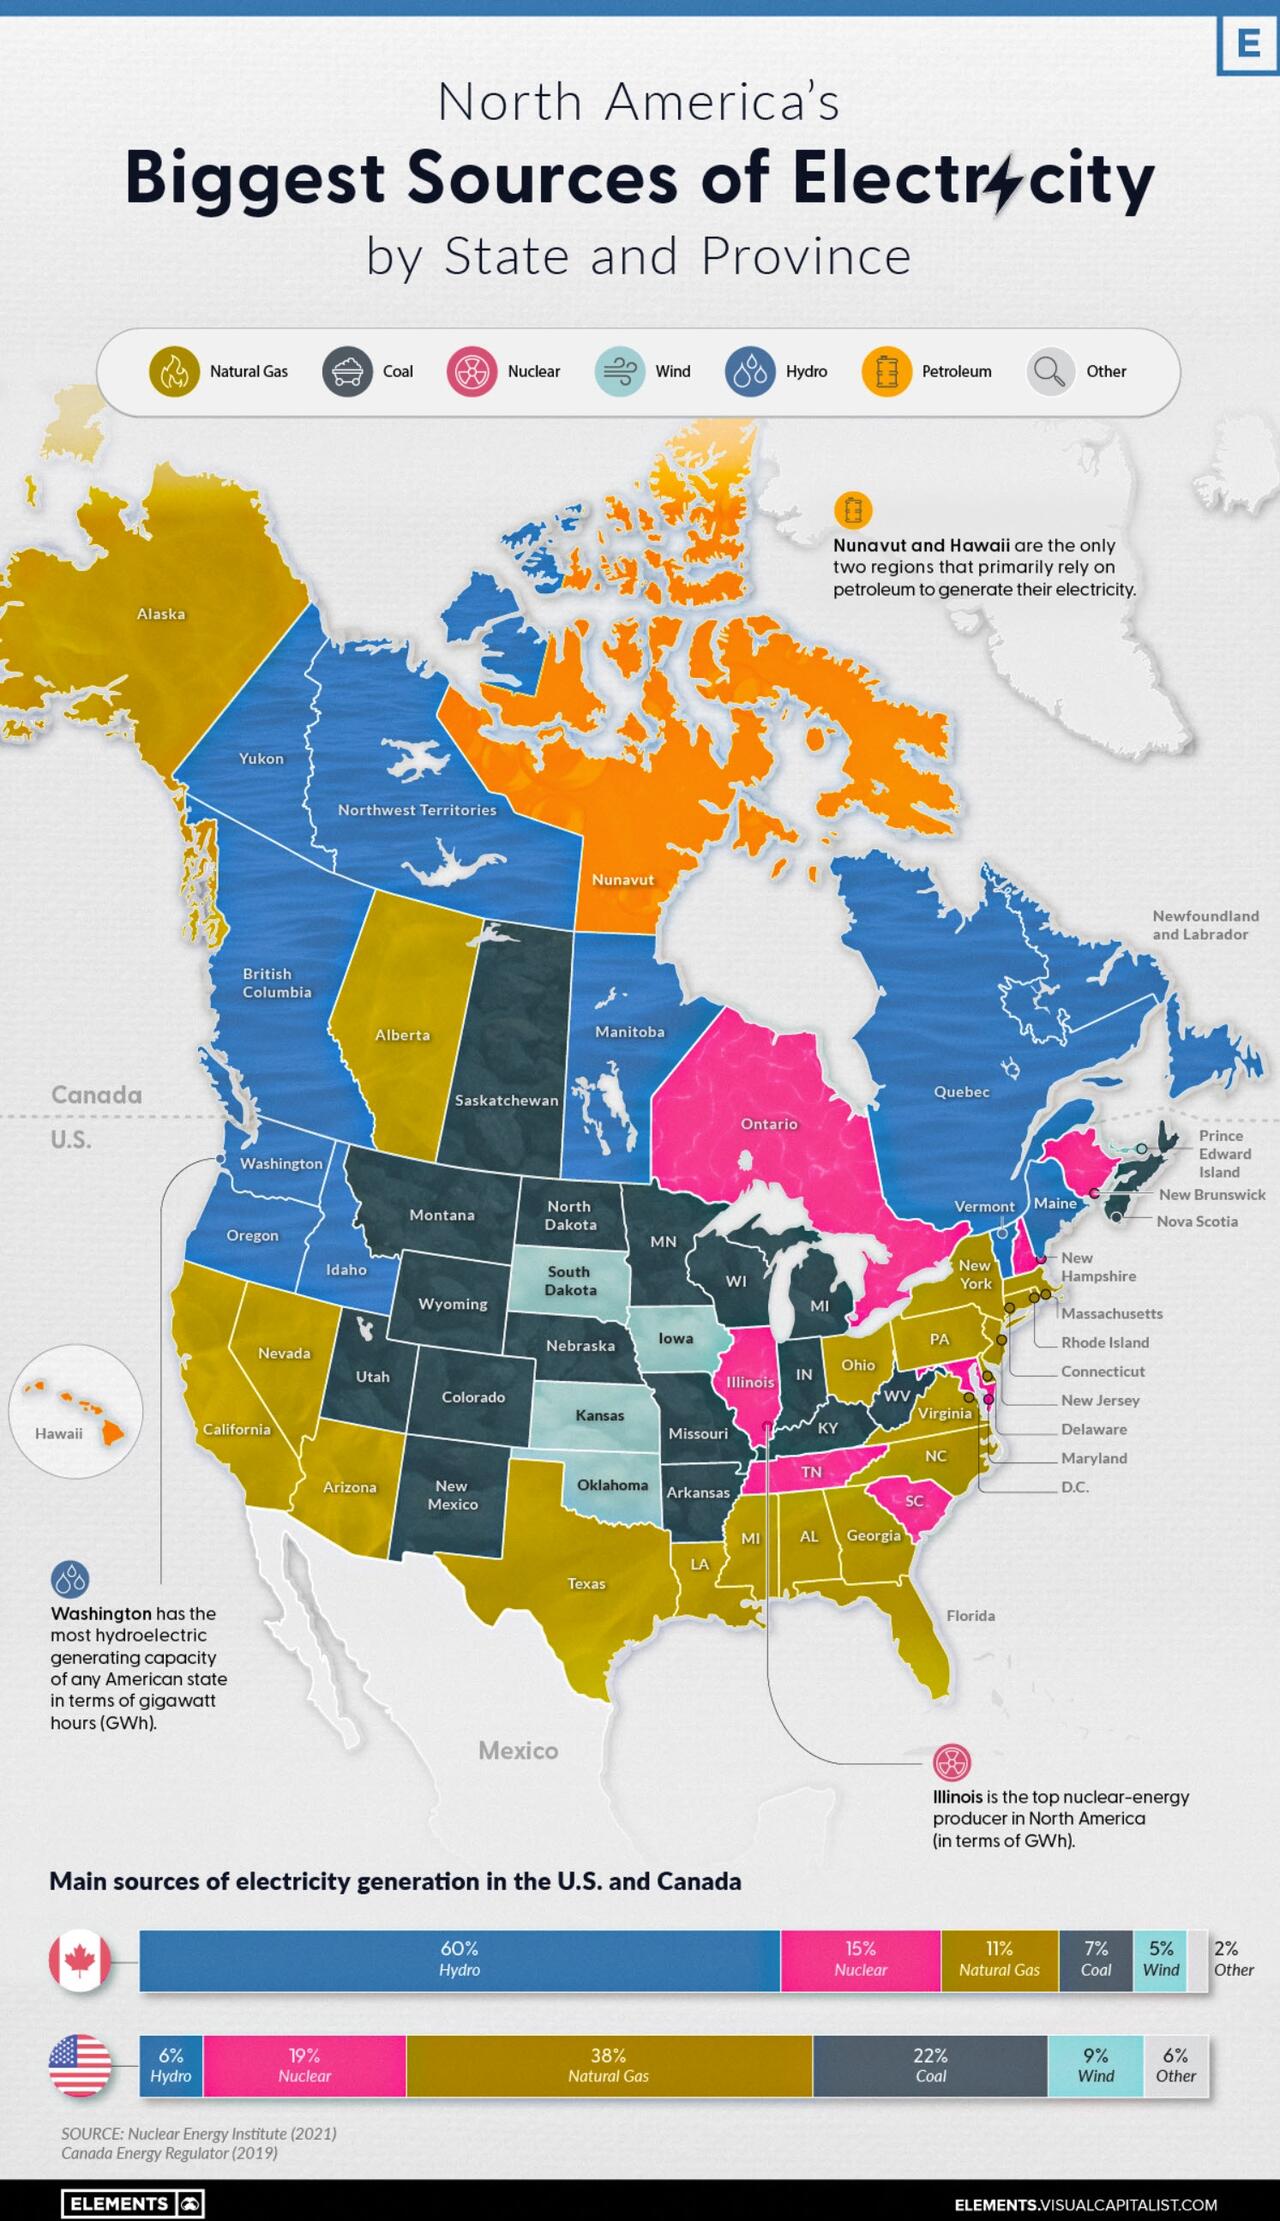
Natural gas is widely used for electricity generation in the United States. Known as a “cleaner” fossil fuel, its abundance, coupled with an established national distribution network and relatively low cost, makes it the leading electricity source in the country.
In 2021, 38% of the 4120 terawatt-hours (TWh) of electricity generated in the U.S. came from natural gas. Not surprisingly, more than 40% of American states have natural gas as their biggest electricity source.
Here are some states that have the largest shares of natural gas-sourced electricity.

In Canada, natural gas is only the third-biggest electricity source (behind hydro and nuclear), accounting for 11% of the 632 TWh of electricity produced in 2019. Alberta is the only province with natural gas as its main source of electricity.
Nuclear
Nuclear power is a carbon-free energy source that makes up a considerable share of the energy generated in both the U.S. and Canada.
19% of America’s and 15% of Canada’s electricity comes from nuclear power. While the percentages are close to one another, it’s good to note that the United States generates 6 to 7 times more electricity than Canada each year, yielding a lot more nuclear power than Canada in terms of gigawatt hours (GWh) per year.
As seen in the map, many states and provinces with nuclear as their main source of electricity are concentrated in the eastern half of the two countries.
In the U.S., Illinois, Pennsylvania, and South Carolina are top producers in terms of GWh/year. Illinois and South Carolina also have nuclear as their primary electricity source, whereas Pennsylvania’s electricity production from natural gas exceeds that from nuclear.
The vast majority of Canada’s nuclear reactors (18 of 19) are in Ontario, with the 19th in New Brunswick. Both of these provinces rely on nuclear as their biggest source of electricity.
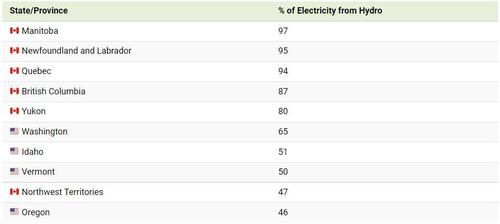
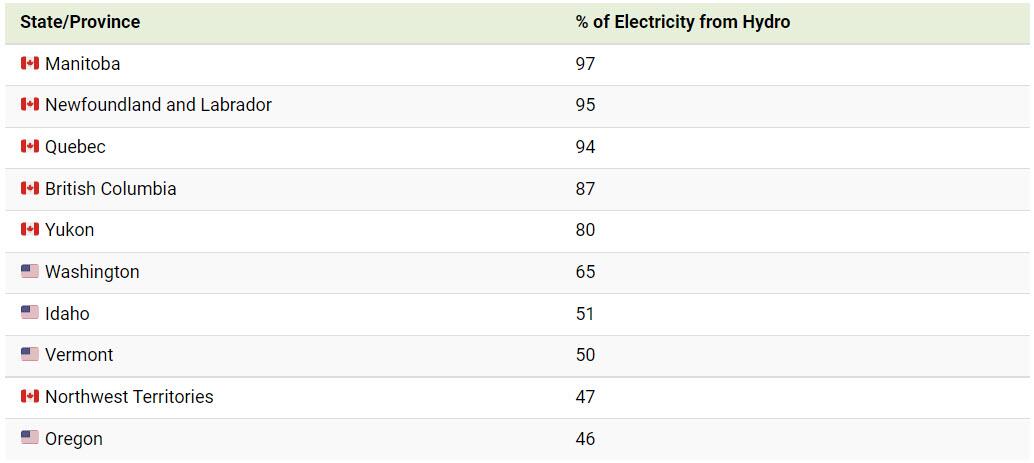
Renewables: Hydro, Wind and Solar
Out of the different types of renewable electricity sources, hydro is the most prevalent in North America. For example, 60% of Canada’s and 6% of the U.S.’s electricity comes from hydropower.
Here are the states and provinces that have hydro as their biggest source of electricity.
Wind and solar power collectively comprise a small percentage of total electricity generated in both countries. While no state or province relies on solar as its biggest source of electricity, Iowa, Kansas, Oklahoma, and South Dakota rely primarily on wind for their electricity, along with Canada’s Prince Edward Island (PEI).
Coal and Oil
Coal and oil are emission-heavy electricity sources still prevalent in North America.
Currently, 22% of America’s and 7% of Canada’s electricity comes from coal, with places such as Kentucky, Missouri, West Virginia, Saskatchewan, and Nova Scotia still relying on coal as their biggest sources of electricity.
Certain regions also use petroleum to generate their electricity. Although its use for this purpose is declining, it is still the biggest source of electricity in both Hawaii and Nunavut.
Over the next few years, it will be interesting to observe the use of these fossil fuels for electricity generation in the U.S. and Canada. Despite the differences in climate commitments between the two countries, lowering coal and oil-related emissions may be a critical part of hitting decarbonization targets in a timely manner.
January 13, 2023
Covestro announces preliminary results for fiscal year 2022

In the course of preparing Covestro’s group accounts for fiscal year 2022, preliminary full-year financial figures deviate from capital market expectations, based on the average values of latest consensus estimates of financial analysts, published by Vara Research on January 12, 2023.
“Covestro’s business development last year was clearly impacted by the sharp rise in energy and raw material costs, high inflation and a weakening global economy,” says Dr. Markus Steilemann, CEO of Covestro. “Nevertheless, our products are part of the solution to the current crisis and essential for a sustainable and circular future.”
Dr. Thomas Toepfer, CFO of Covestro, adds: “The recessionary environment and the extraordinary depreciation, in particular as a result of the current difficult economic conditions in Europe, additionally weighed on the Group’s earnings. However, our record-high sales and clearly positive free operating cash flow also show that even in these difficult times we are succeeding in generating cash. Our balance sheet is very solid, so we are also prepared for a prolonged economic downturn.”
Covestro provides already today the following preliminary key financial data for fiscal year 2022:
- Preliminary sales amount to 17,968 million euros. The consensus expects this figure to be 17,999 million euros.
- Preliminary EBITDA amounts to approx. 1,610 million euros. The previous guidance expected EBITDA to be between 1,700 million euros and 1,800 million euros. The consensus expects this figure to be 1,679 million euros.
- Preliminary net income amounts to approx. –300 million euros. The consensus expects this figure to be 420 million euros. The Group’s net income is particularly burdened by extraordinary depreciation of non-current assets in the amount of approx. 470 million euros and by adjustments of deferred tax assets in the amount of approx. 250 million euros.
- Preliminary free operating cash flow (FOCF) amounts to approx. 130 million euros. The previous guidance expected FOCF to be between EUR 0 and EUR 100 million. The consensus expects this figure to be –39 million euros.
The Annual Report 2022 will be published on March 2, 2023.