Current Affairs
January 20, 2023
Pent Up Demand
December trailer orders 2nd highest on record
Catch-up of suppressed orders skews bookings in last month of 2022
· Thursday, January 19, 2023

Listen to this article
0:00 / 2:52BeyondWords
Trailer manufacturers posted 57,300 orders in December, the second-highest monthly intake since ACT Research began tracking in 1996. The volume appeared to be a catch-up after OEMs blocked many orders from April to August because they lacked pricing visibility.
“I cannot speak for other OEMs. However, our higher booking in December was driven by the later opening of the order books as we awaited required quoting information from the supply base,” Sean Kenney, chief sales officer for Hyundai Translead, told FreightWaves.
“Hyundai Translead is anticipating continued higher-than-normal orders for the next few months as we work through the impact of this.”

December net U.S. trailer orders came in 46% higher compared to November and 115% above December 2021, ACT Research reported. The highest month on record was September 2018, with 57,800 net orders.
Some manufacturers report that the supply of parts has deteriorated despite their acceptance of the huge number of December orders.
Lingering supply chain concerns for future trailer orders
“Supply-chain concerns still linger,” with no short-term improvement in sight, Jennifer McNealy, ACT director of commercial vehicle market research and publications, said in a news release. “Regarding demand, most trailer makers continue to see demand exceeding capacity through the end of 2023.”
One major OEM, Wabash, announced a long-term supply agreement Jan. 10 with J.B. Hunt Transport covering up to 15,000 trailers over the next few years.
Some OEMs mentioned an erosion in confidence to ACT, but so far it is not showing up in order cancellations.
Mike Baudendistel, a FreightWaves market expert, expressed surprise at the order volume in December.
“It could be some makeup orders to compensate for the supply constraints the past couple years,” he said. “I would think the orders were even more heavily weighted toward the large enterprise carriers than they usually are since they are well capitalized and their business holds up better in a weakening market.”
Total net orders placed in 2022 were 361,500 compared to 249,400 in 2021. The industry produced approximately 306,000 trailers in 2022.
“Our projections point to a continuation of that upward trend into 2023,” McNealy said.
January 17, 2023
Freight Market Improving
High-frequency truckload data suggests the freight market is stabilizing
Craig Fuller, CEO at FreightWaves
· Monday, January 16, 2023

Listen to this article
0:00 / 2:30BeyondWords
Did the first quarter lull come early, in November and December of 2022?
For carriers, the first quarter is always the most difficult period in the annual freight calendar, when retailers clear their excess holiday inventory, construction takes a pause for the frigid weather and everything is gloomy and cold. The soft first quarter often follows a robust fourth quarter, in which freight companies enjoy the annual peak season and make an outsized portion of their profits. Carriers look forward to spring for some market stability and potential market accelerations.
Is it possible that winter came early this year? Did the freight winter start in November and now we are experiencing an early thaw?
Early freight data and channel checks would suggest the freight market could be stabilizing and clearer skies are ahead.
Over the past week, we’ve spoken with numerous freight executives who have mentioned that the first two weeks of the first quarter are shaping up better than expected, granted, expectations were incredibly low after such a weak peak.
Going into the quarter, executives we spoke with predicted a significant collapse in freight for the first quarter, with a seasoned veteran executive of a large trucking technology firm predicting that the first quarter would be the worst in his four-decade career. It was a fair bet considering how challenging the second half of the 2022 was for most in the freight market.
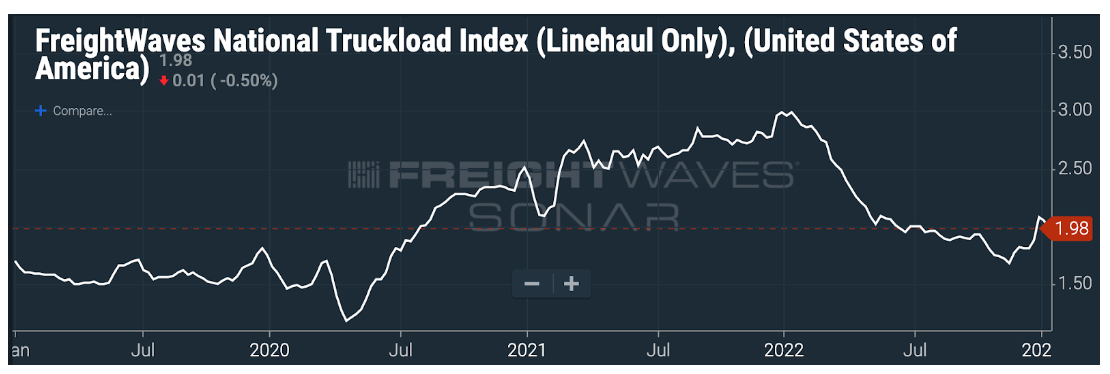
Truckload spot rates, according to the FreightWaves National Truckload Index, hit a low of $1.67 on Nov. 17, 2022, and have since bounced back to $1.98 per mile.
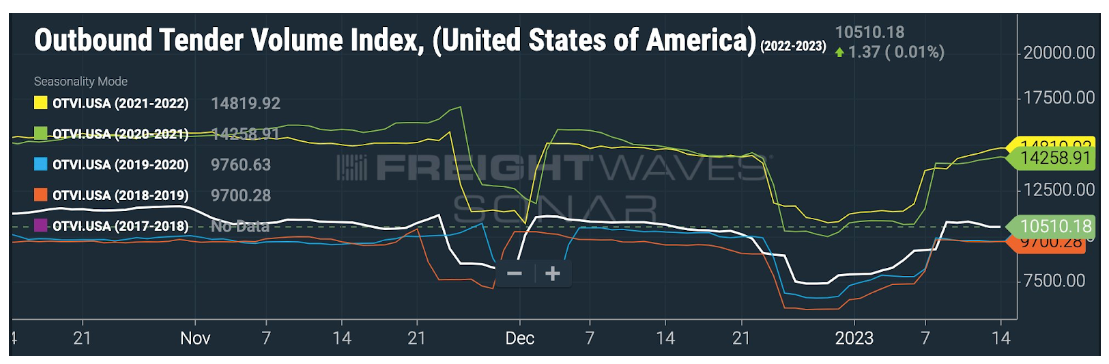
Trucking tender volumes also suggest that the direst of predictions have not played out. Tender volumes on the Outbound Tender Volume Index (OTVI), an index that tracks the volumes of load requests from shippers to carriers, show that volumes briefly dipped below 2019 and 2020 levels, but they have since broken away from this baseline.
If the first few weeks of the new year are an early omen, then the freight market may have bottomed in the fourth quarter and carriers can look forward to a far less volatile market in 2023.
Interested in being the first to know about the changes in the global freight market so that you can prepare your business for market changes before your competitors? All of the data in this article is available via subscription to SONAR, the world’s leading high-frequency data platform.
January 14, 2023
Fun For The Weekend
These Are North America’s Biggest Sources Of Electricity By State And Province
by Tyler Durden
Friday, Jan 13, 2023 – 08:40 PM
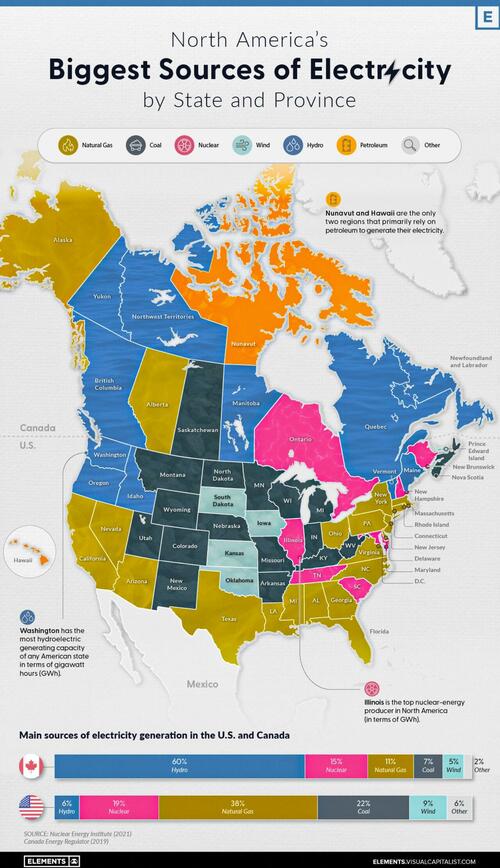
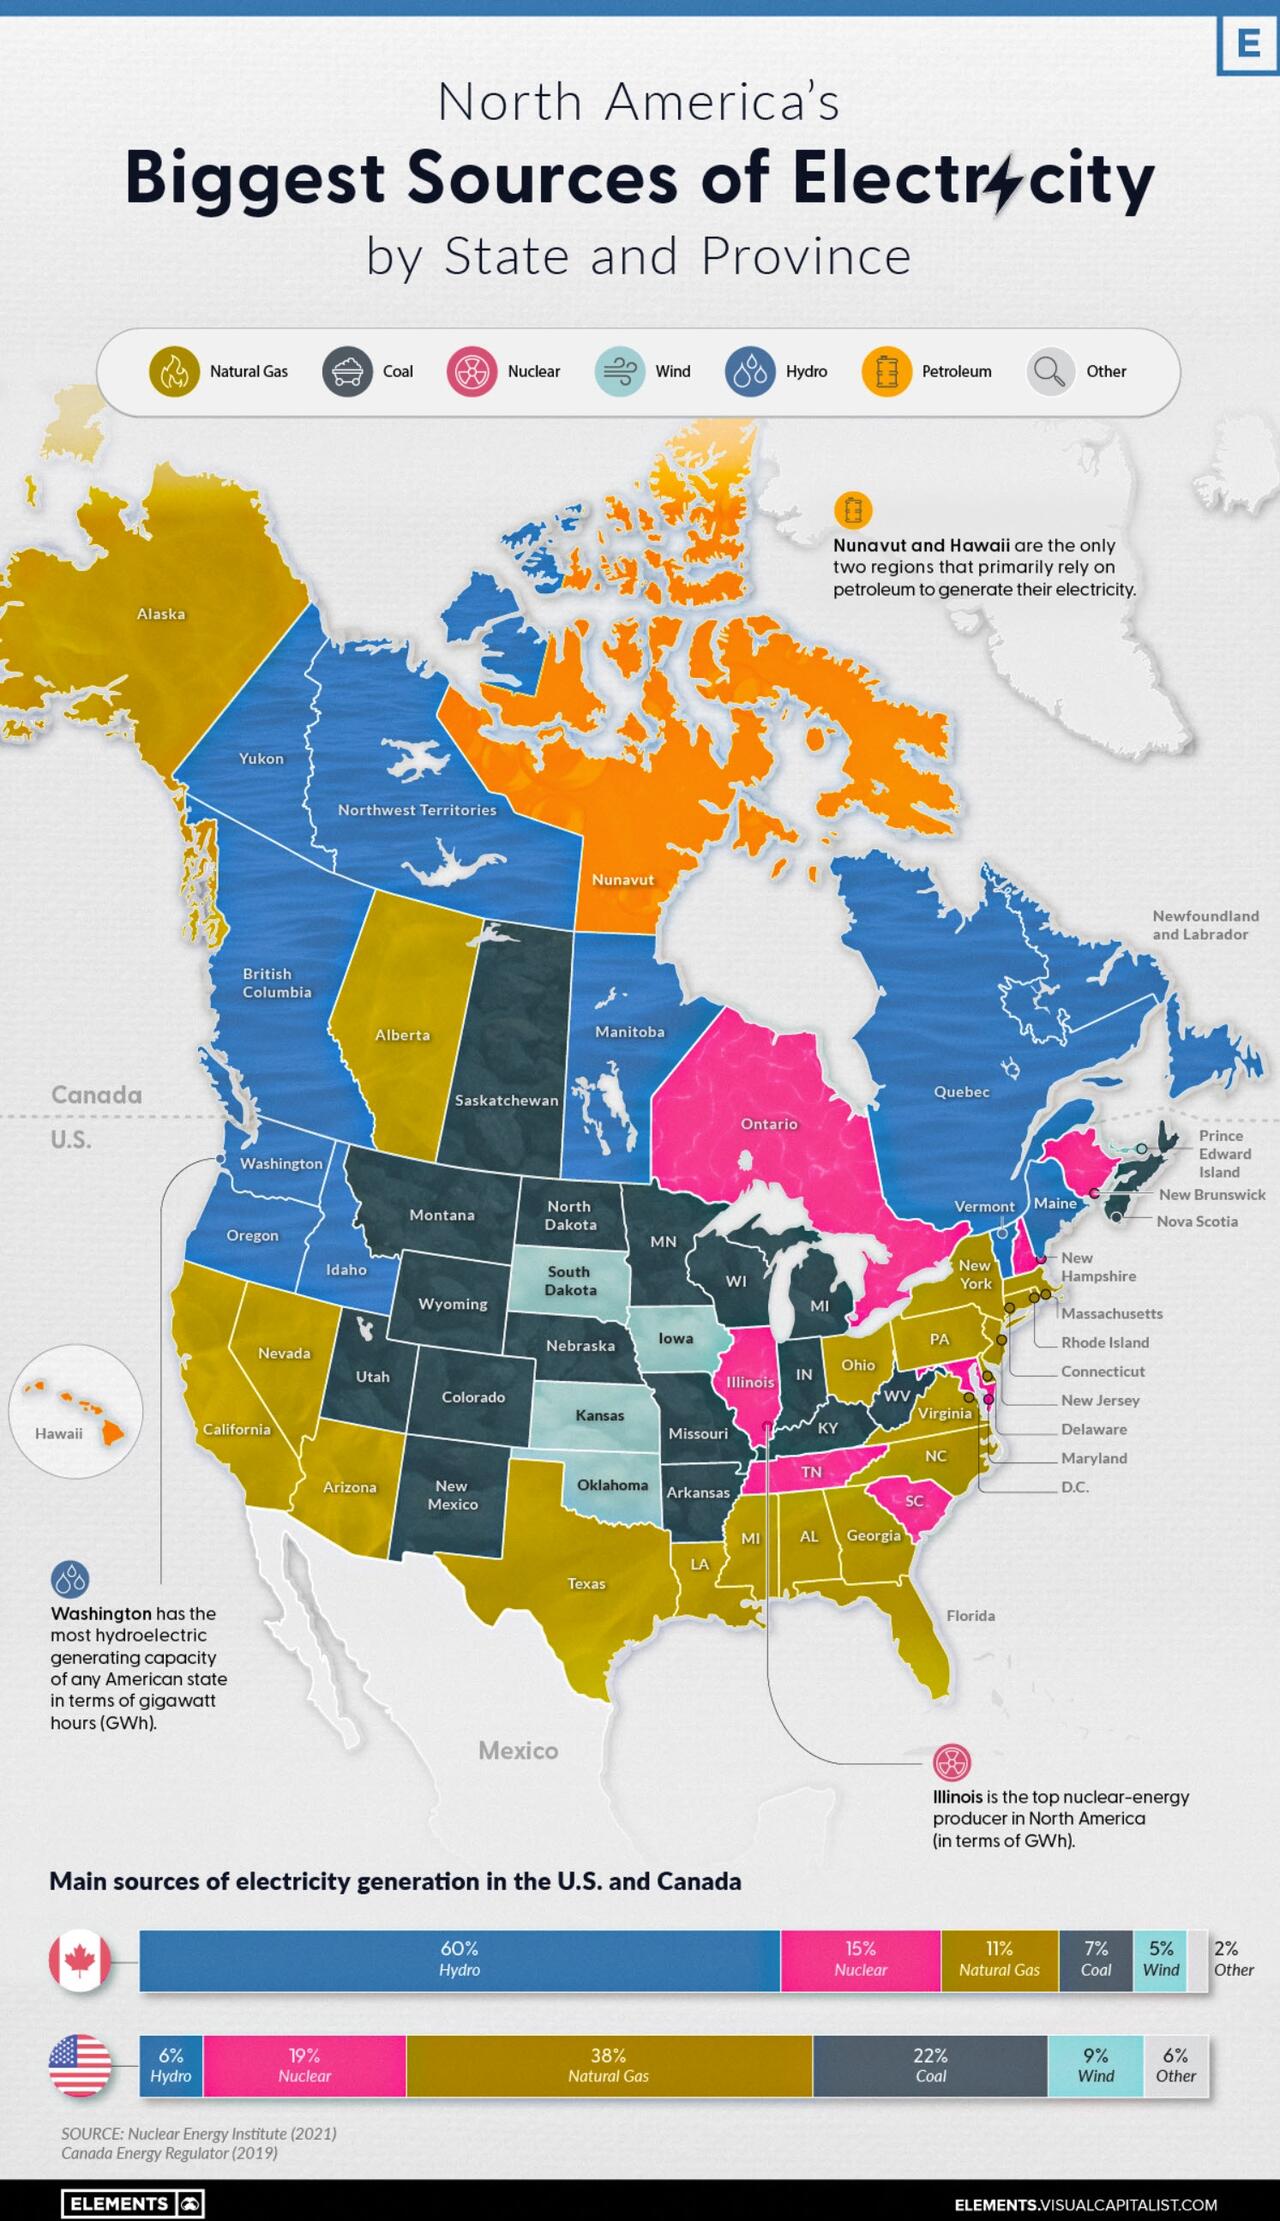
On a national scale, the United States and Canada rely on a very different makeup of sources to generate their electricity.
The U.S. primarily uses natural gas, coal, and nuclear power, while Canada relies on both hydro and nuclear. That said, when zooming in on the province or state level, individual primary electricity sources can differ greatly.
In the infographic below, Visual Capitalist’s Selin Oğuz takes a look at the electricity generation in the states and provinces of these two countries using data from the Nuclear Energy Institute (2021) and the Canada Energy Regulator (2019).
Natural Gas
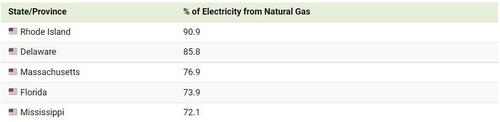
Natural gas is widely used for electricity generation in the United States. Known as a “cleaner” fossil fuel, its abundance, coupled with an established national distribution network and relatively low cost, makes it the leading electricity source in the country.
In 2021, 38% of the 4120 terawatt-hours (TWh) of electricity generated in the U.S. came from natural gas. Not surprisingly, more than 40% of American states have natural gas as their biggest electricity source.
Here are some states that have the largest shares of natural gas-sourced electricity.
In Canada, natural gas is only the third-biggest electricity source (behind hydro and nuclear), accounting for 11% of the 632 TWh of electricity produced in 2019. Alberta is the only province with natural gas as its main source of electricity.
Nuclear
Nuclear power is a carbon-free energy source that makes up a considerable share of the energy generated in both the U.S. and Canada.
19% of America’s and 15% of Canada’s electricity comes from nuclear power. While the percentages are close to one another, it’s good to note that the United States generates 6 to 7 times more electricity than Canada each year, yielding a lot more nuclear power than Canada in terms of gigawatt hours (GWh) per year.
As seen in the map, many states and provinces with nuclear as their main source of electricity are concentrated in the eastern half of the two countries.
In the U.S., Illinois, Pennsylvania, and South Carolina are top producers in terms of GWh/year. Illinois and South Carolina also have nuclear as their primary electricity source, whereas Pennsylvania’s electricity production from natural gas exceeds that from nuclear.
The vast majority of Canada’s nuclear reactors (18 of 19) are in Ontario, with the 19th in New Brunswick. Both of these provinces rely on nuclear as their biggest source of electricity.
Renewables: Hydro, Wind and Solar
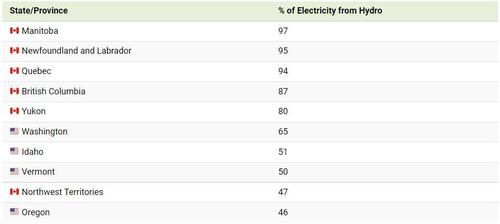
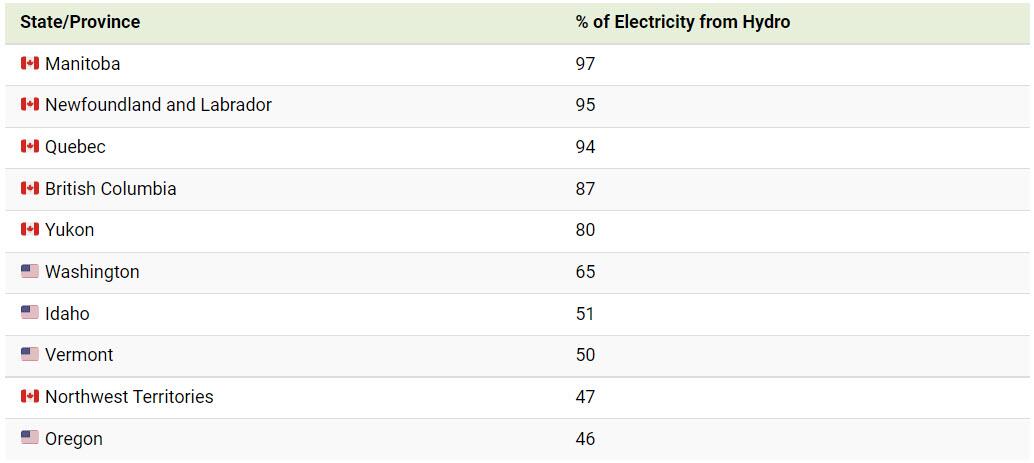
Out of the different types of renewable electricity sources, hydro is the most prevalent in North America. For example, 60% of Canada’s and 6% of the U.S.’s electricity comes from hydropower.
Here are the states and provinces that have hydro as their biggest source of electricity.
Wind and solar power collectively comprise a small percentage of total electricity generated in both countries. While no state or province relies on solar as its biggest source of electricity, Iowa, Kansas, Oklahoma, and South Dakota rely primarily on wind for their electricity, along with Canada’s Prince Edward Island (PEI).
Coal and Oil
Coal and oil are emission-heavy electricity sources still prevalent in North America.
Currently, 22% of America’s and 7% of Canada’s electricity comes from coal, with places such as Kentucky, Missouri, West Virginia, Saskatchewan, and Nova Scotia still relying on coal as their biggest sources of electricity.
Certain regions also use petroleum to generate their electricity. Although its use for this purpose is declining, it is still the biggest source of electricity in both Hawaii and Nunavut.
Over the next few years, it will be interesting to observe the use of these fossil fuels for electricity generation in the U.S. and Canada. Despite the differences in climate commitments between the two countries, lowering coal and oil-related emissions may be a critical part of hitting decarbonization targets in a timely manner.
January 13, 2023
European Flexible Foam Update
Europur: Supply situation improves / prices of raw materials historically high
Jan 10, 2023

According to Europur, the European Association of Flexible PU Foam Blocks Manufacturers, even though gas prices in Europe have receded compared to the summer, they remain historically high and volatile in Europe, creating difficulties for the entire chemicals industry, in which gas is used both as a raw material and as a source of energy.
As reported by CEFIC, the European Chemical Industry Council, in October 2022 for the first time ever Europe imported more chemicals than it exported, and the industry at large is at “a breaking point”. Major German raw materials suppliers, also active in the polyurethane supply chain, have warned that the situation may prompt them to adapt their European strategies in the short term.
Being strongly dependent on the supply of chemical raw materials, the above means the situation was precarious over the autumn for the flexible polyurethane foam industry. Especially since this was combined with the additional difficulty that the three European sites producing TDI (Toluene Diisocyanate) – one of the main chemicals used to make foam blocks – halted production for various reasons. While two have in the meantime restarted production, one of them remains under force majeure. All suppliers did their utmost to stabilize supply, notably by using their global networks to import TDI from Asia and the USA, but such extensive rotations of ships require time to be put in place.
In parallel, demand for foam is reported to have decreased due to reduced demand, mostly from the upholstered furniture and bedding markets, as Europeans divert their spending to other items.
As a result of the declining demand and of the restart of European production / stable imports of chemicals, foam shortages have largely receded during November 2022. Prices of chemical raw materials have also started to stabilise. However, with continued high gas prices, they remain historically high as reported in specialised trade press.
The evolution of the situation for the future remains quite uncertain, as the flexible polyurethane foam supply chain can be influenced positively or negatively by any of these factors:
- Gas prices in Europe and operational cost of the chemical industry / anticipated uncertainty on stability of gas supply in Europe over much of 2023.
- The evolution of the pandemic in Asia and particularly China, which can influence price of chemical raw materials at global level and possibility for exports to Europe.
- Evolution of demand in Europe for foam-containing products, especially mattresses and furniture.
January 12, 2023
EVERCHEM UPDATE: VOL. 07 – Green Lights and Bailouts
GREEN LIGHT: It’s that unwonted time of year again, the slow drag of December selloffs has finalized, and the purchasing department dogs are let loose. BAILOUTS: Once an economic downturn presents itself in grandiose enough manner to be leveraged, victimhood goes in vogue.