
Current Affairs
November 18, 2024
Mattress Imports

November 10, 2024
Things are Changing Already
The Great Freight Recession Is Officially Over
by Tyler Durden
Sunday, Nov 10, 2024 – 02:00 PM
By Craig Fuller of FreightWaves
I’ve been closely following the freight market, and it’s clear that the Great Freight Recession has ended. After the most prolonged freight recession in history, the market has been showing signs of recovery over the past few months. This shift is backed by SONAR data, confirming a market turnaround.
Tender rejections rising: The increase in tender rejections to over 6% signals that the market is tightening. After seeing rejections dip to 3.4% post-Labor Day last year, this change indicates that carriers now have more control in choosing which loads they accept, thus shifting market dynamics in their favor.
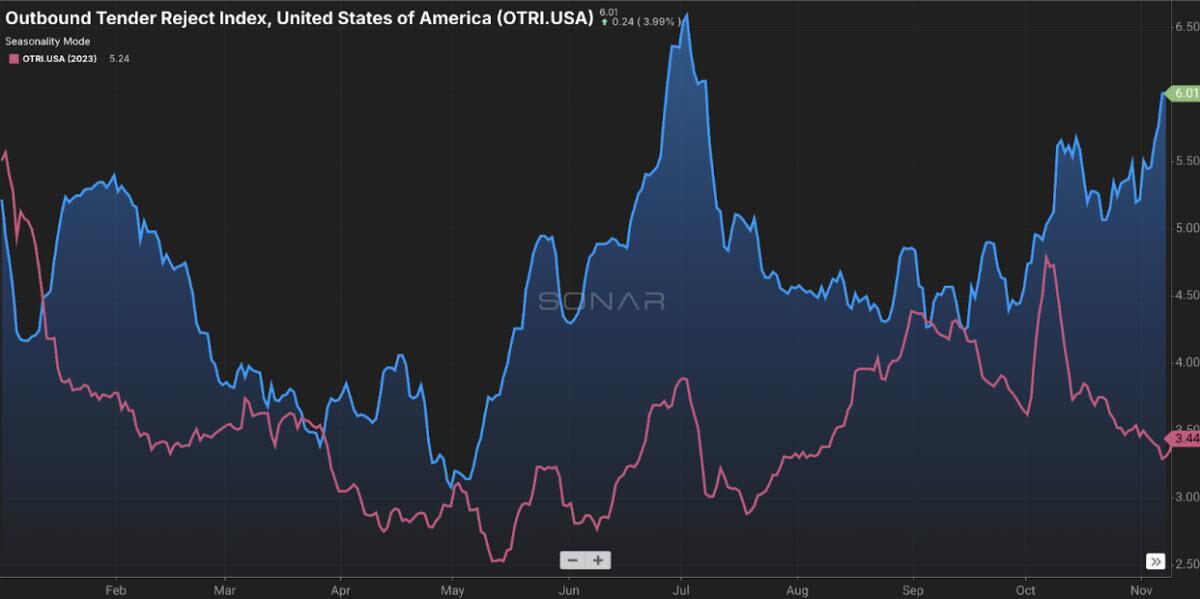
Spot rates increasing: Spot rates are also climbing, surpassing those of 2022 and 2023, which tells me there’s either a surge in demand or a decrease in available capacity, possibly both. This could catch many expecting the low rates to persist off guard. Truckload rates are up to $1.78 from $1.54 a year ago.
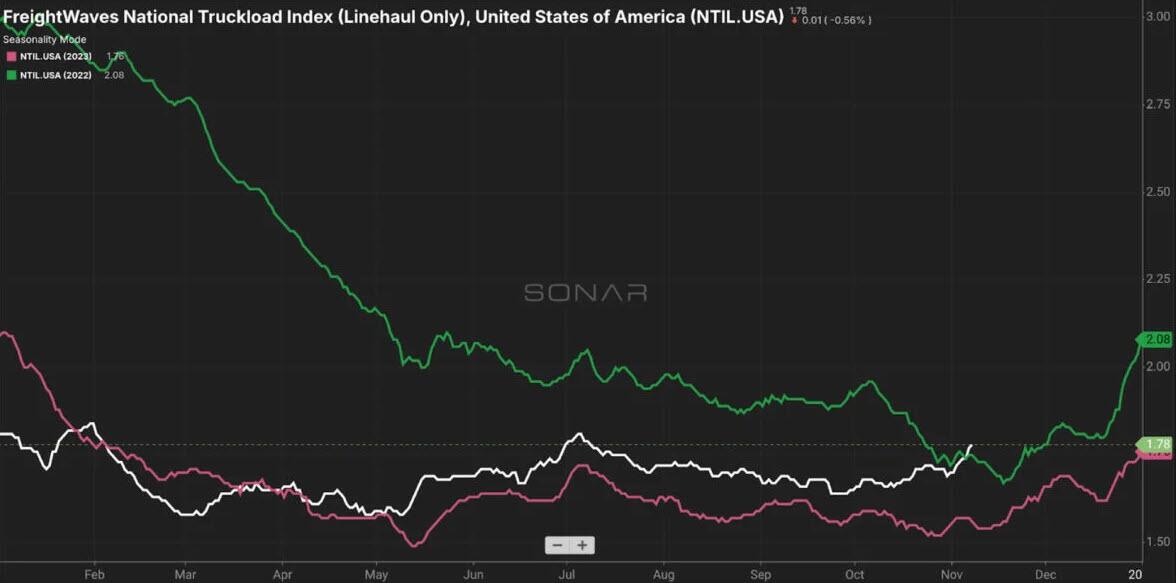
Carrier revenge could be coming next year: “Carrier revenge” implies that carriers, after a period of low rates and high competition, might leverage their position to negotiate better rates or reject tenders more selectively in the coming months, affecting shippers’ logistics strategies, especially routing guides.
Decreasing capacity: Speaking of capacity, the upcoming implementation of the FMCSA’s Clearinghouse-II regulations on Nov. 18, 2024, will have a significant impact. Trucking expert Adam Wingfield stated that 177,000 truck drivers could potentially lose their CDLs, further tightening the market as state agencies need to query the Clearinghouse for any licensing actions.
This regulation requires:
- State Driver Licensing Agencies (SDLAs) to remove the commercial driving privileges of drivers in a “prohibited” status in the Clearinghouse. This action will result in a downgrade of the Commercial Driver’s License (CDL) until the driver completes the return-to-duty (RTD) process.
- SDLAs must query the Clearinghouse before issuing, renewing, upgrading, or transferring CDLs and Commercial Learner’s Permits (CLPs). This step ensures that drivers with unresolved drug or alcohol violations are not allowed to operate commercial motor vehicles.
Political influence: Trump’s election could accelerate freight demand as policy changes could stimulate economic activity, increasing the need for freight services. This includes income and corporate tax cuts, bonus depreciation, pre-stocking for tariffs, investment in domestic manufacturing and the change in freight dynamics from containers to surface (trucking, rail and domestic warehousing).
Immigration deportation: According to the Bureau of Labor and Statistics, 20% of truck driver employees are immigrants. While many of these are legal immigrants into the U.S., there are numerous reports of drivers using international driver’s licenses and fake documents to drive in the U.S.
It is hard to know the percentage here, as the data is sparse (after all, the undocumented workers would not admit it). Having been around the industry, any opportunity to game the system will undoubtedly be used. Are undocumented workers 1% of the population of immigrants or 10%?
I don’t know, but if Trump follows through with his threats of deportations, this could remove some percentage of the trucking industry’s excess capacity and make it harder for carriers that skirt the law to stay in business.
Current sentiment: Following a decisive election, I believe the freight market is recovering and might exceed expectations over the next year.
Don’t rely on lagging data: The current conditions in the freight market have been debated extensively, but with the volatility of freight, it is imperative to make decisions based on the freshest and most accurate data. This can only be accomplished with high-frequency data that offers real-time insights into market direction. SONAR’s high-frequency data is refreshed data and offers real-time supply and demand metrics with the most accurate spot and contract data in freight.
This scenario points towards a robust recovery in the freight market, potentially leading to higher freight rates, a shift in power dynamics between shippers and carriers, and an overall more vibrant market environment.
Shippers are advised to prepare for these changes by locking in rates or diversifying their carrier base to mitigate risks associated with routing guide breakdowns.
https://www.zerohedge.com/economics/great-freight-recession-officially-over
November 4, 2024
Manufacturing PMI Falls
Manufacturing PMI at 46.5%, wood products and furniture contract overall
By Dakota Smith
November 1, 2024 | 11:15 am CDT

TEMPE, Ariz. — Economic activity in the manufacturing sector contracted in October for the seventh consecutive month and the 23rd time in the last 24 months, say the nation’s supply executives in the latest Manufacturing ISM Report On Business.
The report was issued today by Timothy R. Fiore, CPSM, C.P.M., chair of the Institute for Supply Management (ISM) Manufacturing Business Survey Committee:
“The Manufacturing PMI registered 46.5 percent in October, 0.7 percentage point lower compared to the 47.2 percent recorded in September. This is the lowest Manufacturing PMI reading in 2024. The overall economy continued in expansion for the 54th month after one month of contraction in April 2020. (A Manufacturing PMI above 42.5 percent, over a period of time, generally indicates an expansion of the overall economy.)
Fiore continues, “U.S. manufacturing activity contracted again in October, and at a faster rate compared to last month. Demand continues to be weak, output declined, and inputs stayed accommodative. Demand slowing was reflected by the (1) New Orders Index remaining in contraction territory, (2) New Export Orders Index contracting moderately, (3) Backlog of Orders Index dropping further into strong contraction territory, and (4) Customers’ Inventories Index indicating customers’ inventories were ‘too low.’ Output (measured by the Production and Employment indexes) continued in contraction.

Wood products and furniture & related products overall manufacturing metrics were not measured in this report.
Wood products saw a contraction in:
- Inventories
Growth:
- Employment
- Inventories
- Prices for raw materials
A respondant in the wood products industry stated, “The seasonal business cycle is as planned: Consumer confidence in building materials remains relatively strong, and expectations are for continued growth into 2025 due to reduced interest rates and the potential for further small cuts.”
Furniture & related products saw a contraction in:
- New orders
- Employment
- Supplier deliveries
- Backlogs
- Volumes of imports
Growth:
- Customer inventories
The data presented herein is obtained from a survey of manufacturing supply executives based on information they have collected within their respective organizations. ISM makes no representation, other than that stated within this release, regarding the individual company data collection procedures. The data should be compared to all other economic data sources when used in decision-making.
October 22, 2024
Remodeling Expected to Grow
A turn to growth expected for residential remodeling
By Dakota Smith
October 17, 2024 | 10:09 am CDT

CAMBRIDGE, Ma. — After a mild pullback over the previous year, spending for improvements and repairs on owner-occupied homes is set to expand once again by the middle of next year, according to the Leading Indicator of Remodeling Activity (LIRA) released by the Remodeling Futures Program at the Joint Center for Housing Studies of Harvard University. The LIRA projects that annual expenditures for home renovation and maintenance will grow by 1.2 percent through the third quarter of 2025.
“A continued thaw in new home construction and sales of existing homes bodes well for an uptick in residential improvement and repairs next year,” says Carlos Martín, Director of the Remodeling Futures Program at the Center. “Additionally, stronger gains in home values and thus home equity levels should boost both discretionary and ‘need-to-do’ replacement projects for owners staying in place.”
“Annual spending for home improvements and maintenance is projected to grow from $472 billion today to $477 billion through the third quarter of 2025,” says Abbe Will, Associate Director of the Remodeling Futures Program. “A quick return to growth after a fairly modest downturn ultimately means that residential remodeling and repair expenditures are expected to approach past peak levels moving forward.”
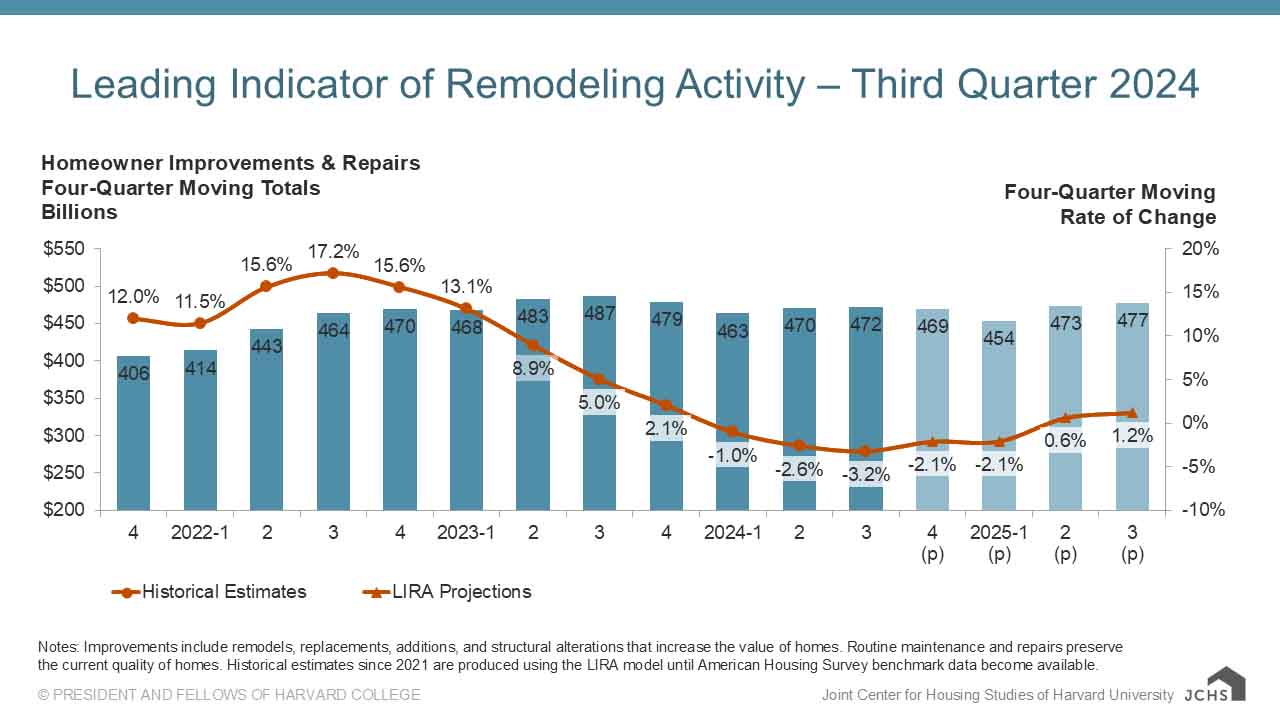
The Leading Indicator of Remodeling Activity (LIRA) provides a short-term outlook of national home improvement and repair spending to owner-occupied homes. The indicator, measured as an annual rate-of-change of its components, is designed to project the annual rate of change in spending for the current quarter and subsequent four quarters, and is intended to help identify future turning points in the business cycle of the home improvement and repair industry. Originally developed in 2007, the LIRA was re-benchmarked in April 2016 to a broader market measure based on the biennial American Housing Survey.
The LIRA is released by the Remodeling Futures Program at the Joint Center for Housing Studies of Harvard University in the third week after each quarter’s closing. The next LIRA release date is January 16, 2025.
October 22, 2024
Single Family Starts Rise
Single-family starts trends upward in September
By Dakota Smith
October 18, 2024 | 10:32 am CDT

With the Federal Reserve beginning an easing of monetary policy and builder sentiment improving, single-family starts posted a modest gain in September while multifamily construction continued to weaken. The National Association of Home Builders says this is because of tight financing and an ongoing rise in completed apartments.
Overall housing starts decreased 0.5% in September to a seasonally adjusted annual rate of 1.35 million units, according to a report from the U.S. Department of Housing and Urban Development and the U.S. Census Bureau.
The September reading of 1.35 million starts is the number of housing units builders would begin if development kept this pace for the next 12 months. Within this overall number, single-family starts increased 2.7% to a 1.03 million seasonally adjusted annual rate. On a year-to-date basis, single-family construction is up 10.1%. The multifamily sector, which includes apartment buildings and condos, decreased 9.4% to an annualized 327,000 pace. This marks the weakest pace since May.
“Single-family construction increased in September, mirroring NAHB’s survey of builder confidence,” said Carl Harris, chairman of the National Association of Home Builders (NAHB) and custom home builder from Wichita, Kan. “In the long-run, the most effective way to tackle the nation’s housing affordability crisis is to increase the housing supply. And as the election looms, policymakers need to be focused on the supply-side of the market to let builders build.”
“While single-family home building increased in September, higher mortgage interest rates in October are likely to place a damper on growth in next month’s data,” said NAHB Chief Economist Robert Dietz. “Nonetheless, NAHB is forecasting a gradual, if uneven, decline for mortgage rates in the coming quarters, with corresponding increases for single-family construction. Multifamily construction will remain weak as completions of apartments are elevated.”
The number of single-family homes under active construction totaled 642,000 in September. After stabilizing recently, this is down just 4.5% from a year ago. The number of multifamily units under construction declined 3.4% in September to an 842,000 total. This is 16.5% lower than a year ago and is the smallest count since February 2022.
As a sign of the reversal for multifamily construction, the seasonally adjusted annual rate of multifamily construction was 680,000 in September. This was roughly twice the pace of multifamily starts, meaning for every two apartments finishing construction, only one new unit began construction. The pace of multifamily completions was up 41% compared to a year ago.
 Everchem Updates Archive
  Sign Up for Email Updates
