Current Affairs
October 11, 2022
Imports Slow
US imports sink in September, suffer steepest drop since 2020 lockdowns
Descartes: September imports down 11% year on year and 12.4% vs. August
Greg Miller Follow on Twitter Monday, October 10, 2022
4 minutes read

First came the pullback in spot shipping rates from their historic peak. Then came reports of plunging Asian bookings and mass retail order cancellations, with spot rates falling even faster. Now, all of this is finally showing up at America’s ports.
According to Descartes, which aggregates U.S. Customs data, inbound volumes to all U.S. ports totaled 2,215,731 twenty-foot equivalent units in September. That’s down 11% year on year and 12.4% from August.

Last month’s imports came in below September 2020 levels, albeit still up 9% from September 2019, pre-COVID. Imports this September were down 15.5% versus May, the month inbound volumes hit an all-time high, according to Descartes data.
To put the severity of last month’s drop in historical perspective, September’s 313,311-TEU decline versus August was the steepest month-to-month drop since the 364,454-TEU plunge in February 2020 versus the month before, back when Chinese authorities first locked down Wuhan.
“We’ve had a pretty significant correction here,” said Chris Jones, executive vice president of industry and services at Descartes Systems Group, in an interview with American Shipper on Monday.
This is normally the time of year when imports seasonally decline — but not by this much. “There was an inflection, and it was a big one,” he said. “In some respects, this is not inconsistent with other years [pre-COVID]. It’s just more severe.”
If the usual seasonal pattern holds true from here, Jones added, imports “should slow down for the rest of the year.”
Imports decline on all three coasts
This summer, overall U.S. imports remained stubbornly high, hovering near record levels even as West Coast volumes declined. West Coast losses were offset by East and Gulf Coast gains, reportedly due to shippers shifting cargoes eastward due to fears of West Coast peak season congestion and labor unrest.
The pattern changed last month. Ports on all three coasts saw volumes drop versus August, according to Descartes. Most surprisingly, it found that imports fell 21.5% in Savannah, Georgia, from 285,341 TEUs to 223,966 TEUs.

Savannah, along with New York/New Jersey, has been one of the big winners of the eastward shift. Savannah posted record imports in August. It has had the country’s longest queue of waiting ships for months. As of Monday, ship-position data showed 35 ships still waiting. The presence of so many vessels offshore confirms there is no shortage of cargo waiting to be unloaded in Savannah, so how could its import numbers fall so steeply in September?
The answer appears to be: Hurricane Ian. A spokesperson for the Georgia Ports Authority (GPA) told American Shipper: “September volume was impacted due to Hurricane Ian and the suspension of vessel service for roughly three days. GPA has since been accommodating that volume, which will be reflected in October numbers.”
However, the one-off hurricane effect doesn’t change the overall story on U.S. imports. Even with Savannah’s September decline removed from the numbers, countrywide imports fell 11% versus August.
Volumes from China collapsing
The big driver of declines on all three coasts: collapsing imports from China.
According to Descartes, U.S. imports from China totaled 820,329 TEUs in September, down 22.7% year on year and 18.3% versus August. Declines from China accounted for 61.5% of last month’s drop compared to the month before.
“If you think about the lockdowns in China, some of those things have now had a chance to flush themselves out and you now see that in the numbers,” said Jones, noting the lag effect between the lockdowns and the import decline. “These Chinese numbers are way down.”
Commenting on the timing of the September plunge, Jones pointed to multiple lag effects between initial demand weakness and import data weakness, ranging from lags on the origin side to those at America’s ship queues. “Imports are a completely lagging indicator because of the lead times,” he emphasized. “These supply chains are so extended.”

Supply chain crunch not over yet
Declining import volumes should give terminals breathing room to clear out more containers from their yards in the months ahead. Even so, Jones agreed that “it’s too soon to declare victory” when it comes to the supply chain crunch.
Imports and consumer spending are still above pre-pandemic levels. Rail congestion remains high. Both import and empty container levels at terminals remain elevated.
As of Monday morning, there were still 103 container ships waiting offshore of North American ports. Waiting times off East and Gulf Coast ports remained over 10 days in September, according to Descartes. Meanwhile, there has yet to be a breakthrough in the West Coast port labor negotiations and the new rail labor contract still requires approval. (One union has just rejected the proposal.)
The complexity of the situation makes it very difficult for U.S. retailers and importers to plan ahead. “There’s too much and not enough,” said Jones. “Things like personal gaming systems come in the door and they’re out the door, while you have seasonal [goods] where you just get crushed.”
Overall, “consumption has not slowed down as much as people thought,” he continued. Importers “have to make bets and the longer the lead time [due to supply chain delays] the less accurate” those bets turn out. As a result, he said, “we’ll see some cases where too much inventory shows up and others where you can’t get enough of what you need.”
October 11, 2022
Imports Slow
US imports sink in September, suffer steepest drop since 2020 lockdowns
Descartes: September imports down 11% year on year and 12.4% vs. August
Greg Miller Follow on Twitter Monday, October 10, 2022
4 minutes read
First came the pullback in spot shipping rates from their historic peak. Then came reports of plunging Asian bookings and mass retail order cancellations, with spot rates falling even faster. Now, all of this is finally showing up at America’s ports.
According to Descartes, which aggregates U.S. Customs data, inbound volumes to all U.S. ports totaled 2,215,731 twenty-foot equivalent units in September. That’s down 11% year on year and 12.4% from August.
Last month’s imports came in below September 2020 levels, albeit still up 9% from September 2019, pre-COVID. Imports this September were down 15.5% versus May, the month inbound volumes hit an all-time high, according to Descartes data.
To put the severity of last month’s drop in historical perspective, September’s 313,311-TEU decline versus August was the steepest month-to-month drop since the 364,454-TEU plunge in February 2020 versus the month before, back when Chinese authorities first locked down Wuhan.
“We’ve had a pretty significant correction here,” said Chris Jones, executive vice president of industry and services at Descartes Systems Group, in an interview with American Shipper on Monday.
This is normally the time of year when imports seasonally decline — but not by this much. “There was an inflection, and it was a big one,” he said. “In some respects, this is not inconsistent with other years [pre-COVID]. It’s just more severe.”
If the usual seasonal pattern holds true from here, Jones added, imports “should slow down for the rest of the year.”
Imports decline on all three coasts
This summer, overall U.S. imports remained stubbornly high, hovering near record levels even as West Coast volumes declined. West Coast losses were offset by East and Gulf Coast gains, reportedly due to shippers shifting cargoes eastward due to fears of West Coast peak season congestion and labor unrest.
The pattern changed last month. Ports on all three coasts saw volumes drop versus August, according to Descartes. Most surprisingly, it found that imports fell 21.5% in Savannah, Georgia, from 285,341 TEUs to 223,966 TEUs.
Savannah, along with New York/New Jersey, has been one of the big winners of the eastward shift. Savannah posted record imports in August. It has had the country’s longest queue of waiting ships for months. As of Monday, ship-position data showed 35 ships still waiting. The presence of so many vessels offshore confirms there is no shortage of cargo waiting to be unloaded in Savannah, so how could its import numbers fall so steeply in September?
The answer appears to be: Hurricane Ian. A spokesperson for the Georgia Ports Authority (GPA) told American Shipper: “September volume was impacted due to Hurricane Ian and the suspension of vessel service for roughly three days. GPA has since been accommodating that volume, which will be reflected in October numbers.”
However, the one-off hurricane effect doesn’t change the overall story on U.S. imports. Even with Savannah’s September decline removed from the numbers, countrywide imports fell 11% versus August.
Volumes from China collapsing
The big driver of declines on all three coasts: collapsing imports from China.
According to Descartes, U.S. imports from China totaled 820,329 TEUs in September, down 22.7% year on year and 18.3% versus August. Declines from China accounted for 61.5% of last month’s drop compared to the month before.
“If you think about the lockdowns in China, some of those things have now had a chance to flush themselves out and you now see that in the numbers,” said Jones, noting the lag effect between the lockdowns and the import decline. “These Chinese numbers are way down.”
Commenting on the timing of the September plunge, Jones pointed to multiple lag effects between initial demand weakness and import data weakness, ranging from lags on the origin side to those at America’s ship queues. “Imports are a completely lagging indicator because of the lead times,” he emphasized. “These supply chains are so extended.”
Supply chain crunch not over yet
Declining import volumes should give terminals breathing room to clear out more containers from their yards in the months ahead. Even so, Jones agreed that “it’s too soon to declare victory” when it comes to the supply chain crunch.
Imports and consumer spending are still above pre-pandemic levels. Rail congestion remains high. Both import and empty container levels at terminals remain elevated.
As of Monday morning, there were still 103 container ships waiting offshore of North American ports. Waiting times off East and Gulf Coast ports remained over 10 days in September, according to Descartes. Meanwhile, there has yet to be a breakthrough in the West Coast port labor negotiations and the new rail labor contract still requires approval. (One union has just rejected the proposal.)
The complexity of the situation makes it very difficult for U.S. retailers and importers to plan ahead. “There’s too much and not enough,” said Jones. “Things like personal gaming systems come in the door and they’re out the door, while you have seasonal [goods] where you just get crushed.”
Overall, “consumption has not slowed down as much as people thought,” he continued. Importers “have to make bets and the longer the lead time [due to supply chain delays] the less accurate” those bets turn out. As a result, he said, “we’ll see some cases where too much inventory shows up and others where you can’t get enough of what you need.”
October 6, 2022
Freight Rates
If supply chain crunch is finally easing, why is inflation so high?
Fed supply chain pressure index headed in opposite direction of inflation
Greg Miller Follow on Twitter Sunday, October 2, 2022
4 minutes read

Listen to this article
0:00 / 6:01BeyondWords
Remember back in 2021 when inflation was “transitory” and surging consumer prices were blamed on the supply chain crisis? The Fed and macro investors became intensely interested in chaos at the ports. The focus on bottlenecks spurred the Federal Reserve Bank of New York to create a new barometer called the Global Supply Chain Pressure Index (GSCPI) in January.
The implication was that if supply chain pressure reduced, inflation would ease. It hasn’t worked out that way.
The GSCPI (data here), which roughly tracked inflation trends in 2021, has fallen sharply in 2022. The monthly measure has plunged 66% from its peak, from 4.31 standard deviations above average in December to 1.47 standard deviations above average in August.
The monthly U.S. inflation measure (headline Consumer Price Index) has gone in the opposite direction over the same period, up 17%, from 7.04% (year-over-year increase) in December to 8.26% last month.

Other supply chain indicators also fall
It’s not just the GSCPI that’s unmoored from inflation.
Flexport created a measure of supply chain pressures called the Ocean Timeliness Indicator (OTI). The OTI measures the average number of days cargo takes from the time it leaves a factory in Asia to the time it exits the terminal gates in the U.S. or Europe.
The curve of the trans-Pacific eastbound OTI roughly mirrors the GSCPI. After peaking at 113 days in the week ending on Jan. 23, it fell 24% to 86 days on the week ending on Sept. 25.

Spot freight rate indexes have likewise trended in the opposite direction from inflation in 2022. The weekly Drewry World Container Index peaked at $10,377 per forty-foot equivalent units (excluding premiums) in the week ending on Sept. 23, 2021. It has since fallen 61% to $4,014 per FEU.

Yet another example: Container bookings have followed a similar downward slope as the GSCPI, OTI and Drewry World Container Index. FreightWaves SONAR’s Container Atlas features a proprietary index of bookings based on scheduled date of departure to the U.S. This index saw a sharp decline starting in May. Between its late April high and Sunday, it has fallen 35%.

Why hasn’t supply chain easing helped inflation?
Unlike in late 2021, when retail execs on conference calls talked about import delays and marking up goods to pass along surging freight costs, they’re now talking about having too much inventory in warehouses and discounting goods to clear the excess.
If the supply chain crunch was such a major driver of inflation, why are so many indicators pointing to an easing of supply chain pressures at the same time inflation remains exceptionally high?
One theory is that the supply chain was at least something of a red herring. Another is that supply chain pressures are indeed easing, but they’re still way above pre-COVID levels. In other words, the supply chain crunch is not over yet, so the positive payoff for inflation is yet to come.
The GSCPI, while down sharply from its peak, is still almost six times higher than it was in 2017-19. Flexport’s OTI is still more than double its pre-COVID level.
The Drewry World Container Index is currently three times higher than it was at this time of year in 2019. The FreightWaves SONAR Container Atlas Ocean TEU index for US-bound cargoes is currently 35% higher than it was at this time in 2019.
Meanwhile, U.S. imports remain near all-time highs and have yet to materially fall. According to Descartes, U.S. imports in August were flat versus July and up 18% versus August 2019, pre-COVID. Customs data on FreightWaves SONAR shows that September imports were very close to September 2021 levels.
Ship-position data and queuing lists showed 109 container vessels waiting off U.S. ports as of Sunday. That’s down from a high of over 150, but still far above the pre-COVID normal in the single digits.
Signs of hope but supply chain crunch not over
Flexport addressed the status of the supply chain squeeze in a presentation on Thursday. The consensus: Yes, it’s winding down, but it’s too soon to declare victory.
Flexport Chief Economist Phil Levy highlighted the role of the supply chain crunch in public policy. “It has fed into a lot of macroeconomic policy and into what the Fed has been doing. To the extent one thought supply chain problems would get fixed, that was part of the rationale for calling [inflation] transitory.”
On a positive note, Levy pointed to the drop in the cargo transit times measured by the OTI. “If you look at the [historical] pattern, it gets better around late spring and early summer and then in late summer, it starts to get worse. We saw that in 2020 and in 2021. We waited to see that in 2022 and it didn’t happen. To me, that’s notable. I would put that down as a sign of hope.”
On the other hand, Levy noted that U.S. consumer spending on durable goods continues to be surprisingly strong. “Durable consumption is down from the peak in the spring, but we’re still consuming 20% more durables [than pre-pandemic]. And nondurables are not even that far off the peak. So, we have not seen a big consumption drop-off. There’s still a lot of demand out there.”
October 6, 2022
Freight Rates
If supply chain crunch is finally easing, why is inflation so high?
Fed supply chain pressure index headed in opposite direction of inflation
Greg Miller Follow on Twitter Sunday, October 2, 2022
4 minutes read
Listen to this article
0:00 / 6:01BeyondWords
Remember back in 2021 when inflation was “transitory” and surging consumer prices were blamed on the supply chain crisis? The Fed and macro investors became intensely interested in chaos at the ports. The focus on bottlenecks spurred the Federal Reserve Bank of New York to create a new barometer called the Global Supply Chain Pressure Index (GSCPI) in January.
The implication was that if supply chain pressure reduced, inflation would ease. It hasn’t worked out that way.
The GSCPI (data here), which roughly tracked inflation trends in 2021, has fallen sharply in 2022. The monthly measure has plunged 66% from its peak, from 4.31 standard deviations above average in December to 1.47 standard deviations above average in August.
The monthly U.S. inflation measure (headline Consumer Price Index) has gone in the opposite direction over the same period, up 17%, from 7.04% (year-over-year increase) in December to 8.26% last month.
Other supply chain indicators also fall
It’s not just the GSCPI that’s unmoored from inflation.
Flexport created a measure of supply chain pressures called the Ocean Timeliness Indicator (OTI). The OTI measures the average number of days cargo takes from the time it leaves a factory in Asia to the time it exits the terminal gates in the U.S. or Europe.
The curve of the trans-Pacific eastbound OTI roughly mirrors the GSCPI. After peaking at 113 days in the week ending on Jan. 23, it fell 24% to 86 days on the week ending on Sept. 25.
Spot freight rate indexes have likewise trended in the opposite direction from inflation in 2022. The weekly Drewry World Container Index peaked at $10,377 per forty-foot equivalent units (excluding premiums) in the week ending on Sept. 23, 2021. It has since fallen 61% to $4,014 per FEU.
Yet another example: Container bookings have followed a similar downward slope as the GSCPI, OTI and Drewry World Container Index. FreightWaves SONAR’s Container Atlas features a proprietary index of bookings based on scheduled date of departure to the U.S. This index saw a sharp decline starting in May. Between its late April high and Sunday, it has fallen 35%.
Why hasn’t supply chain easing helped inflation?
Unlike in late 2021, when retail execs on conference calls talked about import delays and marking up goods to pass along surging freight costs, they’re now talking about having too much inventory in warehouses and discounting goods to clear the excess.
If the supply chain crunch was such a major driver of inflation, why are so many indicators pointing to an easing of supply chain pressures at the same time inflation remains exceptionally high?
One theory is that the supply chain was at least something of a red herring. Another is that supply chain pressures are indeed easing, but they’re still way above pre-COVID levels. In other words, the supply chain crunch is not over yet, so the positive payoff for inflation is yet to come.
The GSCPI, while down sharply from its peak, is still almost six times higher than it was in 2017-19. Flexport’s OTI is still more than double its pre-COVID level.
The Drewry World Container Index is currently three times higher than it was at this time of year in 2019. The FreightWaves SONAR Container Atlas Ocean TEU index for US-bound cargoes is currently 35% higher than it was at this time in 2019.
Meanwhile, U.S. imports remain near all-time highs and have yet to materially fall. According to Descartes, U.S. imports in August were flat versus July and up 18% versus August 2019, pre-COVID. Customs data on FreightWaves SONAR shows that September imports were very close to September 2021 levels.
Ship-position data and queuing lists showed 109 container vessels waiting off U.S. ports as of Sunday. That’s down from a high of over 150, but still far above the pre-COVID normal in the single digits.
Signs of hope but supply chain crunch not over
Flexport addressed the status of the supply chain squeeze in a presentation on Thursday. The consensus: Yes, it’s winding down, but it’s too soon to declare victory.
Flexport Chief Economist Phil Levy highlighted the role of the supply chain crunch in public policy. “It has fed into a lot of macroeconomic policy and into what the Fed has been doing. To the extent one thought supply chain problems would get fixed, that was part of the rationale for calling [inflation] transitory.”
On a positive note, Levy pointed to the drop in the cargo transit times measured by the OTI. “If you look at the [historical] pattern, it gets better around late spring and early summer and then in late summer, it starts to get worse. We saw that in 2020 and in 2021. We waited to see that in 2022 and it didn’t happen. To me, that’s notable. I would put that down as a sign of hope.”
On the other hand, Levy noted that U.S. consumer spending on durable goods continues to be surprisingly strong. “Durable consumption is down from the peak in the spring, but we’re still consuming 20% more durables [than pre-pandemic]. And nondurables are not even that far off the peak. So, we have not seen a big consumption drop-off. There’s still a lot of demand out there.”
September 30, 2022
European Inflation
Red-Hot European Inflation Hits A New Record, Rising By Double Digits For The First Time
by Tyler Durden
Friday, Sep 30, 2022 – 07:40 AM
Another month, another red hot inflation print in Europe.
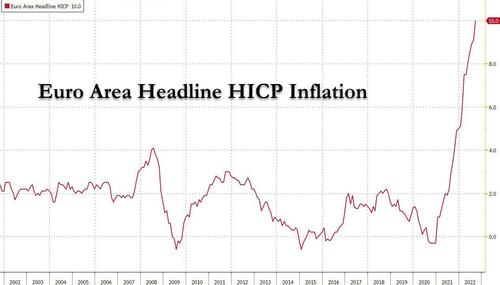
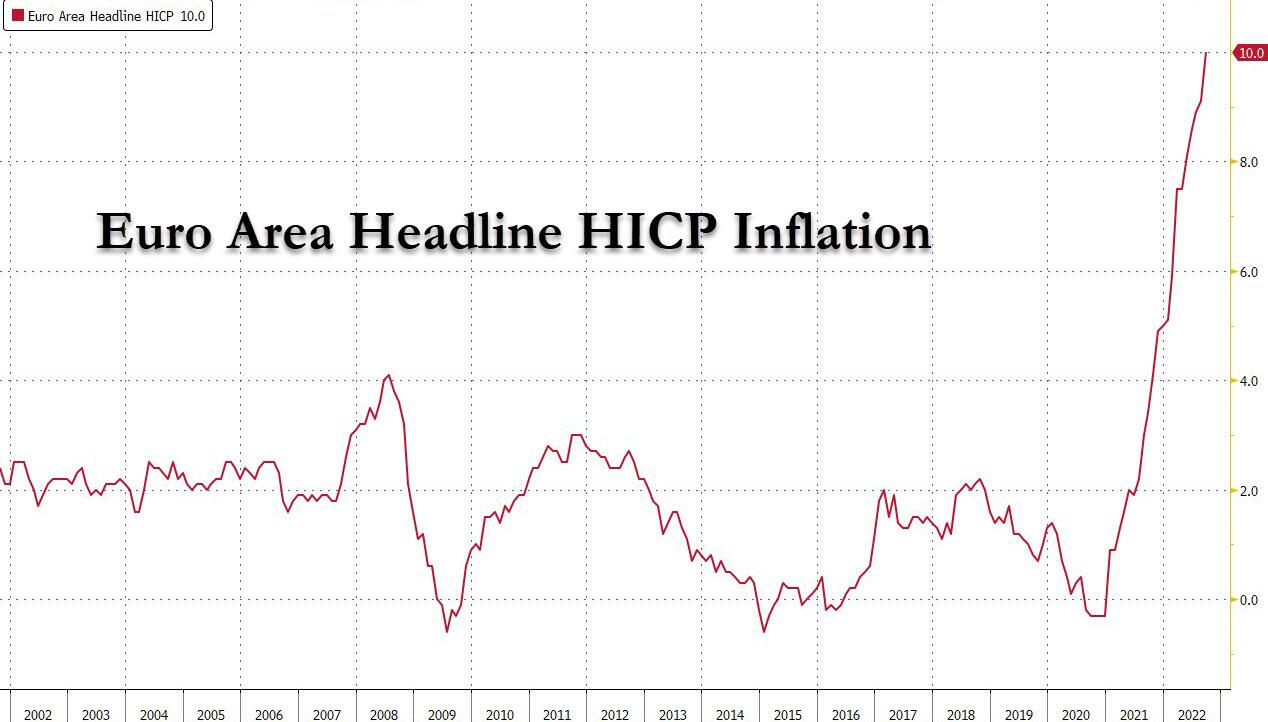
In the flash inflation release for September, Euro area headline HICP inflation rose 82bp to a record 10.0% (technically 9.96%), well above the median forecast of 9.7% and marks the fifth straight month the result has exceeded consensus. Before the inflation data, every one of the 40 economists surveyed by Bloomberg predicted a record outcome this month, with four reckoning on 10%.
While energy and food once again drove inflation, an underlying measure that excludes them also topped estimates to reach an all-time high of 4.8%, above expectations of 4.70%, and piling pressure on the European Central Bank to keep raising interest rates aggressively.
Here are the key flash numbers for September:
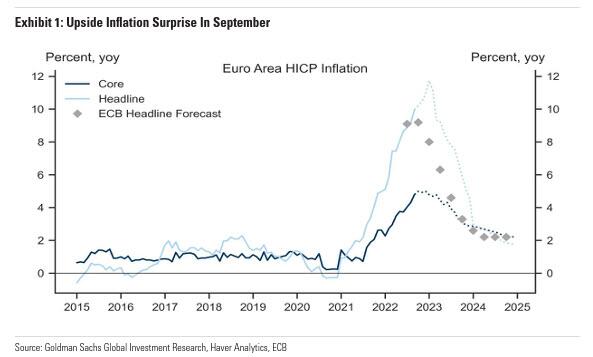
- Euro area Core HICP: 4.79% Y/Y vs. consensus 4.7%, last 4.3%
- Euro area Headline HICP: 9.96% Y/Y vs. consensus 9.7%, last 9.14%
- France Headline HICP: 6.23% vs consensus 6.6%, last 6.56%
- Italy Headline HICP: 9.46% vs consensus 9.4%, last 9.11%
Main points:
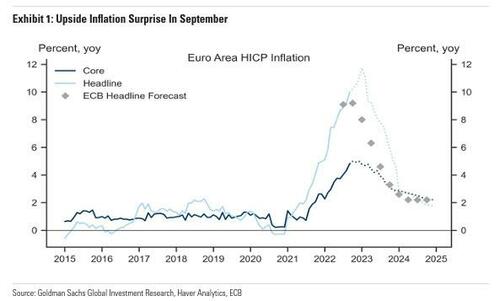
- Euro area headline HICP inflation rose 82bp in September to 9.96%yoy, above expectations. Core HICP inflation, excluding energy, food, alcohol and tobacco, rose 49bp to 4.79%yoy, also above expectations.
- The breakdown by main expenditure categories showed services inflation rose five-tenths of a percentage point to 4.3%yoy, and non-energy industrial goods inflation rose 0.5pp to 5.6%yoy. Of the non-core components, energy inflation rose 2.2pp to 40.8%yoy, while food, alcohol and tobacco inflation rose 1.2pp to 11.8%yoy.
- In a separate release , French HICP headline inflation was 6.2%yoy in September, below consensus expectations. The press release notes a more marked seasonal downturn in travel-related prices as one of the drivers of the decline in inflation in September. In Italy, headline inflation surprised to the upside at 9.5%yoy, and the press release notes strength in non-durable and semi-durable goods, and food prices as the primary drivers of the increase.
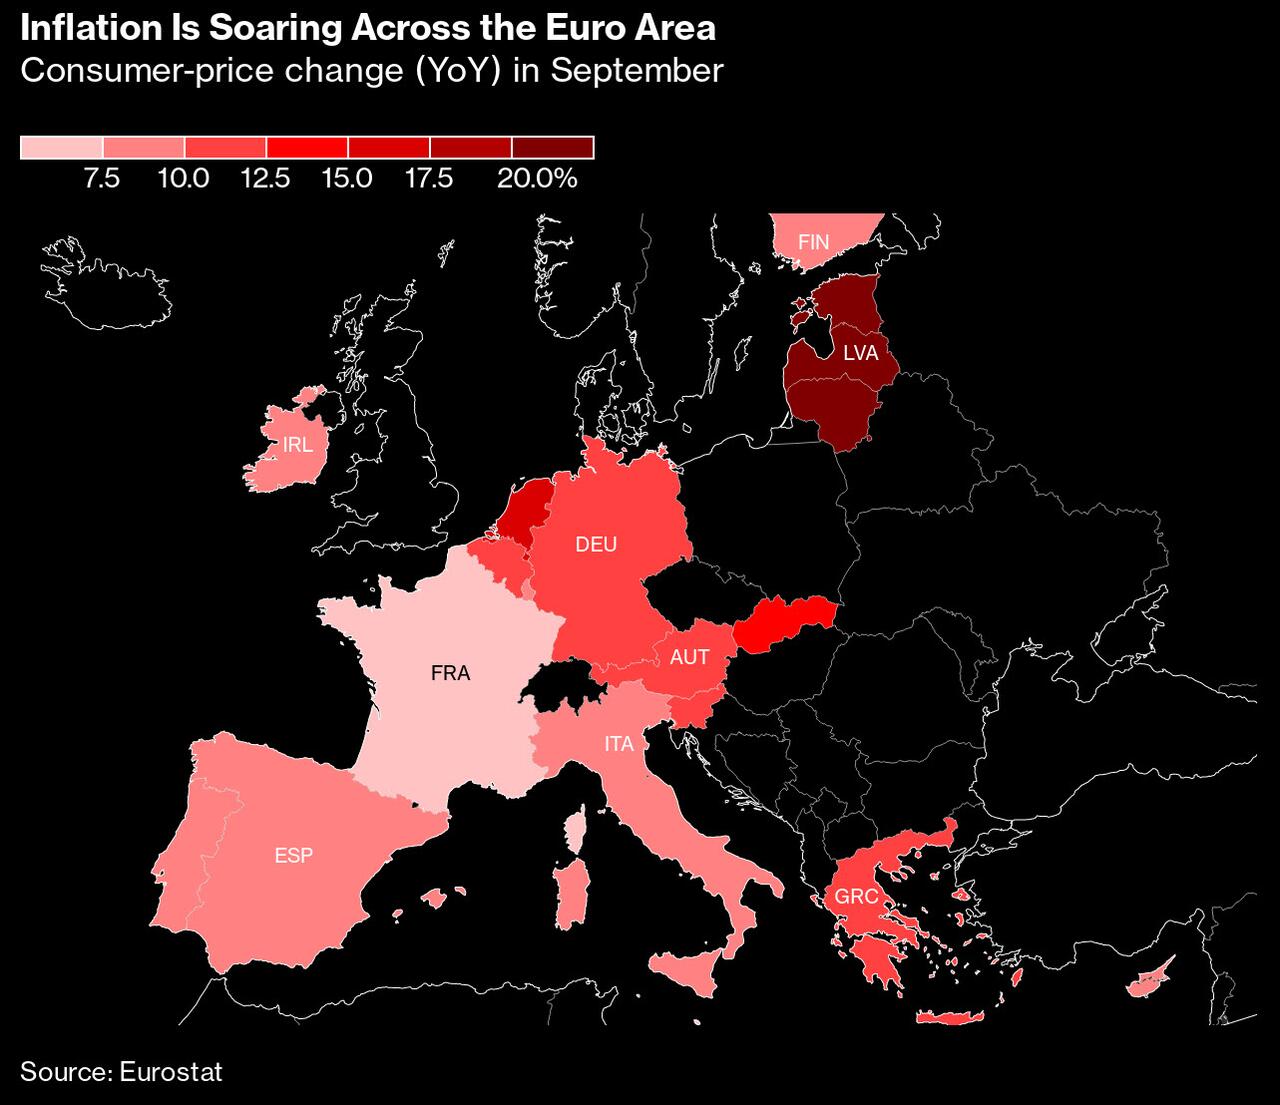
The actual result masked considerable divergence across the euro region. In Germany, Europe’s biggest economy, price growth surged much more than expected. The end of summer discounts on public transport and fuel helped drive a gain there to 10.9%, the highest headline rate seen in the Group-of-Seven industrialized economies since the energy crisis struck. Italy, the Netherlands and Belgium saw significant accelerations too. By contrast, price growth unexpectedly slowed in France and weakened much more than expected in Spain.

Europe’s inflation data have proven critical in driving momentum toward large rate hikes in previous months, and this result is likely to embolden calls for another large move at the next ECB decision on Oct. 27. Investors this week began pricing in a second straight 75 basis-point increase.
“The next step still has to be big because we are still far away from rates that are consistent with 2% inflation,” ECB Governing Council member Martins Kazaks, said Wednesday in an interview in Vilnius, Lithuania, where price growth was 22.5%. “I would side with 75 basis points.”
While officials ramped up their aggression with a move of that size on Sept. 8, they’ve also sought to differentiate the euro zone’s experience with that of the US, insisting that inflation in their own region is far more supply-driven than the demand-propelled consumer-price situation across the Atlantic.
Even so, Bloomberg notes that policy makers will be nervous at yet another record reading. Boris Vujcic, the Croatian central-bank governor who will join the ECB Governing Council in January, warned in an interview published this week that “when inflation is high, when it nears double-digit levels, it can become a disease in itself.”
With Russia starving Europe of gas supplies and winter approaching, policy makers are bracing for an even more difficult few months. Price increases may yet accelerate further in some countries, while recessions are becoming increasingly likely.
The latest OECD forecasts chime with that view. Officials on Monday raised their projection for euro-zone inflation next year by 1.6 percentage points to 6.2%, noticeably exceeding the ECB’s own outlook. Hours later, ECB President Christine Lagarde reiterated that her officials also see the danger of a higher outcome.
“The risks to the inflation outlook are primarily on the upside, mainly reflecting the possibility of further major disruptions in energy supplies,” she told lawmakers. “We expect to raise interest rates further over the next several meetings to dampen demand and guard against the risk of a persistent upward shift in inflation expectations.”
A relatively tight labor market may intensify such pressures. A separate report from Eurostat showed euro-zone unemployment held at a record-low 6.6% in August.
Looking ahead, Goldman now expects Euro area core inflation to peak at 5.0%yoy in December, and looks for headline inflation close to peak at 11.7%yoy in January.
https://www.zerohedge.com/economics/red-hot-european-inflation-hits-new-record-rising-double-digits-first-time