
Current Affairs
May 30, 2024
Shipping Costs Surge
Supply Shock: Shipping Container Costs Top $10,000 Amid Red Sea Turmoil Thinning Global Capacity
by Tyler Durden
Thursday, May 30, 2024 – 02:45 AM
A more conventional supply shock is underway – nowhere near the nuclear-level hit by government-enforced lockdowns several years ago. The Israel-Hamas war has led to Iran-backed Houthis freezing the critical maritime chokepoint of the Bab al-Mandab Strait, attacking Western commercial vessels with missiles and drones (the latest incident on Tuesday), and forcing major shipping operators to reroute containerized freight around the Cape of Good Hope, which strains the world’s containerized capacity and has just sent shipping costs surging once again.
Bloomberg reports new data from France-based CMA CGM SA, the world’s third-largest carrier, indicating that the cost of shipping a 40-foot container from Asia to northern Europe jumped to $7k in the second half of June, up from $5k in the first half of the month. Rates ranged from $6k to $6.5k, with premium services approaching $1k.
“With capacity stretched by more than five months of attacks on vessels in the Red Sea, the container shipping industry is scrambling to meet demand that’s picking up in the US and Europe,” Bloomberg said.
Data from Bloomberg shows that Shanghai to Los Angeles, Shanghai to Rotterdam, Shanghai to Genoa, and Shanghai to New York are some of the most critical shipping lanes experiencing a price jump.
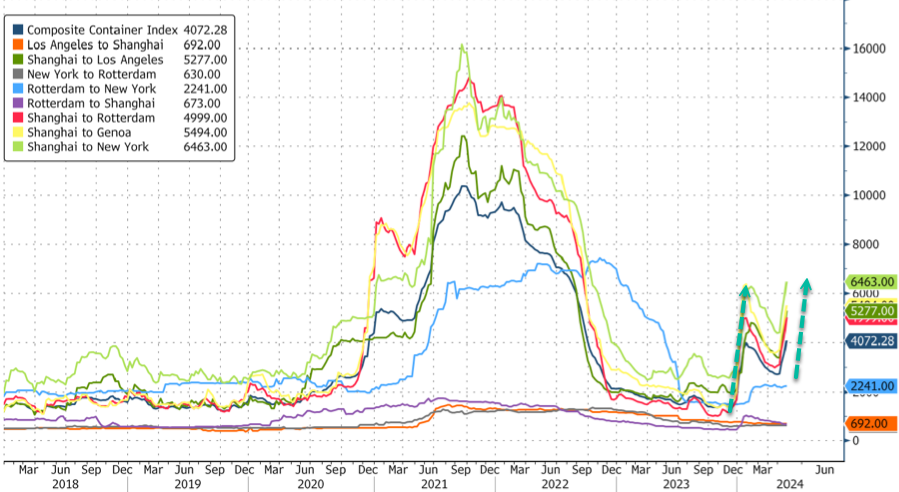
Trine Nielsen, senior director and head of ocean EMEA at Flexport, said companies are “double-booking or increasing booking numbers to secure space” amid thinning capacity.
The chief executive of Germany-based Hapag-Lloyd AG, the world’s number five container carrier, blamed the surge in shipping rates on the continued Red Sea chaos and shrinking capacity, plus “really strong demand.”
There are no forecasts on how long the price surge will last. However, Hapag-Lloyd CEO Rolf Habben Jansen said, “It could still last for another couple of months if the Red Sea situation doesn’t improve.”
News today from Bloomberg says Israel will need at least seven more months to defeat Hamas. This suggests the fight could expand outside of Gaza to either Lebanon or Iran. If that’s the case, expect continued bombardment of ships in critical maritime chokepoints by Houthi rebels – with increasing risks of an oil supply shock that could send Brent crude over $100/bbl.
May 27, 2024
The PPI That Won’t Go Back

May 20, 2024
Furniture Revenue Expected to Increase in 2024
ISM: Economic improvement to continue through 2024
By Larry Adams
May 17, 2024 | 6:28 am CDT

TEMPE, Ariz. — The U.S. economy will continue to softly expand for the rest of 2024, say the nation’s purchasing and supply executives in the Spring 2024 Semiannual Economic Forecast. Expectations for the remainder of 2024 are similar to those expressed in December 2023, despite continued inflation concerns and geopolitical uncertainty.
These projections are part of the forecast issued by the Institute for Supply Management (ISM) Business Survey Committees. The forecast was presented today by Timothy R. Fiore, CPSM, C.P.M., Chair of the ISM Manufacturing Business Survey Committee, and Anthony S. Nieves, CPSM, C.P.M., A.P.P., CFPM, Chair of the ISM Services Business Survey Committee.
According to the report, the Furniture & Related Products category was one of twelve of the 18 industries to report projected revenue increases for the rest of 2024.
In addition, in 2024, the category is:
- one of 12 industries expecting production capacity increases for 2024,
- one of 10 industries expecting capital expenditure increases,
- one of 17 manufacturing industries reporting an increase in prices paid for the first part of 2024, and one of 15 industries expecting price increases for all of 2024,
- and, is one of 12 manufacturing industries expecting increases in revenue in 2024.
The Wood Products category is mentioned only once in the report as one of 10 industries reporting operating capacity levels above the average rate of 82.8 percent.
Here is a truncated version of the ISM report released May 15. For a complete report or more information, visit the Institute of Supply Management. The full text version of each monthly report is posted on www.ismrob.org on the first and third business days of every month after 10:00 a.m. (ET).
Manufacturing Summary
Revenue for 2024 is expected to increase, on average, by 2.1 percent. This is 3.5 percentage points lower than the December 2023 forecast of 5.6 percent, and 1.2 percentage points higher than the 0.9-percentage point year-over-year increase reported for 2023. Forty-four percent of respondents say that revenues for 2024 will increase, on average, 8.6 percent compared to 2023. Fourteen percent say revenues will decrease (12.3 percent, on average), and 42 percent indicate no change. With an operating rate of 82.8 percent and projected increases in capital expenditures (1 percent), prices paid for raw materials (1.9 percent) and employment (0.3 percent) by the end of 2024, the manufacturing sector continues its comeback from the turmoil that began in 2020. “With 12 manufacturing industries expecting revenue growth in 2024 and nine industries expecting employment growth in 2024, panelists forecast that recovery will continue the rest of the year, albeit somewhat softer than originally expected. Sentiment in each industry was generally consistent with performance reports in the April 2024 Manufacturing ISM Report On Business, as well as the fall Semiannual Economic Forecast conducted in December,” says Fiore.
Twelve of 18 industries report projected revenue increases for the rest of 2024, listed in order: Apparel, Leather & Allied Products; Food, Beverage & Tobacco Products; Transportation Equipment; Computer & Electronic Products; Chemical Products; Nonmetallic Mineral Products; Primary Metals; Textile Mills; Furniture & Related Products; Fabricated Metal Products; Electrical Equipment, Appliances & Components; and Paper Products.
Services Summary
Respondents expect a 2.9-percent net increase in overall revenues, which is 4 percentage points lower than the 6.9-percent increase forecast in December 2023. Thirty-six percent of respondents say that revenues for 2024 will increase, on average, 10.3 percent compared to 2023. Meanwhile, 10 percent expect their revenues to decrease (7.5 percent, on average), and 54 percent indicate no change. “The services sector will continue to grow for the rest of 2024. Services companies are currently operating at 88.6 percent of normal capacity. Supply managers indicate that prices are expected to increase 3.2 percent over the year, reflecting increasing inflation. Employment is projected to increase 0.8 percent. Thirteen industries forecast increased revenues, down from the 16 industries that predicted increases in December 2023,” says Nieves.
Thirteen of 18 industries expect revenue increases in 2024, listed in order: Retail Trade; Mining; Transportation & Warehousing; Other Services; Management of Companies & Support Services; Accommodation & Food Services; Professional, Scientific & Technical Services; Construction; Wholesale Trade; Public Administration; Utilities; Information; and Finance & Insurance.
OPERATING RATE
Manufacturing
Purchasing and supply executives report that their companies are operating, on average, at 82.8 percent of normal capacity, 0.2 percentage point lower than the figure reported in December 2023. The 10 industries reporting operating capacity levels above the average rate of 82.8 percent — listed in order — are: Paper Products; Textile Mills; Petroleum & Coal Products; Transportation Equipment; Computer & Electronic Products; Wood Products; Machinery; Primary Metals; Food, Beverage & Tobacco Products; and Fabricated Metal Products.
Services
Organizations are operating, on average, at 88.6 percent of normal capacity, according to Business Survey Committee respondents. This is 2.1 percentage points higher compared to December 2023. The eight industries operating at capacity levels above the average rate of 88.6 percent — listed in order — are: Educational Services; Other Services; Finance & Insurance; Retail Trade; Utilities; Agriculture, Forestry, Fishing & Hunting; Construction; and Public Administration.
Manufacturing
Production capacity is expected to increase 2.4 percent in 2024; in December, panelists reported an increase of 0.7 percentage point for 2023 and projected an increase of 7.8 percent this year. Thirty percent of respondents expect capacity increases of, on average, 12.6 percent; 7 percent expect decreases of, on average, 19.7 percent; and 62 percent expect no change. The 12 industries expecting production capacity increases for 2024 — listed in order — are: Nonmetallic Mineral Products; Furniture & Related Products; Computer & Electronic Products; Food, Beverage & Tobacco Products; Fabricated Metal Products; Primary Metals; Chemical Products; Plastics & Rubber Products; Petroleum & Coal Products; Transportation Equipment; Electrical Equipment, Appliances & Components; and Paper Products.
Services
The capacity to produce products or provide services in the services sector is expected to increase 2.6 percent in 2024. This compares to an increase of 3.9 percent reported for 2023 and a December projection of a 4.1-percent increase for this year. Sixteen percent of services respondents expect their capacity for 2024 to increase, on average, 17.6 percent, and 2 percent foresee capacity decreasing, on average, 11.2 percent. Eighty-two percent expect no change in capacity. The 14 industries expecting production capacity increases for 2024 — listed in order — are: Retail Trade; Mining; Professional, Scientific & Technical Services; Construction; Transportation & Warehousing; Arts, Entertainment & Recreation; Accommodation & Food Services; Wholesale Trade; Information; Management of Companies & Support Services; Public Administration; Health Care & Social Assistance; Utilities; and Finance & Insurance.
PREDICTED CAPITAL EXPENDITURES — 2024 vs. 2023
Manufacturing
Survey respondents expect a 1-percent increase in capital expenditures in 2024, much lower than the 11.9 percent increase forecast by the panel in December. Twenty-four percent of respondents predict increased (on average, 19.8 percent) capital expenditures in 2024, 14 percent said their capital spending would decrease (on average, 26.2 percent), and 62 percent expect no change. The 10 industries expecting capital expenditure increases for 2024 — listed in order — are: Food, Beverage & Tobacco Products; Furniture & Related Products; Nonmetallic Mineral Products; Primary Metals; Fabricated Metal Products; Petroleum & Coal Products; Chemical Products; Paper Products; Transportation Equipment; and Machinery.
Services
This year, services purchasing and supply executives expect capital expenditures to increase 1.4 percent compared to 2023. The 25 percent of respondents expecting to spend more predict an average increase of 16 percent, 12 percent anticipate an average decrease of 20.8 percent, and 63 percent expect no change in capital expenditures in 2024. The 10 industries expecting an increase in capital expenditures — listed in order — are: Public Administration; Utilities; Retail Trade; Accommodation & Food Services; Mining; Transportation & Warehousing; Professional, Scientific & Technical Services; Educational Services; Construction; and Finance & Insurance.
PRICES — Changes Between End of 2023 and May 2024
Manufacturing
In the December forecast, respondents predicted an increase of 3.2 percent in prices paid during the first four months of 2024; they now report prices increased by 1.6 percent. The 45 percent who say their prices are higher now than at the end of 2023 report an average increase of 5.8 percent, while 17 percent reported lower prices (by 6 percent, on average). The remaining 39 percent indicated no change for the period. Seventeen manufacturing industries reported an increase in prices paid for the first part of 2024, listed in order: Textile Mills; Printing & Related Support Activities; Apparel, Leather & Allied Products; Plastics & Rubber Products; Nonmetallic Mineral Products; Primary Metals; Paper Products; Chemical Products; Computer & Electronic Products; Machinery; Miscellaneous Manufacturing; Fabricated Metal Products; Petroleum & Coal Products; Electrical Equipment, Appliances & Components; Transportation Equipment; Furniture & Related Products; and Food, Beverage & Tobacco Products.
Services
Services respondents report that purchases during the first four months of this year cost an average of 2.3 percent more than at the end of 2023. This is 1.4 percentage points less than the 3.7-percent increase predicted in December. Forty-six percent of services respondents report that prices increased, on average, 6.7 percent; 11 percent report price decreases of, on average, 7.2 percent; and 43 percent indicate no change. Fourteen of 18 industries reported an increase in prices paid in the first part of 2024, listed in order: Public Administration; Management of Companies & Support Services; Utilities; Retail Trade; Professional, Scientific & Technical Services; Transportation & Warehousing; Construction; Educational Services; Finance & Insurance; Health Care & Social Assistance; Wholesale Trade; Arts, Entertainment & Recreation; Other Services; and Information.
PRICES — Predicted Changes Between End of 2023 and End of 2024
Manufacturing
Survey respondents expect a year-over-year, net-average prices increase of 1.9 percent for 2024. With respondents reporting price increases of 1.6 percent through April 2024, prices are projected to increase slightly for the rest of the year. Forty-seven percent of respondents project prices to increase, on average, 6.1 percent for the full year, 20 percent anticipate a decrease (5.2 percent, on average), and 33 percent expect no change. The 15 industries expect price increases for all of 2024, listed in order are: Textile Mills; Apparel, Leather & Allied Products; Primary Metals; Plastics & Rubber Products; Nonmetallic Mineral Products; Chemical Products; Paper Products; Furniture & Related Products; Fabricated Metal Products; Transportation Equipment; Miscellaneous Manufacturing; Petroleum & Coal Products; Computer & Electronic Products; Electrical Equipment, Appliances & Components; and Machinery.
Services
This year, services respondents expect prices to increase, on average, 3.2 percent compared to the end of 2023. With respondents reporting an increase of 2.3 percent through April 2024, prices are projected to increase over the rest of the year. Forty-eight of respondents anticipate increases of, on average, 7.2 percent; 7 percent expect decreases of, on average, 5 percent; and 45 percent do not expect prices to change. Fifteen of 18 industries project price increases for all of 2024, listed in order: Public Administration; Retail Trade; Arts, Entertainment & Recreation; Utilities; Wholesale Trade; Management of Companies & Support Services; Construction; Health Care & Social Assistance; Professional, Scientific & Technical Services; Educational Services; Finance & Insurance; Transportation & Warehousing; Accommodation & Food Services; Information; and Other Services.
EMPLOYMENT
Employment — Predicted Changes Between End of 2023 and End of 2024
Manufacturing
ISM’s Manufacturing Business Survey Committee respondents forecast that sector employment in 2024 will increase 0.3 percentage point year over year. Twenty-three percent of respondents expect employment to be, on average, 7.4 percent higher; 15 percent predict employment to decrease, on average, 8.7 percent; and 62 percent expect employment levels to be unchanged. The nine industries projecting employment growth during 2024 — listed in order — are: Nonmetallic Mineral Products; Food, Beverage & Tobacco Products; Primary Metals; Plastics & Rubber Products; Petroleum & Coal Products; Fabricated Metal Products; Textile Mills; Computer & Electronic Products; and Chemical Products.
Services
Sector employment will increase 0.8 percent in 2024, according to the forecast of ISM’s Services Business Survey Committee respondents. For the remaining months of the year, 25 percent expect employment to increase, on average, 5.2 percent; 8 percent anticipate employment to decrease, on average, 7 percent; and 67 percent expect no change in employment levels. The 13 industries anticipating increases in employment — listed in order — are: Other Services; Retail Trade; Accommodation & Food Services; Mining; Arts, Entertainment & Recreation; Construction; Transportation & Warehousing; Utilities; Public Administration; Health Care & Social Assistance; Wholesale Trade; Real Estate, Rental & Leasing; and Professional, Scientific & Technical Services.
BUSINESS REVENUES
Business Revenues Comparison — 2024 vs. 2023
Manufacturing
Increased revenues are expected this year, as purchasing and supply management executives predict an overall net increase of 2.1 percent compared to 2023. This is 3.5 percentage points lower than the 5.6-percent increase forecast in December, and 1.2 percentage points higher than the 0.9-percentage point year-over-year increase reported for 2023. Forty-four percent of respondents say that revenues for 2024 will increase, on average, 8.6 percent; 14 percent say their revenues will decrease, on average, 12.3 percent; and 42 percent forecast no change. The 12 manufacturing industries expecting increases in revenue in 2024 — listed in order — are: Apparel, Leather & Allied Products; Food, Beverage & Tobacco Products; Transportation Equipment; Computer & Electronic Products; Chemical Products; Nonmetallic Mineral Products; Primary Metals; Textile Mills; Furniture & Related Products; Fabricated Metal Products; Electrical Equipment, Appliances & Components; and Paper Products.
Services
This year, services purchasing and supply management executives predict a net increase of 2.9 percent in sector business revenue compared to 2023. This is 4 percentage points lower than the 6.9-percent increase forecast in December, and 1.3 percentage points lower than the 4.2-percent increase reported for 2023. Thirty-six percent of respondents indicate revenues for 2024 will increase, on average, 10.3 percent; 10 percent say their revenues will decrease, on average, 7.5 percent; and 54 percent expect no change. Thirteen of 18 services industries project revenue increases in 2024, listed in order: Retail Trade; Mining; Transportation & Warehousing; Other Services; Management of Companies & Support Services; Accommodation & Food Services; Professional, Scientific & Technical Services; Construction; Wholesale Trade; Public Administration; Utilities; Information; and Finance & Insurance.
May 13, 2024
Wind Turbine Issues
Thousands of Old Wind Turbine Blades Pile Up in West Texas
Officials in Sweetwater say an out-of-state company has made their town a dump for the seldom-seen trash created by renewable energy.
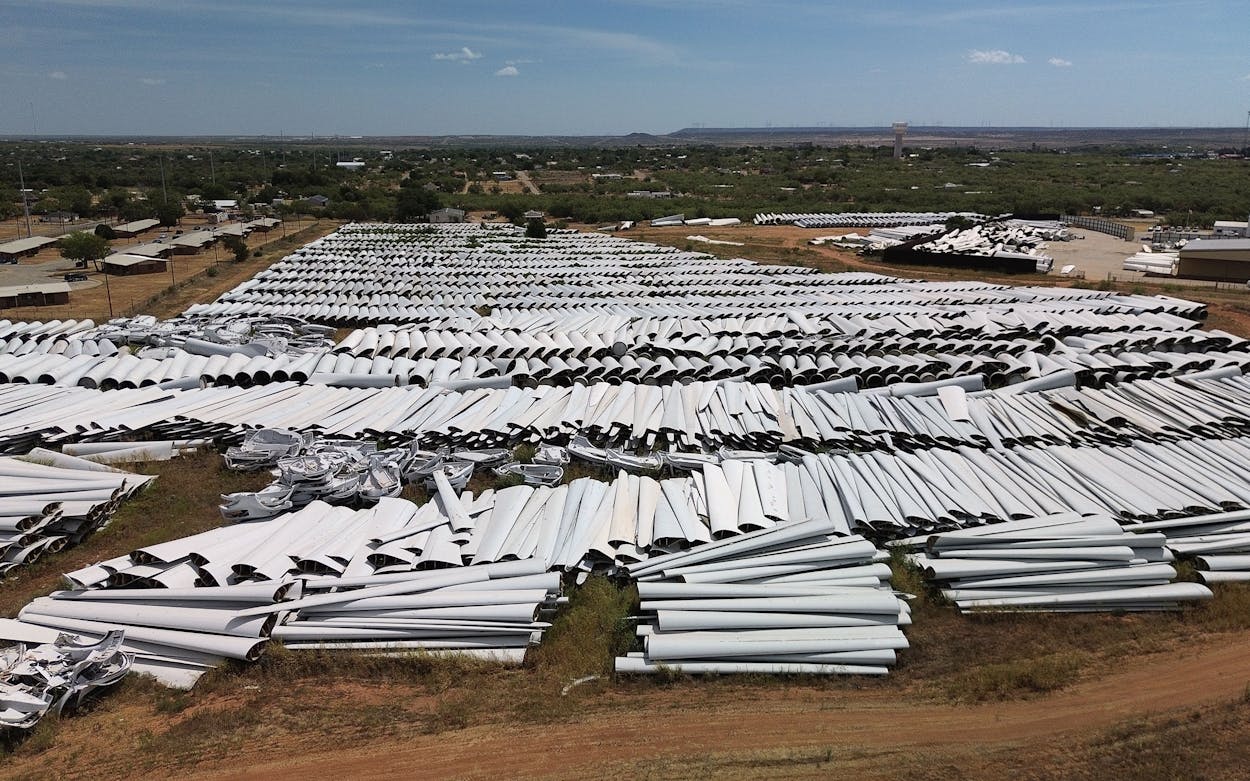
Discarded wind turbine blades fill thirty acres on the west side of Sweetwater.
Update, May 6, 2024: Despite earlier assurances from Global Fiberglass Solutions that they would be removed with months, the blades remain in Sweetwater.
Update, September 25: General Electric filed a lawsuit last week claiming that Global Fiberglass Solutions has failed to fulfill its promise to recycle thousands of blades. GE says it paid the company $16.9 million to recycle about five thousand wind turbine blades, but that GFS instead stockpiled them at facilities in Sweetwater and Iowa. “Only after GFS took millions of dollars from GE, did GFS all but shut down its operations without recycling the Blades,” reads the complaint, filed in U.S. district court in New York.
GE says it later contracted with another company to recycle its blades and is seeking damages to cover these costs as well as reputational damage. Global Fiberglass has not responded to the lawsuit. GE removing its blades from Sweetwater wouldn’t clean up the giant dump; blades manufactured by other companies would still remain.
Every year since 1958, the West Texas town of Sweetwater has hosted the World’s Largest Rattlesnake Roundup, which is exactly what it sounds like. Thousands of the venomous ophidians are rooted out of their dens and brought to the Nolan County Coliseum to be gawked at, “milked,” and often beheaded and skinned. It started as a way for the region to rid itself of some of its least-welcome residents. Now community leaders wish they could do the same with several giant piles of scrap that have for too long been left to bake in the sun. But that’s proving to be much trickier than wrangling reptiles.
About forty miles west of Abilene on Interstate 20, Sweetwater has unwittingly become home to what is possibly the world’s largest collection of unwanted wind turbine blades. When forklifts deposited the first of these in a field behind the apartment complex where Pamala Meyer lives, on the west side of town, in 2017, she wasn’t initially bothered. But then the blades—between 150 and 200 feet in length and mostly made of composite materials such as fiberglass with a binding resin—kept coming. Each was cut into thirds, with each segment longer than a school bus. Thousands arrived over several years, eventually blanketing more than thirty acres, in stacks rising as high as basketball backboards. Every few dozen feet, a break among the stacks leads into an industrial hedge maze.
“It’s just a hazard all the way around,” Meyer said. She worries about neighborhood children exploring the unfenced piles and says that stagnant pools of water inside the blades breed swarms of mosquitos. Matt Jackson, who works in a nearby warehouse, has other concerns. The piles create shaded nooks and crannies, perfect for Sweetwater’s unofficial mascot. “It’s just a big rattlesnake farm,” he said.
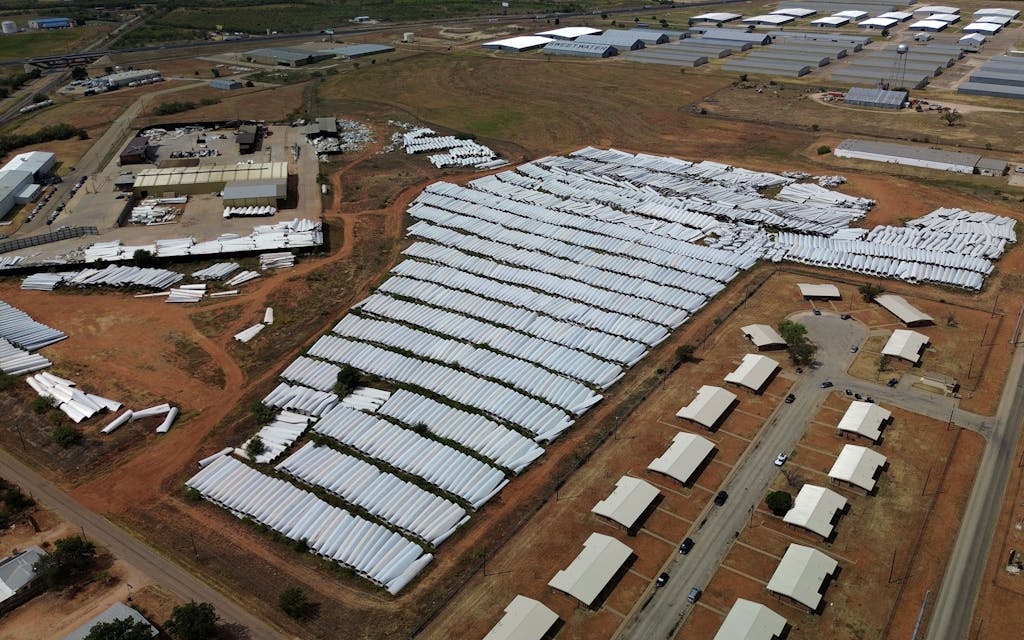
The blades were brought here by Global Fiberglass Solutions, a company based in Washington State that announced in 2017 its intention to recycle blades from wind farms across the region. Instead of ending up in landfills, they would be ground up into a reusable material that could be turned into pallets, railroad ties, or flooring panels. Global Fiberglass is one of a few companies attempting to develop a viable business from recycling blades.
Besides the main boneyard—behind Meyer’s apartment—stacks of blades also occupy ten acres a couple miles south of town, and the company is storing blades in other locations in the county. “They have, in my view, abandoned them there,” said Samantha Morrow, the Nolan County attorney. “The county doesn’t have and cannot find millions of dollars to clean this up.”
The Sweetwater piles are also at least partly the indirect result of a rule clarification the Internal Revenue Service issued in 2016. Before then, a wind farm could collect valuable federal tax credits for only its first ten years of operation. But the IRS determined that it would restart the clock on the credits if a wind farm “repowered” its turbines—replacing most of their equipment with newer parts. So, despite the expected two-decade lifespan for turbine blades, wind farms across Texas and other states began replacing many that remained in good shape years early.
Some paid Global Fiberglass to remove the older blades and haul them away. The company set up shop in an empty industrial facility in Sweetwater that was once an aluminum recycling plant, but Don Lilly, the managing director of Global Fiberglass, told me that only a handful of blades have ever been ground up there. He said the company was close to ramping up and would soon mill the blades into pieces the size of coarse sand. “The blade material is sold,” he said, “but I can’t go into that part yet.”
Sweetwater has heard such pledges before. The county declared the stockpile a public nuisance a year ago. City attorney Jeff Allen said Sweetwater’s local ordinances are aimed at overgrown lots, not turbine blades, leaving the city with limited legal options. He said he believes Global Fiberglass “intended to be a viable business” but at some point “it just came off the rails.” (Lilly disputes this and says the delays have come from ensuring “all systems were engineered.”)
Sweetwater benefits from the wind-energy industry, including two large wind farms nearby. Drivers arriving on I-20 from either direction are welcomed by a giant wind turbine blade painted with the town’s name. But even the community’s biggest boosters of renewable energy long ago ran out of patience with Global Fiberglass’s mess. “We’d like to see them gone,” said Karen Hunt, director of the local chamber of commerce. “The sooner the better.”
Sweetwater isn’t the only place Global Fiberglass has stockpiled blades. It has a total of 1,300 in Newton, Iowa, and two other cities in that state, according to the state’s Department of Natural Resources. After an investigation, the agency concluded in 2021 there was no recycling going on, nor was any likely to happen. It declared the company to be running an unpermitted dump.
Frank Liebl, executive director of the Newton Development Corporation, testified at a state hearing that the initial excitement in 2017 of recruiting a blade-recycling company soon soured. In the intervening years, he asked Global Fiberglass many times when it would begin its recycling. He always got “the same answer: ‘Soon,’ ” he said.
By July 2021, the company owed more than $1 million in unpaid rent in Newton, according to testimony at the Iowa hearing from its landlord’s attorney. In Texas, it failed to pay taxes to Nolan County in 2020 and is now three years in arrears, according to tax records. Last year, the Texas Commission on Environmental Quality fined the company $10,255 for what it described as illegally stored solid waste. It allowed the company to pay the penalty in monthly installments for three years. In June, Global Fiberglass defaulted, according to the commission.
In Newton, pressure from the state of Iowa seems to have worked. Craig Armstrong, a city employee, said that General Electric recently acquired the blades. It’s unclear whether GE purchased them from Global Fiberglass or from the landlord who was owed the $1 million in rent, who may have taken possession of the blades. The city was promised that they would be sent to a recycling center by the end of the year, although none had been removed by mid-August, according to a Newton city official.
Lilly declined to talk about the Iowa blades. He said the situation in Sweetwater is different and insists that Global Fiberglass will grind down and recycle these blades. “If you come back nine months from now, you will not see the material,” he said. We’re marking our calendars and will check back in May.
https://www.texasmonthly.com/news-politics/sweetwater-wind-turbine-blades-dump/
May 13, 2024
April Auto Sales
April 2024 U.S. Auto Sales
By Jerry Reynolds
May 6, 2024

Auto sales for April 2024 are in the books, at least from the automakers that still report sales on a monthly basis. From those car companies, sales were off just slightly, less than 2% from April of 2023. However, the actual picture could be different if we could see all the automakers’ numbers. A spot check of many of our CarPro Certified Dealers showed business was actually quite good last month in new, but most reported used car sales were down from a year ago. This is to be expected with new vehicle inventories peaking, as well as increased factory incentives.
The shining star was Toyota with sales up 15%, on the strength of more hybrid vehicles being available for sale. Hyundai and Kia were off 3% and 4% respectively, and it is a little bit of a mystery as to why. Acura was off 21%, the largest decrease of the reporting car companies.
Note: There was one less selling day in April of 2024 versus April of 2023, and that one day can make a big difference in the numbers. The other big factor was a decrease in fleet sales, something applauded by the new car dealers.
U.S. Auto Sales – April 2024
- Toyota: 183,339 Up 15%
- Ford: 170,302 Down 3%
- Honda: 106,042 Up 3%
- Hyundai: 68,603 Down 3%
- Kia: 65,754 Down 4%
- Subaru: 55,863 Up 10%
- Mazda: 31,251 Down 4%
- Lexus: 28,479 Up 5%
- Acura: 10,544 Down 21%
- Volvo: 10,604 Up 10%
- Lincoln: 8,237 Up 24%
- Genesis: 5,857 Down 6
https://www.chron.com/news/article/april-2024-u-s-auto-sales-19441775.php
 Everchem Updates Archive
  Sign Up for Email Updates