Current Affairs
October 1, 2023
Global Oil Production Overview
These Are The World’s Largest Oil Producers
by Tyler Durden
Saturday, Sep 30, 2023 – 07:35 AM
In 2022 oil prices peaked at more than $100 per barrel, hitting an eight-year high, after a full year of turmoil in the energy markets in the wake of the Russian invasion of Ukraine.
Oil companies doubled their profits and the economies of the biggest oil producers in the world got a major boost.
But which countries are responsible for most of the world’s oil supply? Using data from the Statistical Review of World Energy by the Energy Institute, Visual Capitalist’s Pallavi Rao and Christina Kostandi visualized and ranked the world’s biggest oil producers.
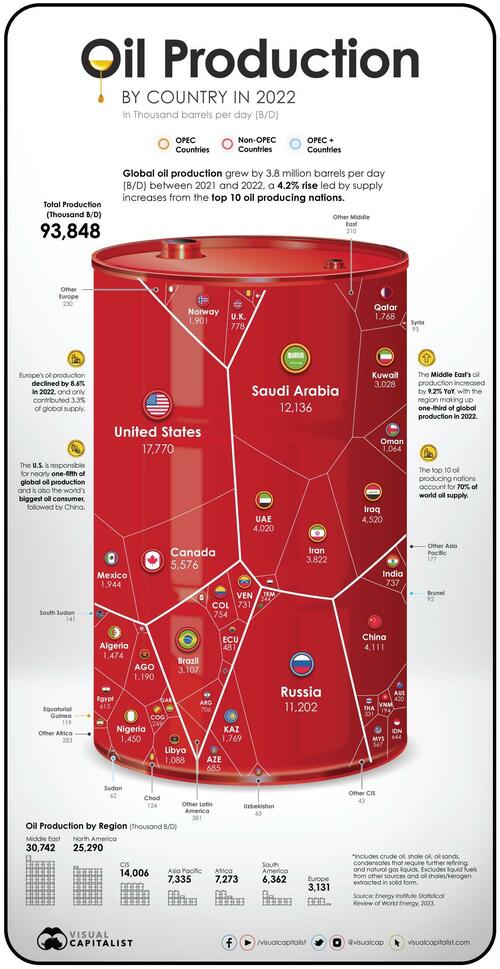
Ranked: Oil Production By Country, in 2022
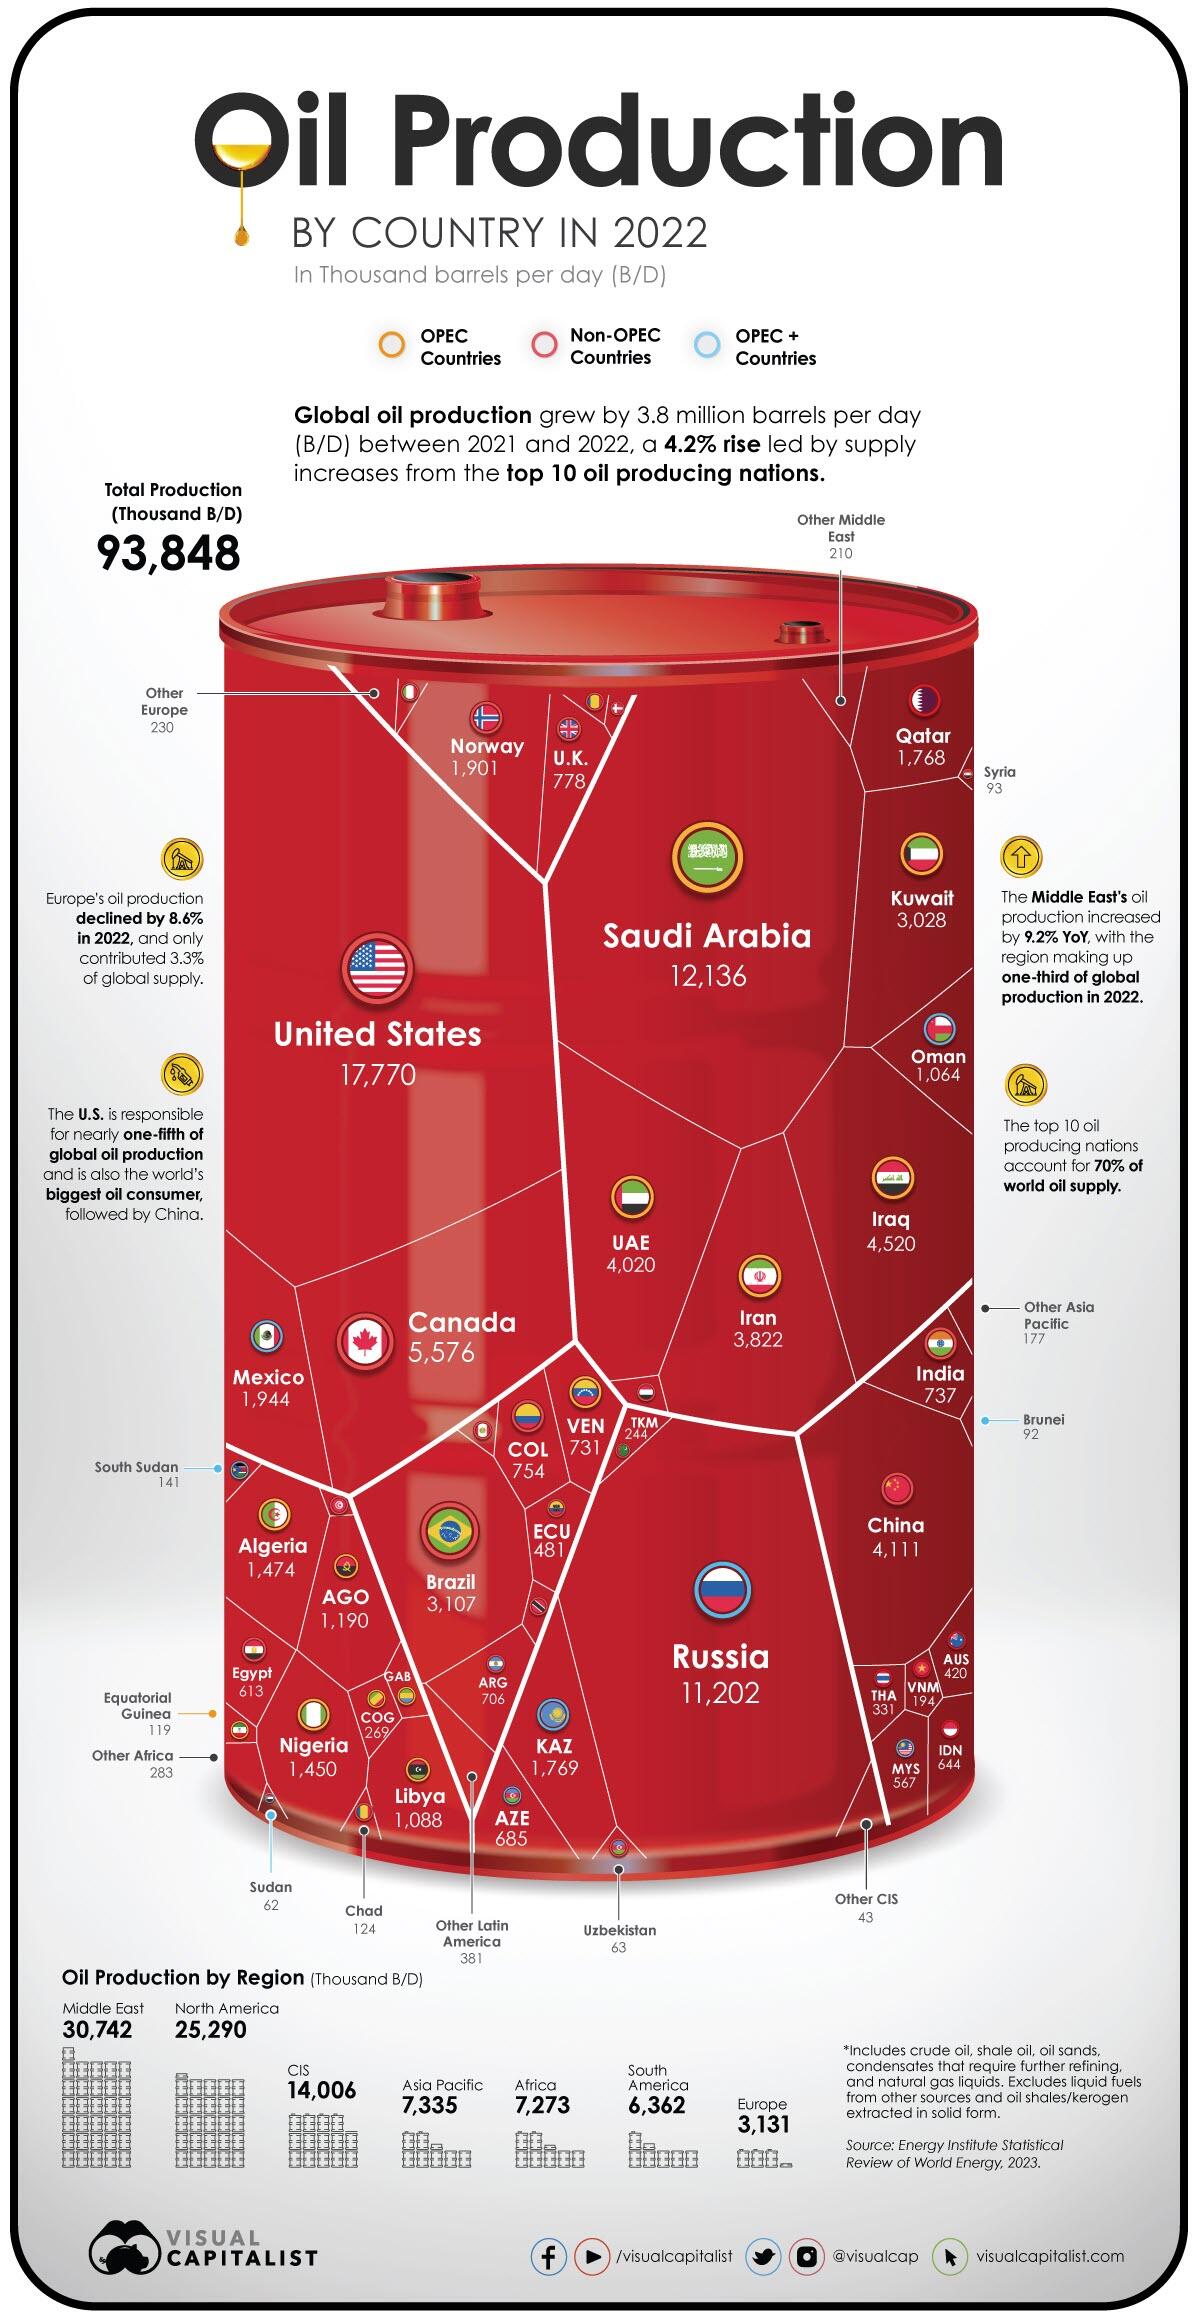
The U.S. has been the world’s biggest oil producer since 2018 and continued its dominance in 2022 by producing close to 18 million barrels per day (B/D). This accounted for nearly one-fifth of the world’s oil supply.
Almost three-fourths of the country’s oil production is centered around five states: Texas, New Mexico, North Dakota, Alaska, and Colorado.
We rank the other major oil producers in the world below.
| Rank | Country | 2022 Production (Thousand B/D) | YoY Change | Share of World Supply |
|---|---|---|---|---|
| 1 | 🇺🇸 U.S. | 17,770 | +6.5% | 18.9% |
| 2 | 🇸🇦 Saudi Arabia | 12,136 | +10.8% | 12.9% |
| 3 | 🇷🇺 Russia | 11,202 | +1.8% | 11.9% |
| 4 | 🇨🇦 Canada | 5,576 | +3.0% | 5.9% |
| 5 | 🇮🇶 Iraq | 4,520 | +10.2% | 4.8% |
| 6 | 🇨🇳 China | 4,111 | +2.9% | 4.4% |
| 7 | 🇦🇪 UAE | 4,020 | +10.4% | 4.3% |
| 8 | 🇮🇷 Iran | 3,822 | +4.6% | 4.1% |
| 9 | 🇧🇷 Brazil | 3,107 | +3.9% | 3.3% |
| 10 | 🇰🇼 Kuwait | 3,028 | +12.0% | 3.2% |
| 11 | 🇲🇽 Mexico | 1,944 | +0.9% | 2.1% |
| 12 | 🇳🇴 Norway | 1,901 | -6.3% | 2.0% |
| 13 | 🇰🇿 Kazakhstan | 1,769 | -2.0% | 1.9% |
| 14 | 🇶🇦 Qatar | 1,768 | +1.8% | 1.9% |
| 15 | 🇩🇿 Algeria | 1,474 | +8.9% | 1.6% |
| 16 | 🇳🇬 Nigeria | 1,450 | -11.2% | 1.5% |
| 17 | 🇦🇴 Angola | 1,190 | +1.1% | 1.3% |
| 18 | 🇱🇾 Libya | 1,088 | -14.3% | 1.2% |
| 19 | 🇴🇲 Oman | 1,064 | +9.6% | 1.1% |
| 20 | 🇬🇧 UK | 778 | -11.0% | 0.8% |
| 21 | 🇨🇴 Colombia | 754 | +2.4% | 0.8% |
| 22 | 🇮🇳 India | 737 | -3.8% | 0.8% |
| 23 | 🇻🇪 Venezuela | 731 | +8.1% | 0.8% |
| 24 | 🇦🇷 Argentina | 706 | +12.4% | 0.8% |
| 25 | 🇦🇿 Azerbaijan | 685 | -5.6% | 0.7% |
| 26 | 🇮🇩 Indonesia | 644 | -6.9% | 0.7% |
| 27 | 🇪🇬 Egypt | 613 | +0.8% | 0.7% |
| 28 | 🇲🇾 Malaysia | 567 | -1.7% | 0.6% |
| 29 | 🇪🇨 Ecuador | 481 | +1.7% | 0.5% |
| 30 | 🇦🇺 Australia | 420 | -5.2% | 0.4% |
| 31 | 🇹🇭 Thailand | 331 | -17.5% | 0.4% |
| 32 | 🇨🇩 Congo | 269 | -1.7% | 0.3% |
| 33 | 🇹🇲 Turkmenistan | 244 | +1.0% | 0.3% |
| 34 | 🇻🇳 Vietnam | 194 | -1.2% | 0.2% |
| 35 | 🇬🇦 Gabon | 191 | +5.4% | 0.2% |
| 36 | 🇸🇸 South Sudan | 141 | -7.6% | 0.2% |
| 37 | 🇵🇪 Peru | 128 | +0.5% | 0.1% |
| 38 | 🇹🇩 Chad | 124 | +6.2% | 0.1% |
| 39 | 🇬🇶 Equatorial Guinea | 119 | -9.2% | 0.1% |
| 40 | 🇸🇾 Syria | 93 | -2.7% | 0.1% |
| 41 | 🇮🇹 Italy | 92 | -7.9% | 0.1% |
| 42 | 🇧🇳 Brunei | 92 | -13.8% | 0.1% |
| 43 | 🇾🇪 Yemen | 81 | -2.4% | 0.1% |
| 44 | 🇹🇹 Trinidad & Tobago | 74 | -3.6% | 0.1% |
| 45 | 🇷🇴 Romania | 65 | -6.2% | 0.1% |
| 46 | 🇩🇰 Denmark | 65 | -1.6% | 0.1% |
| 47 | 🇺🇿 Uzbekistan | 63 | -0.9% | 0.1% |
| 48 | 🇸🇩 Sudan | 62 | -3.3% | 0.1% |
| 49 | 🇹🇳 Tunisia | 40 | -12.9% | 0.0% |
| 50 | Other CIS | 43 | +4.4% | 0.0% |
| 51 | Other Middle East | 210 | +1.2% | 0.2% |
| 52 | Other Africa | 283 | -3.4% | 0.3% |
| 53 | Other Europe | 230 | -20.5% | 0.2% |
| 54 | Other Asia Pacific | 177 | -10.6% | 0.2% |
| 55 | Other S. & Cent. America | 381 | +68.5% | 0.4% |
| Total World | 93,848 | +4.2% | 100.0% |
Behind America’s considerable lead in oil production, Saudi Arabia (ranked 2nd) produced 12 million B/D, accounting for about 13% of global supply.
Russia came in third with 11 million B/D in 2022. Together, these top three oil producing behemoths, along with Canada (4th) and Iraq (5th), make up more than half of the entire world’s oil supply.
Meanwhile, the top 10 oil producers, including those ranked 6th to 10th—China, UAE, Iran, Brazil, and Kuwait—are responsible for more than 70% of the world’s oil production.
Notably, all top 10 oil giants increased their production between 2021–2022, and as a result, global output rose 4.2% year-on-year.
Major Oil Producing Regions in 2022
The Middle East accounts for one-third of global oil production and North America makes up almost another one-third of production. The Commonwealth of Independent States—an organization of post-Soviet Union countries—is another major regional producer of oil, with a 15% share of world production.
| Region | 2022 Production (Thousand B/D) | YoY Change | Share of World Supply |
|---|---|---|---|
| Middle East | 30,743 | +9.2% | 32.8% |
| North America | 25,290 | +5.3% | 27.0% |
| CIS | 14,006 | +0.9% | 14.9% |
| Africa | 7,043 | -3.5% | 7.5% |
| Asia Pacific | 7,273 | -1.4% | 7.8% |
| South & Central America | 6,361 | 7.2% | 6.8% |
| Europe | 3,131 | -8.6% | 3.3% |
What’s starkly apparent in the data however is Europe’s declining share of oil production, now at 3% of the world’s supply. In the last 20 years the EU’s oil output has dropped by more than 50% due to a variety of factors, including stricter environmental regulations and a shift to natural gas.
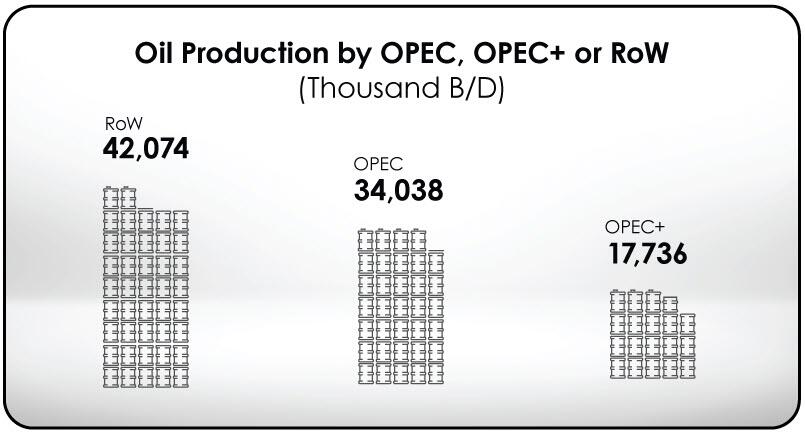
Another lens to look at regional production is through OPEC members, which control about 35% of the world’s oil output and about 70% of the world’s oil reserves.
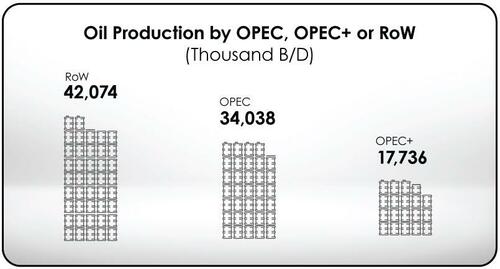
When taking into account the group of 10 oil exporting countries OPEC has relationships with, known as OPEC+, the share of oil production increases to more than half of the world’s supply.
Oil’s Big Balancing Act
Since it’s the very lifeblood of the modern economy, the countries that control significant amounts of oil production also reap immense political and economic benefits. Entire regions have been catapulted into prosperity and wars have been fought over the control of the resource.
At the same time, the ongoing effort to pivot to renewable energy is pushing many major oil exporters to diversify their economies. A notable example is Saudi Arabia, whose sovereign wealth fund has invested in companies like Uber and WeWork.
However, the world still needs oil, as it supplies nearly one-third of global energy demand.
https://www.zerohedge.com/energy/these-are-worlds-largest-oil-producers
September 28, 2023
Shepherd and Everchem
Shepherd’s Exclusive Partnership with Everchem


As a leading global metal chemistry manufacturer, Shepherd relies on key partnerships to help boost product awareness and sales. Everchem is one such partner, deserving not only recognition but gratitude for its commitment to marketing Shepherd’s BiCAT polyurethane catalyst product line to customers in need of catalysts for polyurethanes, spray foam, coatings and more.
Everchem is an exclusive partner for Shepherd’s BiCAT® polyurethane catalyst product line in United States and Canada. The partnership provides downstream customers with access to the broad range of BiCAT® products, an array of packaging options, closer-to-market customer service, and an unmatched level of expertise within the polyurethane market that only Everchem provides.
At its core, Everchem is a sales, marketing, and technology driven company that operates within the North American marketplace. Its core markets served include urethanes, epoxy, UV curing, and industrial chemical raw materials. Everchem prides itself on providing invaluable market intel and superior service which creates mutual benefit and value to customers and suppliers alike. The company’s lean business model and strong supplier relationships increase its responsiveness to customer needs with lower costs and less bureaucracy than many larger organizations can offer.
The Future of BiCAT Polyurethane Catalysts is Bright
Shepherd is considered a market leader when it comes to current and next-generation polyurethane catalysts. It was the first to develop hydrolytically stable bismuth carboxylate chemistry for use in HFO blowing agents, which reduces VOC’s and improves curing rates amongst other enhancements. This technological breakthrough earned Shepherd the 2016 CPI (The Center for The Polyurethanes Industry) Polyurethane Innovation Award.
Shepherd has experienced healthy growth in the sales of its BiCAT® product line through Everchem since our partnership was announced in September 2019. Through this arrangement, BiCAT® products are finding new markets, new customers, and new applications which only enhance the historically strong Shepherd brand.
Our Shared Philosophy
The mutually shared philosophy upon which Everchem and Shepherd respectively and collectively do business is a strategic difference maker when it comes to serving customers. We work together on a platform of transparency, which has yielded fantastic results for both companies since the inception of the partnership.
Everchem a wonderful steward of the Shepherd brand and our confidence in their capability and reliability is second to none. The future only provides additional opportunity for further strengthening of this relationship between the two companies.
If you’re in the market for BiCAT polyurethane catalysts, we’d love to work with you. Please contact us online or by calling 513-731-1110.
www.shepchem.com/news
September 28, 2023
Trucking Update
Trucking sees ‘green shoot’ in August
But capacity growth in private fleets could slow recovery, ACT says
· Wednesday, September 27, 2023

FreightWaves
Trucking sees ‘green shoot’ in August
4 min
A Wednesday report from ACT Research showed the trucking cycle may be “approaching [a] turning point.” All five components of ACT’s For-Hire Trucking Index showed improvement from a carrier’s perspective during August, with volumes logging a large turnaround.
ACT’s volume index jumped 12.3 percentage points to 54.4 on a seasonally adjusted basis from July to August.
A reading above 50 indicates growth while one below 50 implies contraction. The report was quick to caution that the measure is one of breadth, with a large number of fleets seeing an increase but not necessarily a pronounced one.
“So, we wouldn’t suggest this means the freight downturn is over, but it is a considerable ‘green shoot’ that suggests the retail inventory destock is playing out,” said Tim Denoyer, vice president and senior analyst at ACT.
August produced the highest reading for the volume index since early 2022 and a level well above the mid-30s to mid-40s readings displayed throughout the spring. Inventory levels approaching a better balance and a reduction in import declines to the West Coast were cited as contributors.
“Additionally, consumers remain a surprising economic upside, even in the face of sustained high, if moderating, inflation, and are reverting to more goods spending after the service spending boom coming out of the pandemic,” Denoyer said. “Though, still-high inflation and decreasing savings are headwinds to future consumer spending.”
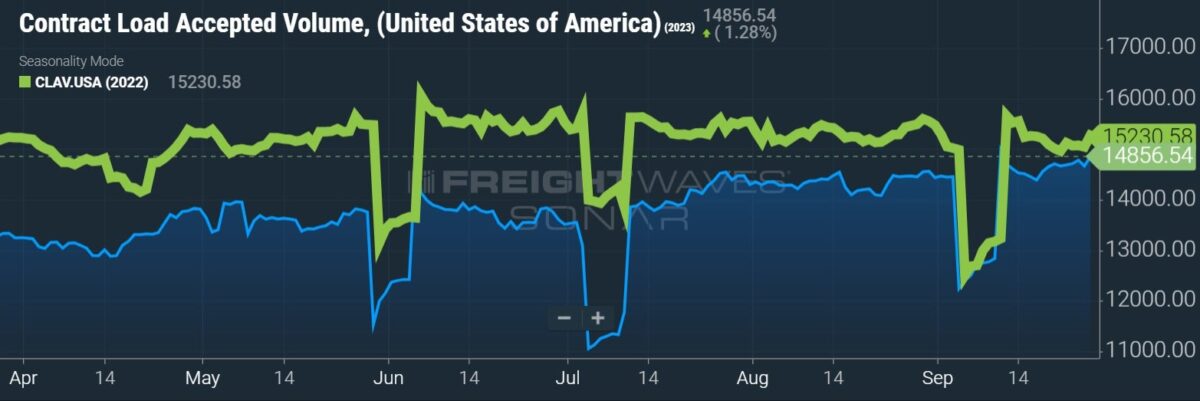
ACT’s capacity index was in modest contraction territory for a second straight month at 48.9. The data set was down one point seasonally adjusted from July.
Those surveyed included mostly large, for-hire fleets. However, the report noted that Class 8 tractor sales remain near all-time highs, which is indicative of capacity being added by private fleets as well as small carriers buying secondhand equipment from larger fleets.
With better volumes and a modest contraction in capacity, the supply-demand balance index jumped 13.4 points to 55.6 in August on a seasonally adjusted comparison. This was the first reading above 50 in 18 months.
Truck pricing remained under pressure during the month at 39.3. The report noted a “less worse” trend as the index improved 2 points from July and continued to improve from the record low of 30.5 in April. ACT expects a soft pricing environment to linger in the near term.
“Though growth in private fleets may be delaying the recovery in rates, the trucking market appears to be past the nadir, and the improved supply/demand balance this month suggests more less worse results to come,” Denoyer said.
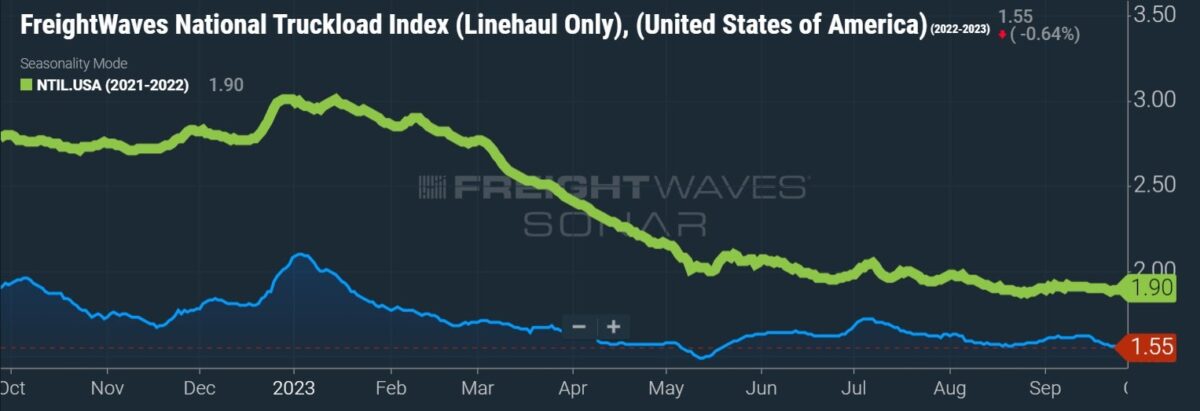
Other findings from the report showed fleet productivity (measured as miles per tractor) increased 6.1 points seasonally adjusted to 53.6 in August. However, 56.4% of survey respondents said they would be buying new equipment in the next three months, which could weigh on the metric. Buying intentions were roughly 7 points below the prior-year level as many of the big, for-hire fleets have largely caught up on their replacement cycles, which were extended during the pandemic.
“We expect fleet ordering intentions to subdue as contract rates are under severe pressure and pent-up demand is fading following capacity constraints the last two years,” Denoyer said.
The driver availability index remained elevated at 59.5 during August. The loosening in the driver labor market was in part credited to spot-market-dependent operators leaving for more stable working conditions at larger fleets.
“Driver availability also remains extraordinarily good for the diverse group of for-hire fleets in our survey,” Denoyer said. “In our view, this probably isn’t enough yet to turn the tide in the spot market, but the market rebalancing is progressing and this should be a good leading indicator of better times ahead.”
September 17, 2023
Advertising and Direct Mail May Take A Hit
IRS Halts Pandemic-Era Small-Business Tax Break Following ‘Flood’ Of Potential Fraud Claims
by Tyler Durden
Sunday, Sep 17, 2023 – 11:40 AM
Authored by Naveen Athrappully via The Epoch Times (emphasis ours),
The Internal Revenue Service (IRS) has announced pausing a small-business tax credit program from the pandemic era for the remainder of the year following worries that ineligible claims are being filed.

The Employee Retention Credit (ERC) was instituted during the COVID-19 pandemic to encourage small businesses to retain their employees on payroll. It offered a refundable tax credit for businesses that paid employees while being shut down due to lockdowns and other restrictions. More than three years later, applications for ERC claims continue to pour in at the agency.
Amid “rising concerns about a flood of improper Employee Retention Credit claims,” the IRS announced an immediate moratorium on the program on Sept. 14 that is valid through “at least the end of the year.”
With the moratorium in effect, it would mean that new claims for ERC would not be processed. However, the agency would continue working on previously submitted ERC claims, it said. Processing times may be longer due to fraud concerns.
The moratorium was ordered by IRS Commissioner Danny Werfel due to worries that third parties or “promoters” were aggressively pressuring ineligible businesses to file for ERC claims. Such third parties can charge hefty fees for services, which can go up to 25 percent of the ERC refund.
Even though promoters advertise that ERC claim-submissions as “risk free,” businesses filing such claims face “significant risks” as the agency increases its audit and criminal investigation into the matter.
According to the IRS, any business that improperly files for ERC claims must pay back the received credit together with potential interest and penalties.
“A business or tax-exempt group could find itself in a much worse financial position if it has to pay back the credit than if the credit was never claimed in the first place,” the IRS stated.
The agency has received around 3.6 million ERC claims over the course of the program, which is roughly a fourth of the total number of U.S. businesses that file tax returns annually.
The IRS has already referred thousands of ERC claims for audit. Hundreds of claims have been referred to the IRS’s Criminal Investigation division which is “actively working to identify fraud and promoters of fraudulent claims for potential referral for prosecution to the Justice Department.”
As of July 31, the division has initiated 252 investigations related to potential ERC claim fraud worth over $2.8 billion.
Out of these 252 cases, 15 have resulted in federal charges. And among the federally charged cases, six have ended in convictions and four have reached the sentencing phase. The average sentencing is 21 months.
“The IRS is increasingly alarmed about honest small-business owners being scammed by unscrupulous actors, and we could no longer tolerate growing evidence of questionable claims pouring in,” Mr. Werfel said.
“The further we get from the pandemic, the further we see the good intentions of this important program abused. The continued aggressive marketing of these schemes is harming well-meaning businesses and delaying the payment of legitimate claims, which makes it harder to run the rest of the tax system. This harms all taxpayers, not just ERC applicants.”
Tax Credits and Fraud
When the program was initially introduced during the pandemic, the tax credit offered to businesses was 50 percent of a qualified employee’s wages, limited to $10,000 per year.
As such, a qualifying business could receive a credit of up to $5,000 per employee per annum. The credit was later updated to 70 percent of wages, limited to $10,000 in wages per quarter.
To qualify for ERC, a business should have shut down due to a government-imposed restriction during 2020 or during the first three quarters of 2021. Businesses that experienced a decline in gross receipts during this period may also qualify. These employers must have paid wages to their employees during the period to claim ERC.
Like the Sept. 14 warning, the IRS had issued a similar alert about ERC fraud back in March. At the time, acting IRS Commissioner Doug O’Donnell advised businesses that “if the tax professional they’re using raises questions about the accuracy of the Employee Retention Credit claim, people should listen to their advice.”
“People need to think twice before claiming this,” he said.
Despite ERC being only applicable to businesses that were shut down or saw a steep decline in revenue during the pandemic, fraudsters entice business owners by claiming that most businesses qualify for the credit.
During an interview an with The Washington Post, Laurel Blatchford, a Treasury Department official, said that the extensive ERC fraud should prompt Congress to consider new legislation to tackle the issue.
An IRS spokesperson said that the agency has paid over $230 billion in ERC claims, which far exceeds the original congressional estimate for the program.
The IRS advised businesses who have not yet filed for their ERC claim to consider reviewing the guidelines and wait to file for the credit.
“The IRS believes many of the applications currently filed are likely ineligible, and tax professionals note anecdotally that they are seeing instances where 95 percent or more of claims coming in recent months are ineligible as promoters continue to aggressively push people to apply regardless of the rules.” the agency said.
September 17, 2023
Mark Cuban Cost Plus Pharmacy
CVS And Cigna Charge $6,000 For $55 Generics
by Tyler Durden
Thursday, Sep 14, 2023 – 10:20 AM
By Mish Shedlock of Mishtalk
Health insurers dramatically mark up prices of generics and pharmacies are in on the scheme.
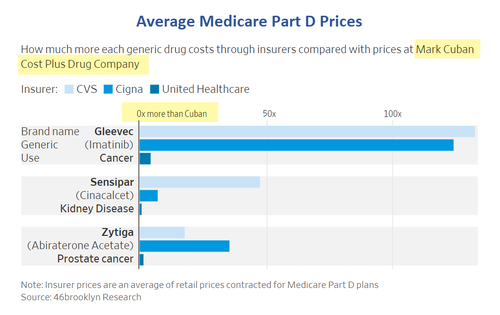
Generic Drugs Should Be Cheap But Sometimes They Aren’t
The Wall Street Journal reports Generic Drugs Should Be Cheap, but Insurers Are Charging Thousands of Dollars for Them
The cancer drug Gleevec went generic in 2016 and can be bought today for as little as $55 a month. But many patients’ insurance plans are paying more than 100 times that.
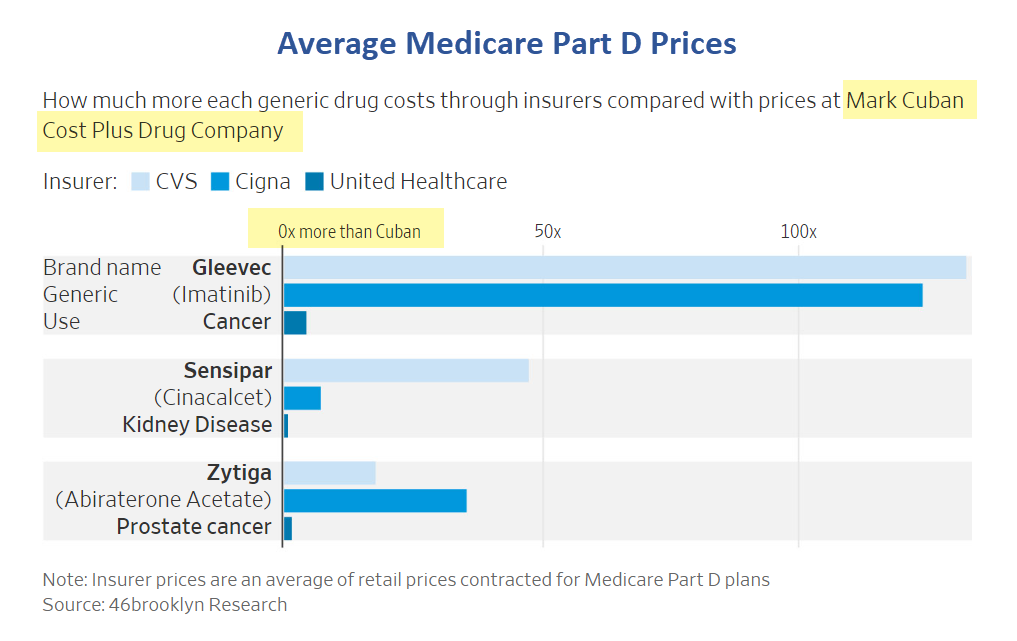
CVS Health and Cigna can charge $6,600 a month or more for Gleevec prescriptions, a Wall Street Journal analysis of pricing data found. They are able to do that because they set the prices with pharmacies, which they sometimes own.
Across a selection of these so-called specialty generic drugs, Cigna and CVS’s prices were at least 24 times higher on average than roughly what the medicines’ manufacturers charge, the Journal found.
The prices at UnitedHealth Group, which also owns a large health insurer, were 3.5 times as much, according to the analysis of data compiled by 46brooklyn Research, a nonprofit drug-pricing analytics group.
Price Gap
- Cigna’s prices were 27.4 times higher than Cuban’s on average for 19 generic drugs.
- CVS’s prices were 24.2 times higher on average for 17 generic drugs.
- UnitedHealth’s prices were 3.5 times higher than Cuban’s on average for 19 generic drugs.
- Cigna can charge roughly $6,610 a month for Gleevec, the Journal’s analysis found. CVS Health can charge more than $7,000 a month. United Health can charge $218.
- A prescription for generic Tecfidera, a multiple-sclerosis therapy, costs $54 a month through the Cuban pharmacy, compared with nearly $1,215 through UnitedHealth. (Cigna and CVS didn’t submit prices for the drug to Medicare.)
- A monthly prescription for prostate-cancer drug Zytiga costs about $118 on Cuban’s website, compared with $4,195 through Cigna, $2,056 through CVS and $205 through UnitedHealth.
Kudos to Mark Cuban for Increasing Competition
On August 22, I wrote Kudos to Mark Cuban for Lower Priced Drugs and Increasing Health Care Competition
Big Win For Consumers
Fortune called it a big win for Cuban. I suggest it’s a big win for everyone.
It also strikes at the heart of precisely what is wrong with Medicare for all and single payer setups. When government picks up the entire tab, there is no incentive for consumers to shop around for better deals.
Those without health care coverage and those on high deductible plans are the biggest winners.
Some of the savings on CostPlus are amazing.
https://www.zerohedge.com/medical/cvs-and-cigna-charge-6000-55-generics
 Everchem Updates Archive
  Sign Up for Email Updates