Current Affairs
June 24, 2022
New Home Sales
New Home Sales Unexpectedly Rebounded In May As Prices Plunged
by Tyler DurdenFriday, Jun 24, 2022 – 10:13 AM
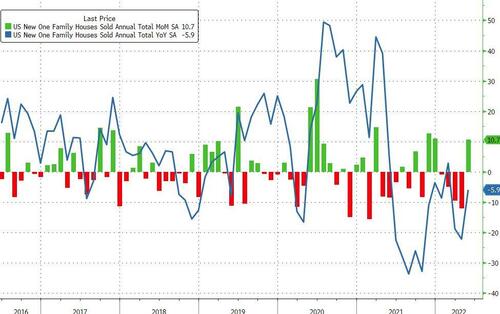
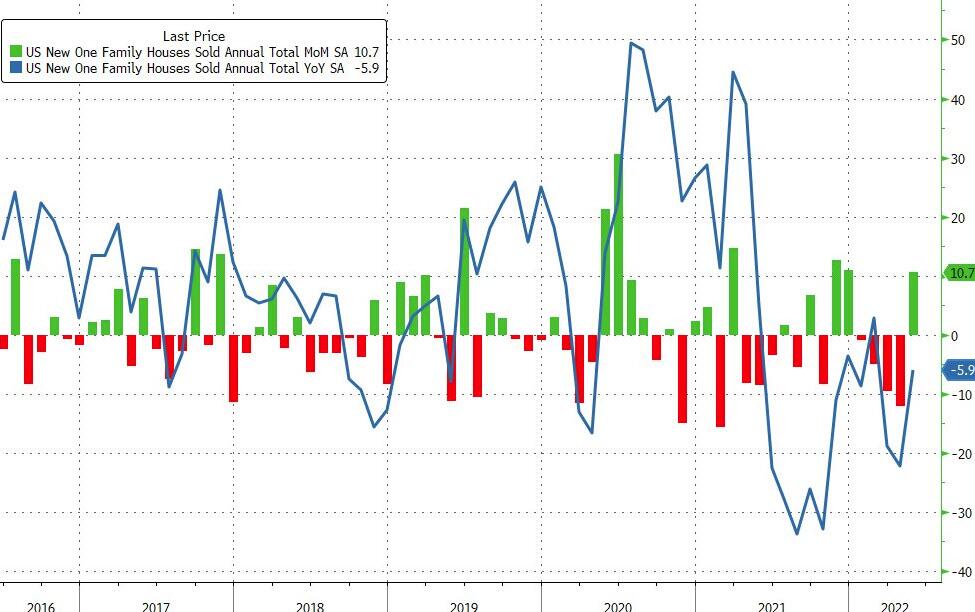
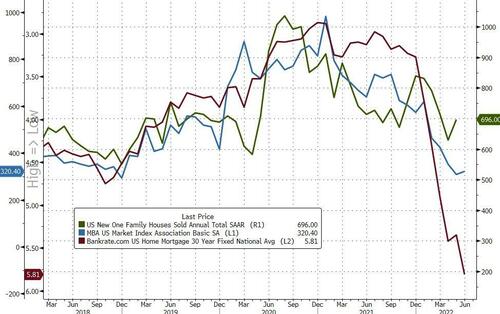
Following the disappointing tumble in existing home sales (to 2 year lows), analysts expect a modest drop in new home sales in May of just 0.2% MoM (after April’s 16.6% MoM plunge). Instead, new home sales spiked 10.7% MoM (from an updwardly revised -12% MoM print in April) – despite soaring mortgage rates…
Source: Bloomberg
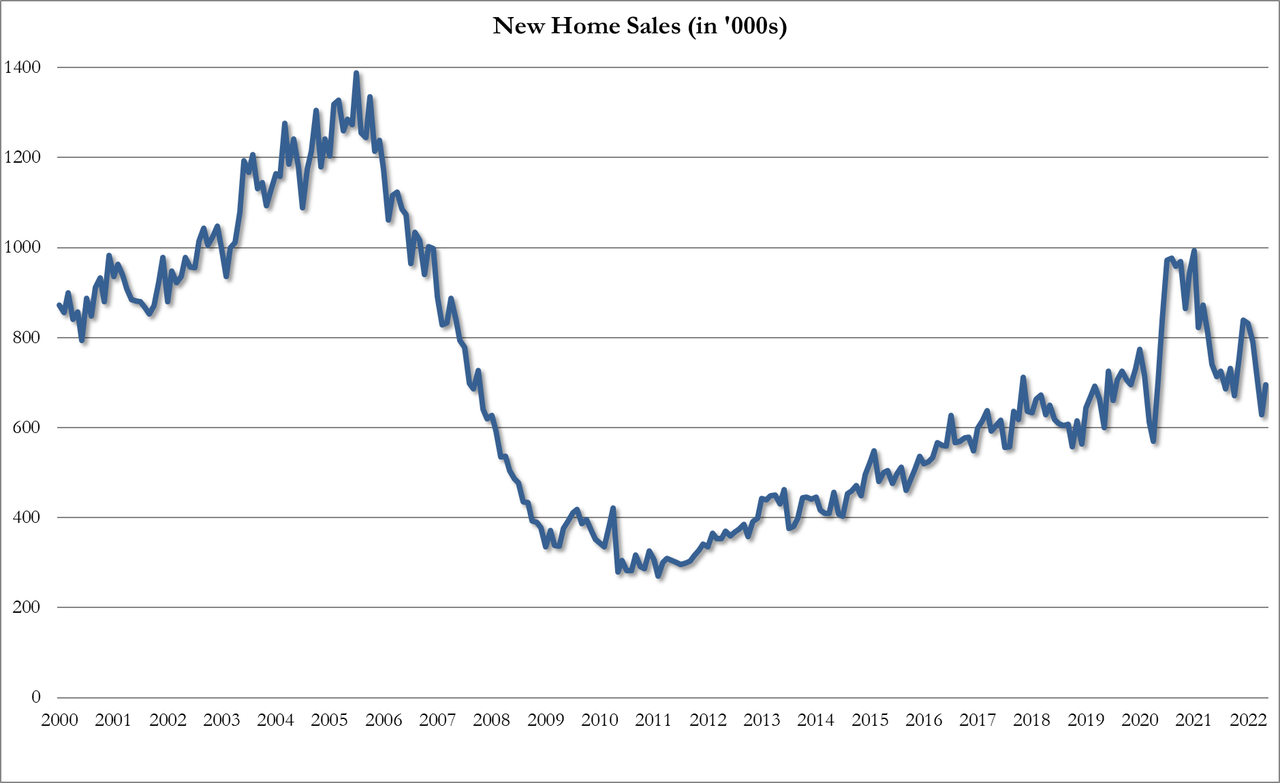
New home sales SAAR bounced from near COVID lockdown lows to 696k from an upwardly revised 629k…

Source: Bloomberg
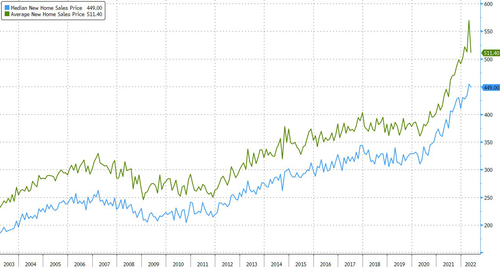
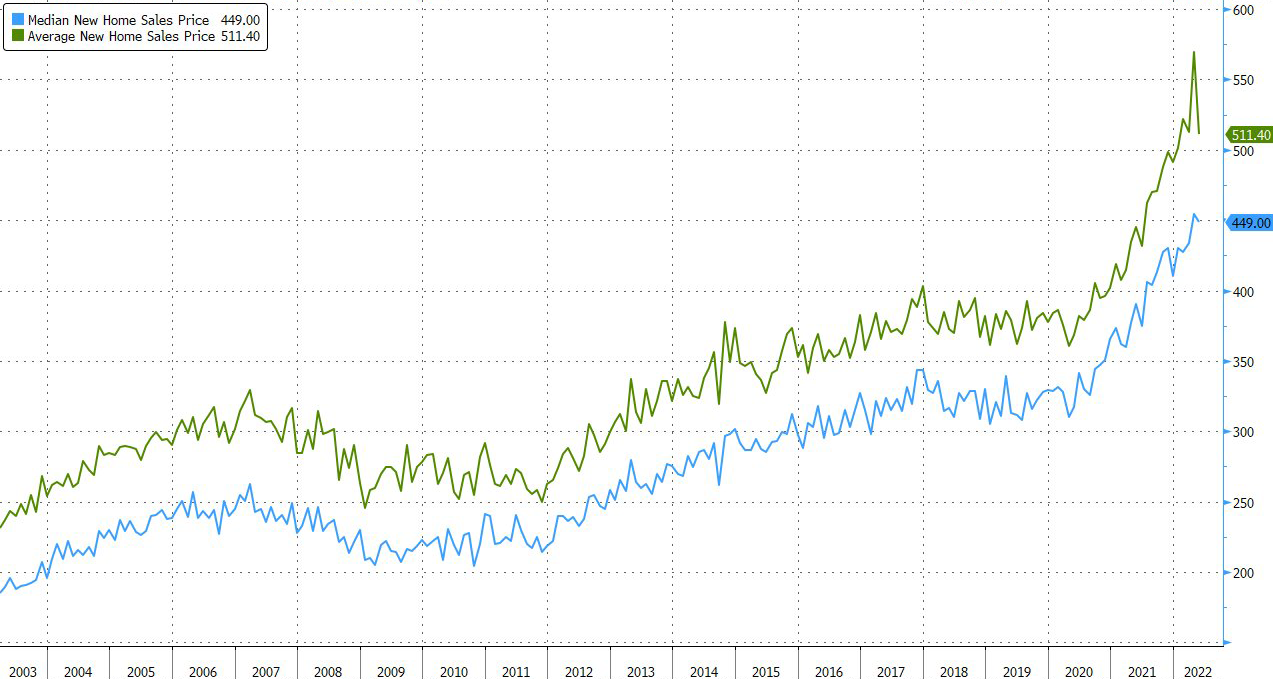
New Home average price tumbles from $569.5K to $511.4K, the lowest since Jan.
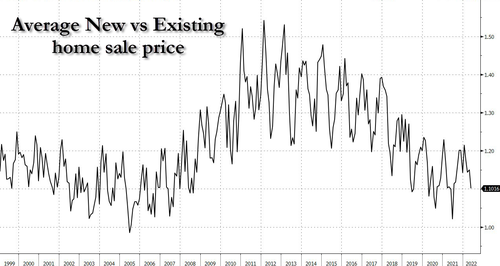
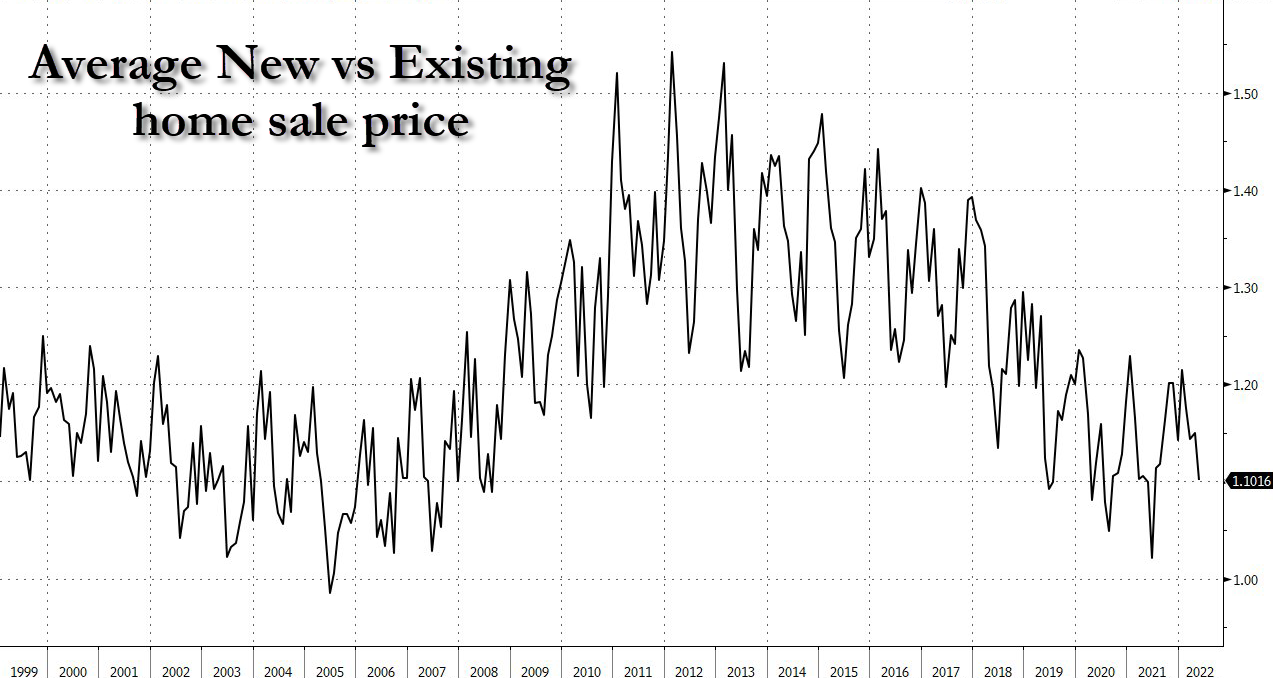
New home prices are falling relative to existing home prices…
Earlier this month, the average rate for a 30-year loan posted its largest one-week increase since the 1980s. It’s risen even further since then.
“Supply remains limited across the country,” Miller said.
“Clearly, production must catch up to the growing household numbers as production of dwellings over the past decade has lagged prior decades by as many as 5 million homes.”
A separate report out last week showed US homebuilder sentiment slid to a two-year low in June, the sixth-straight decline, as rising inflation and higher mortgage rates weighed on demand.
The pickup in sales may also reflect some buyers locking in their mortgage rate in anticipation of even higher borrowing costs.
https://www.zerohedge.com/personal-finance/new-home-sales-unexpectedly-rebounded-may-prices-plunged
June 24, 2022
New Home Sales
New Home Sales Unexpectedly Rebounded In May As Prices Plunged
by Tyler DurdenFriday, Jun 24, 2022 – 10:13 AM
Following the disappointing tumble in existing home sales (to 2 year lows), analysts expect a modest drop in new home sales in May of just 0.2% MoM (after April’s 16.6% MoM plunge). Instead, new home sales spiked 10.7% MoM (from an updwardly revised -12% MoM print in April) – despite soaring mortgage rates…
Source: Bloomberg
New home sales SAAR bounced from near COVID lockdown lows to 696k from an upwardly revised 629k…
Source: Bloomberg
New Home average price tumbles from $569.5K to $511.4K, the lowest since Jan.
New home prices are falling relative to existing home prices…
Earlier this month, the average rate for a 30-year loan posted its largest one-week increase since the 1980s. It’s risen even further since then.
“Supply remains limited across the country,” Miller said.
“Clearly, production must catch up to the growing household numbers as production of dwellings over the past decade has lagged prior decades by as many as 5 million homes.”
A separate report out last week showed US homebuilder sentiment slid to a two-year low in June, the sixth-straight decline, as rising inflation and higher mortgage rates weighed on demand.
The pickup in sales may also reflect some buyers locking in their mortgage rate in anticipation of even higher borrowing costs.
https://www.zerohedge.com/personal-finance/new-home-sales-unexpectedly-rebounded-may-prices-plunged
June 22, 2022
Logistics Update
Logistics Costs As A Percentage Of GDP Hit Highest Level In 13 Years
by Tyler DurdenTuesday, Jun 21, 2022 – 08:20 PM
By Mark Solomon of FreightWaves
The 33rd annual State of Logistics Report, the year-over-year report card of the U.S. business logistics system, confirmed empirically what everyone already knew: 2021 was nirvana or a nightmare depending on what one does for a living.

Total logistics costs, which measure how much was spent on transportation, warehousing and ancillary services such as support and administrative, soared 22.4% last year to nearly $1.85 trillion, according to the report. That was equal to 8% of the U.S. GDP, a level not seen since 2008, said the report, which was released by the trade group Council of Supply Management Professionals (CSCMP) Tuesday morning.
Demand spiked across every mode and service. Businesses desperate for reliable motor carrier capacity powered a 39.3% jump in spending on private fleets or dedicated contract carriage to $415.2 billion. Inventory carrying costs jumped 25% to $502 billion as surging warehouse demand and supply chain congestion filled facilities to overflowing. The capital costs of carrying mountains of inventory jumped 33.4%.
Spending on waterborne services surged 23.6% as ocean carriers leveraged massive rate increases on international sea routes to make more money in 2021 than in the prior 20 years combined, the report said.
Spending on parcel-delivery services jumped 15.6% and produced a five-year compounded annual growth rate of 11.4%, the highest of all the report’s cost components.
All of this led to a fattening of carrier profits at a time when shippers felt the double whammy of shrinking margins and declining service levels, according to the report. Shippers of all types “longed for the days” when service levels that are now considered acceptable were viewed as major failures, the report said.
Through the report’s long history, a relatively high costs-to-GDP ratio reflected network inefficiencies that forced users to spend more to get goods to market. Network inefficiencies were certainly evident in 2021, along with an unprecedented surge in goods demand that is one of the legacies of the COVID-19 pandemic.
Given the events of the first half of 2022, it is clear that next year’s report will look different than this year’s. Consumer demand has cooled off in the wake of higher inflation and the waning effects of pandemic-related government stimulus. Rising interest rates will curtail spending even more.
Consumers worried about cost increases and the possibility of a recession will not be spending nearly as freely this year as they did in the past two. More service-related consumption, especially in travel and entertainment, will cut into goods-spending activity.
Some of that change is showing up in the daily logistics ebb-and-flow. Ron Marotta, vice president of supply chain solutions for the Americas division of freight forwarding and contract logistics firm Yusen Logistics, said on a conference call with reporters last Friday that ocean freight shippers are increasingly looking to negotiate their carrier contracts as more liner capacity opens up.
In a sign that ocean supply and demand might be returning to some form of balance, Yusen has worked off virtually all of its cargo backlogs, some of which have built up over two years, Marotta said. The overall environment, he said, has become “more favorable to shippers.”
While the dual misery of transport delays and higher rates may abate somewhat for shippers, the report’s authors cautioned that the pendulum will not abruptly swing back to capacity abundance and lower rates. E-commerce and last-mile delivery demand will remain elevated and some supply bottlenecks will not loosen easily, they wrote.
Higher borrowing costs will continue to push up the expense of holding the many billions of dollars of inventory sitting in warehouses and distribution centers. The already-complex task of managing a dizzying array of stock-keeping units will only be compounded by the higher interest expense, said Andy Moses, senior vice president of sales and solutions at 3PL Penske Logistics.
The continued upward march in interest rates will “expose any inefficient process management in the warehouse trade,” Moses said last Friday.
https://www.zerohedge.com/markets/logistics-costs-percentage-gdp-hit-highest-level-13-years
June 22, 2022
Logistics Update
Logistics Costs As A Percentage Of GDP Hit Highest Level In 13 Years
by Tyler DurdenTuesday, Jun 21, 2022 – 08:20 PM
By Mark Solomon of FreightWaves
The 33rd annual State of Logistics Report, the year-over-year report card of the U.S. business logistics system, confirmed empirically what everyone already knew: 2021 was nirvana or a nightmare depending on what one does for a living.
Total logistics costs, which measure how much was spent on transportation, warehousing and ancillary services such as support and administrative, soared 22.4% last year to nearly $1.85 trillion, according to the report. That was equal to 8% of the U.S. GDP, a level not seen since 2008, said the report, which was released by the trade group Council of Supply Management Professionals (CSCMP) Tuesday morning.
Demand spiked across every mode and service. Businesses desperate for reliable motor carrier capacity powered a 39.3% jump in spending on private fleets or dedicated contract carriage to $415.2 billion. Inventory carrying costs jumped 25% to $502 billion as surging warehouse demand and supply chain congestion filled facilities to overflowing. The capital costs of carrying mountains of inventory jumped 33.4%.
Spending on waterborne services surged 23.6% as ocean carriers leveraged massive rate increases on international sea routes to make more money in 2021 than in the prior 20 years combined, the report said.
Spending on parcel-delivery services jumped 15.6% and produced a five-year compounded annual growth rate of 11.4%, the highest of all the report’s cost components.
All of this led to a fattening of carrier profits at a time when shippers felt the double whammy of shrinking margins and declining service levels, according to the report. Shippers of all types “longed for the days” when service levels that are now considered acceptable were viewed as major failures, the report said.
Through the report’s long history, a relatively high costs-to-GDP ratio reflected network inefficiencies that forced users to spend more to get goods to market. Network inefficiencies were certainly evident in 2021, along with an unprecedented surge in goods demand that is one of the legacies of the COVID-19 pandemic.
Given the events of the first half of 2022, it is clear that next year’s report will look different than this year’s. Consumer demand has cooled off in the wake of higher inflation and the waning effects of pandemic-related government stimulus. Rising interest rates will curtail spending even more.
Consumers worried about cost increases and the possibility of a recession will not be spending nearly as freely this year as they did in the past two. More service-related consumption, especially in travel and entertainment, will cut into goods-spending activity.
Some of that change is showing up in the daily logistics ebb-and-flow. Ron Marotta, vice president of supply chain solutions for the Americas division of freight forwarding and contract logistics firm Yusen Logistics, said on a conference call with reporters last Friday that ocean freight shippers are increasingly looking to negotiate their carrier contracts as more liner capacity opens up.
In a sign that ocean supply and demand might be returning to some form of balance, Yusen has worked off virtually all of its cargo backlogs, some of which have built up over two years, Marotta said. The overall environment, he said, has become “more favorable to shippers.”
While the dual misery of transport delays and higher rates may abate somewhat for shippers, the report’s authors cautioned that the pendulum will not abruptly swing back to capacity abundance and lower rates. E-commerce and last-mile delivery demand will remain elevated and some supply bottlenecks will not loosen easily, they wrote.
Higher borrowing costs will continue to push up the expense of holding the many billions of dollars of inventory sitting in warehouses and distribution centers. The already-complex task of managing a dizzying array of stock-keeping units will only be compounded by the higher interest expense, said Andy Moses, senior vice president of sales and solutions at 3PL Penske Logistics.
The continued upward march in interest rates will “expose any inefficient process management in the warehouse trade,” Moses said last Friday.
https://www.zerohedge.com/markets/logistics-costs-percentage-gdp-hit-highest-level-13-years
June 20, 2022
Rigs Increase
North America Adds 30 Rigs Week on Week


North America added 30 rigs week on week.
North America added 30 rigs week on week, according to Baker Hughes’ latest rotary rig count, which was published on June 10.
Twenty-four of these additions came from Canada, while the remaining six came from the U.S., Baker Hughes’ count revealed. The total North America rig count now stands at 874 rigs, Baker Hughes outlined. The company’s previous rig count, which was published on June 3, showed that the total North America rig figure had jumped by 14 week on week.
Canada’s 24 weekly rig additions take the country’s total rig count up to 141, comprising 94 oil rigs and 47 gas rigs, and the U.S.’s six weekly additions take the total U.S. rig count up to 733, comprising 580 oil rigs, 151 gas rigs, and two miscellaneous rigs, Baker Hughes highlighted. Of the total U.S. rig count of 733, 715 rigs are land rigs, 15 are offshore rigs, and three are inland water rigs, Baker Hughes pointed out.
Looking at year ago figures, North America has added 320 rigs year on year, according to Baker Hughes. Of this figure, 272 rigs have come from the U.S. – comprising 215 oil rigs, 55 gas rigs, and two miscellaneous rigs – while 48 have come from Canada – comprising 35 oil rigs and 15 gas rigs – Baker Hughes revealed.
Baker Hughes, which has issued the rotary rig counts to the petroleum industry since 1944, describes the figures as an important business barometer for the drilling industry and its suppliers. The company obtains its working rig location information in part from Enverus, which produces daily rig counts using GPS tracking units.
To contact the author, email andreas.exarheas@rigzone.com
https://www.rigzone.com/news/north_america_adds_30_rigs_week_on_week-13-jun-2022-169311-article/