The Urethane Blog
July 16, 2026
JB Hunt Q2 revenues surge 19% YoY to $3.5B
Anchoring the revenue boost, road-to-rail conversion reached levels not seen in over a decade, EVP and President of Intermodal Darren Field said on an earnings call.
Published July 16, 2026
Larry AvilaSenior Editor
Dive Brief:
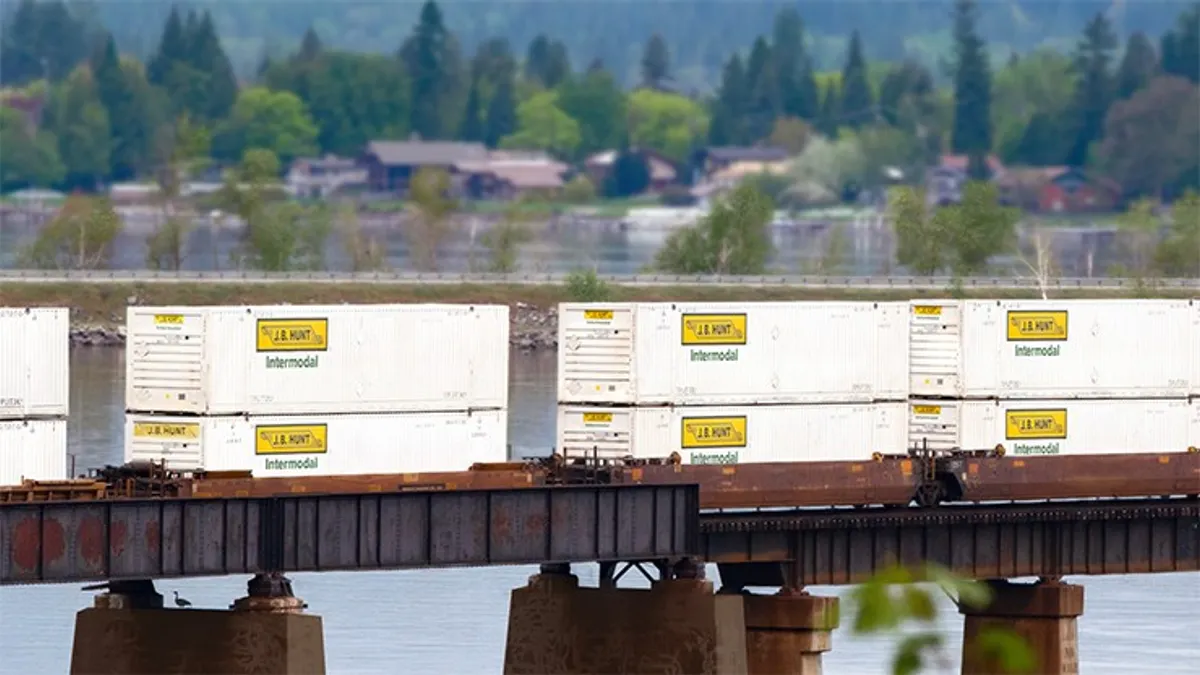
- J.B. Hunt Transport Services on Wednesday reported Q2 revenues jumped 19% year over year to $3.5 billion, driven by increased load volumes across most segments, including intermodal.
- The carrier reported intermodal operating income surged 22% to $1.75 billion from segment volumes rising 10% YoY to more than 578,000 loads, setting a quarterly record, Darren Field, EVP and president of intermodal, said in a call with analysts. He added it was the segment’s first double-digit growth quarter in over a decade.
- “We continue to see significant road-to-rail conversion opportunities in the East, particularly as rising truckload rates, fuel prices and tightening truckload capacity make intermodal an increasingly attractive solution for shippers,” Field said.
Dive Insight:
Tightening trucking capacity and rising rates have pushed shippers to intermodal in recent months.
J.B. Hunt reported intermodal gross revenue increased 11% per load YoY from higher fuel surge revenue, customer rates and changes in freight mix. Excluding fuel surcharge, revenue per load increased 1% from the prior year, the company said.
Spencer Frazier, EVP of sales and marketing, said the company’s strongest area of customer engagement centered on highway to intermodal conversion, dedicated fleets and access to safe and reliable capacity. He added customers initiated more out-of-cycle mini-bids as they sought to keep pricing aligned with rising capacity costs.
The company has been working on productivity improvements across its operations. In its intermodal segment, for example, the carrier has seen a reduction in empty container moves and lower container storage expenses, per its earnings release.
While J.B. Hunt welcomed intermodal’s Q2 performance, Field said the carrier’s focus is to remain disciplined to ensure growth is sustainable over the long term. The company noted it had available intermodal capacity, possibly 10% or more.
Field said the carrier is actively engaged with its rail providers on resource planning to support current and future needs as volumes have accelerated. He added conversion activity is experiencing levels not seen in more than a decade.
What may affect the carrier’s intermodal surge is driver availability, which has been impacted by heightened enforcement of commercial driver license issuance.
Field said driver shortages impacting truckload capacity have trickled into the drayage market.
“In this environment, our in-sourced drayage strategy is a meaningful competitive advantage by owning our tractors, containers and chassis and utilizing primarily company drivers,” he said.
Limiting its use of third-party drayage capacity gives the company more control to maintain the customer experience, Field said.
President and CEO Shelley Simpson said on the call that the company’s available capacity in its segments means more opportunities.
“What makes it great for us to work with our customers is we can help them with conversion into intermodal,” she said. “We can build better fleets for them, and we have plenty of capacity to help them on the highway and final mile side.”
https://www.truckingdive.com/news/jb-hunt-q2-revenues-surge-19-yoy-to-35b/825376
July 15, 2026
Wanhua Chemical’s Hungary integrated complex will undergo maintenance starting from July 17 for a duration of 35 days.
2026-07-15 08:44:21Source:ChemNet中文


On July 15, 2026, Wanhua Chemical (600309.SH) disclosed an announcement regarding facility maintenance. To ensure the stable and safe operation of production facilities, and in accordance with the annual maintenance plan, the integrated production line under BorsodChem, a wholly-owned subsidiary of the company in Hungary, will undergo batch shutdowns for maintenance starting from July 17. This involves the 400,000 tons/year MDI and 250,000 tons/year TDI units, as well as a full set of supporting production facilities such as aniline and nitrobenzene. The overall maintenance duration is expected to be 35 days.
The company stated that this shutdown is a routine annual planned maintenance. The domestic production bases in Yantai and Ningbo are maintaining stable production at full capacity, and this maintenance will not have a significant adverse impact on the company’s overall production and operation.
July 12, 2026
Why Carlisle Companies targets Owens Corning for an M&A combo
Owens Corning, which has a big presence in roofing, insulation and doors, would supercharge Carlisle Companies’ exposure to the residential construction market
June 30, 2026, 4:33pm by Tyler Williams
The Builder’s Daily > Products

Article Summary
A WSJ report said Carlisle has made repeated unsolicited bids to buy Owens Corning for well over $10B. Owens Corning has not entered meaningful talks, but the attempt highlights accelerating consolidation among building products players. AI Summary
As homebuilders grapple with questions of scale, access to capital and long-term competitiveness, many of their largest suppliers appear to be navigating similar strategic pressures.
Carlisle Companies‘ unsolicited pursuit of Owens Corning, reported Monday by the Wall Street Journal, suggests that the forces reshaping homebuilding boardrooms are also beginning to reshape the building-products companies that supply them.
Whether the transaction ultimately succeeds may prove less important than the question it raises: Has scale itself become one of the industry’s most valuable strategic assets?
While the exact value of the latest bid isn’t disclosed, it would reportedly be a “well-over $10 billion deal”. However, Owens Corning has yet to engage in meaningful discussions with Carlisle, suggesting that any potential deal remains highly preliminary and far from a slam dunk.
While the bid’s fate is uncertain, it has the potential to transform Carlisle into a far larger and more diversified building products manufacturer.
That logic increasingly resembles the thinking emerging elsewhere across residential construction.
Homebuilders, distributors and manufacturers alike are confronting a business environment where growth through operating execution alone is becoming more difficult. Technology investment, supply-chain resilience, customer concentration, labor shortages, insurance costs and capital requirements increasingly reward organizations capable of operating broader platforms rather than simply larger businesses.
In that sense, Carlisle’s interest in Owens Corning appears to reflect more than a desire to add revenue. It reflects an effort to assemble a more comprehensive building-envelope platform capable of serving customers across a wider range of residential and commercial applications.
If the acquisition gains steam, Carlisle could expand upon its current offerings, which include commercial roofing and waterproofing, and grow its presence in residential construction.
Owens Corning’s points of strength
Owens Corning primarily operates in residential construction, but it also has a significant commercial presence, bringing something increasingly valuable to any strategic acquirer: optionality.
Rather than depending on a single end market, its revenue spans new residential construction, residential repair and remodeling, commercial construction and non-discretionary repair activity. That diversification helps reduce cyclicality while providing exposure to multiple spending streams across the built environment.
According to an Owens Corning Q2 2026 investor presentation from May, 26% of the company’s revenue comes from non-residential projects. Meanwhile, 23% of revenue comes from new residential construction, 17% from the roughly $500 billion residential R&R sector and 34% from non-discretionary repair.
In today’s uncertain construction economy, that balance may be every bit as valuable as market share. Owens Corning focuses on three categories.
Insulation
The company is a leader in insulation for both residential and commercial products, with slightly more revenue coming from residential. According to company materials, Owens Corning’s insulation revenue has been relatively flat at about $3.7 billion annually since 2022. About 80% of that revenue comes from North American sales, while 20% derives from Europe.
Grand View Research reports that the North American insulation market is about $16.7 billion as of 2025, indicating that Owens Corning commands nearly 18% of the market.
Building code changes have increased demand for higher-performance insulation in North American homes, creating a favorable market opportunity. Owens Corning estimates that the average home now contains roughly 30% more insulation by weight than it did 10 to 15 years ago, indicating a growing market opportunity.
Roofing
Owens Corning’s roofing business, which peaked at $4.6 billion in revenue in 2024, generated $4.4 billion last year, nearly 90% of which came from business within the United States. Based on estimates that value the U.S. roofing market at about $33.5 billion in 2026, Owens Corning accounts for roughly 11% to 12% of the overall market.
About two-thirds of the firm’s roofing revenue comes from shingles, while the rest comes from components sales.
Evercore ISI’s Stephen Kim, in a research note, wrote that the takeover bid, even if it doesn’t come to fruition, reveals the “undervalued nature of the company’s roofing business.”
“Over the past year, the segment’s resilience in the face of declining industry volume set the stage for investors to rethink what is an appropriate multiple for this business. And while near-term challenges in the industry might prove to be a distraction over the next few months, we now believe the increased focus on roofing long-term earnings potential provides the missing catalyst for the shares,” Kim wrote.
Doors
Owens Corning entered the door business after it acquired Masonite International for $3.9 billion in 2024. In 2025, doors generated just over $2 billion in revenue, about 75% of which came from the United States, representing a small slice of the roughly $30 billion U.S. doors-and-windows market.
Why Owens Corning?
While Carlisle Companies has a well-established track record of acquiring smaller rivals, an acquisition of Owens Corning would be by far its largest deal to date. Carlisle generated about $5.0 billion in revenue in 2025, roughly half of Owens Corning’s top line. However, Carlisle’s $15.7 billion market capitalization exceeds Owens Corning’s roughly $11 billion valuation.
If the potential moves forward, it would significantly increase Carlisle’s scale. It would also broaden its product portfolio and greatly expand its exposure to the residential market. About 82% of Carlisle’s revenue came from commercial projects, with only 18% from residential.
Carlisle has significantly more strength in areas like waterproofing systems, building envelope technologies, commercial reroofing and replacement and single-ply commercial roofing membranes, which are designed to protect flat roofs.
Owens Corning, meanwhile, finds its strength in residential asphalt shingles, composite materials, doors and fiberglass insulation.
If the two businesses merge, Carlisle could expand into these product niches and gain significant exposure in the residential market, both new construction and repair. The combined business would create a leading roofing and insulation supplier, with additional offerings like composites, weatherproofing and doors.
Increasing M&A in building materials
Carlisle’s bid to acquire Owens Corning, even if it proves unsuccessful, signals that the highly fragmented building products distribution industry could undergo increasing consolidation in the years ahead.
The industry has already experienced significant M&A activity in recent years, led by the likes of QXO. The Brad Jacobs-backed company announced in April that it will acquire TopBuild for $17 billion, a deal that the two companies’ stockholders approved on Monday. QXO also bought Kodiak Building Partners for $2.25 billion earlier this year.
The Webb Analytics 2025 Deals Report found that 2025 generated the highest level of building materials M&A activity in a decade based on facilities acquired. Even though deal volume declined 30% and there were fewer acquirers, larger transactions played an outsized role.
Just four of the 120 reported deals last year represented 85% of all supply facilities acquired. This suggests that the industry’s largest players, like QXO, The Home Depot, Lowe’s and Builders FirstSource, are becoming increasingly influential in driving consolidation and capturing market share.
Another boardroom question
Carlisle’s unsolicited approach also arrives at a moment when public-company boards across housing-related industries are increasingly confronting similar strategic questions.
For homebuilders, recent transactions involving Taylor Morrison, Tri Pointe Homes, Landsea Homes and others have underscored how boards are weighing independence against the benefits of larger capital platforms.
Building-products manufacturers appear to be entering a comparable phase.
The question is no longer simply whether companies can continue growing independently.
It is whether shareholders may ultimately be better served through combinations capable of accelerating growth, broadening product portfolios and improving long-term competitive positioning.
Whether Owens Corning’s board reaches that conclusion remains to be seen.
But Carlisle’s proposal suggests those conversations are no longer confined to homebuilders.
July 9, 2026
US MDI Prices Rise 1.54% in Late June Amid Tight Supply
William Faulkner09-Jul-2026

The U.S. Methylene Diphenyl Diisocyanate (MDI) market moved higher throughout June, supported by supply disruptions, maintenance shutdowns, and resilient downstream demand. MDI prices strengthened as maintenance at Huntsman’s Geismar facility, Covestro’s force majeure, and BASF’s planned turnaround reduced domestic availability and tightened spot supplies, while limited imports further supported the MDI market. In the week ending June 28, the MDI DEL Texas grade recorded a 1.54% increase, reflecting persistent supply tightness and healthy buying interest. Demand for MDI remained healthy across insulation, spray-foam, rigid polyurethane foam, coatings, and automotive applications, with buyers actively replenishing inventories ahead of anticipated supply constraints. Improved automotive and electronics production also contributed to steady MDI consumption, although weaker activity in parts of the chemicals, plastics, and rubber sectors moderated overall demand growth. Firm aniline prices and occasional strength in benzene increased production costs, enabling producers to maintain higher offers for MDI. Looking ahead, ongoing maintenance, restricted supply, resilient construction activity, and steady polyurethane demand are expected to keep the MDI market firm, although improved production rates or easing feedstock costs could moderate future price increases.
The MDI market in the United States recorded a strong upward trend throughout June, supported by supply disruptions, firm downstream consumption, and improving buyer confidence. MDI prices strengthened steadily during the month as maintenance outages tightened product availability and encouraged buyers to secure material in advance. By the final week of June, the MDI DEL Texas grade recorded a 1.54% increase in the week ending June 28, reflecting continued supply constraints, healthy purchasing activity across major downstream sectors, and sustained bullish market sentiment.
Demand for MDI remained broadly supportive despite mixed industrial performance. The construction sector continued to drive consumption, with insulation and spray-foam manufacturers actively replenishing inventories ahead of anticipated shortages. Strong buying from rigid polyurethane foam producers also supported MDI demand. Meanwhile, automotive manufacturing improved during the month, boosting polyurethane applications used in vehicle interiors and components. Production of electrical equipment and electronics also expanded, providing additional support for MDI consumption in coatings and insulation materials. However, softer activity across parts of the plastics, chemicals, and rubber industries prevented demand from accelerating more aggressively, keeping overall purchasing balanced.
Supply conditions remained the primary factor influencing MDI pricing. Several planned and unplanned production disruptions significantly reduced spot market availability during June. Maintenance work at Huntsman’s Geismar facility, the force majeure declared by Covestro following an upstream production issue, and BASF’s scheduled maintenance preparations collectively tightened domestic supply. At the same time, limited import arrivals prevented buyers from offsetting reduced domestic availability, resulting in a tighter MDI market. Producers maintained firm pricing strategies as inventories remained constrained and buyers continued restocking activity.
Feedstock costs also contributed to the bullish sentiment. Firm aniline prices during mid-June, along with occasional strength in benzene values, increased production costs and supported higher offers for MDI. Rising raw material expenses reinforced supplier confidence, while steady downstream demand enabled producers to successfully implement price increases across the market.
Weekly pricing reflected a consistent upward trajectory rather than short-term volatility. After relatively stable conditions in early June, MDI prices advanced sharply during the middle of the month as supply disruptions became more evident. In the week ending June 28, the MDI DEL Texas grade increased by 1.54%, highlighting the continued impact of tight spot availability, producer pricing discipline, and sustained buyer restocking. The weekly gain confirmed that market fundamentals remained supportive, with buyers continuing to build inventories to protect against further supply shortages and maintain procurement flexibility.
Looking ahead, the near-term outlook for MDI remains positive. Ongoing maintenance activities, limited spot availability, constrained imports, and resilient demand from insulation, construction, automotive, and polyurethane manufacturers are expected to keep the market firm. While any decline in feedstock costs or improved production rates could moderate future gains, current fundamentals indicate that MDI prices are likely to remain supported in the coming weeks.
July 8, 2026
Anti-Dumping on Polyurethane: How Trade Defense Is Repricing China’s PU Export Model
July 1, 2026 19 min read
MARKET INTELLIGENCE
Three separate forces are pressing on the same point of the global polyurethane chain this year, and they are easy to read as unrelated headlines rather than one story. A wave of anti-dumping duties across the United States, Europe, India, and Brazil is raising the cost of Chinese PU-chain exports at destination. China’s own decision to cancel export VAT rebates on polyether polyols is raising the cost of leaving China in the first place. And a five-month war in the Persian Gulf pushed feedstock costs into a spike that is only now unwinding. None of the three is new information individually. Read together, they describe the end of a specific economic model, export-led Chinese PU oversupply sold at a persistent discount, rather than a cluster of coincidental trade disputes.
One Cause, Two Reactions
It is worth being precise about what is actually driving this, because the anti-dumping wave and Beijing’s own rebate cancellation are frequently discussed as opposing developments, foreign protectionism versus Chinese liberalization, when they are better understood as two reactions to the same underlying condition: sustained Chinese overcapacity in polyether polyols, MDI, TDI, and their shared upstream inputs. Chinese polyether polyol exports grew from roughly 1.7 million tonnes in 2023 to 2.8 million tonnes in 2025, a pace of growth that outstripped demand growth in every importing market and kept margins compressed across the value chain, including inside China itself. Producers in the US, EU, India, and Brazil responded to that oversupply the way trade law allows them to: by petitioning their own governments for relief. Beijing is responding to the same oversupply the way domestic industrial policy allows it to: by removing a subsidy that no longer serves its own producers’ interests either. The VAT rebate cancellation is frequently framed as a response to foreign pressure, but the stated rationale, curbing what Chinese policymakers call ‘involution,’ the deflationary price competition eating into every producer’s margin, points to a domestic motive that happens to align with what foreign trade-defense authorities want. That alignment is precisely what makes 2026 different from previous rounds of anti-dumping activity: the exporting country and the importing countries are, for once, pulling in the same direction, even if for different reasons.
A Decade in Context: Is This Actually Unusual?
TRADE REMEDY ACTIVITY AGAINST CHINA, 2015–2026
It is worth testing the claim above against the historical record, because trade remedies against China are not new, they have been a persistent feature of the trading system since China’s 2001 WTO accession, and it would be a mistake to read every new filing as evidence of an unprecedented crackdown. Chinese government data compiled through the Ministry of Commerce’s own Trade Remedy Information Center shows the total number of new investigations opened against Chinese products by all countries fluctuating between roughly 46 and 131 a year over the past decade, with most years landing in a 70–105 range. Looked at that way, the current wave is a continuation of a long-running pattern, not a departure from it.
What has changed is the shape of the curve, not just its existence. 2023 was a relatively quiet year at 69 new cases; 2024 more than doubled that to a record 160, with the number of countries filing cases rising from 18 to 28 in a single year as smaller and developing economies: Thailand, Peru, Pakistan among them, joined the traditional heavy users (India, the US, the EU). Steel offers a sharper illustrative comparison at the sector level: China faced roughly 29 major steel trade cases in the thirteen months from January 2024 to February 2025, against 15 across the entire four-year span from 2020 to 2023. That is not incremental growth; it is a step change in pace, concentrated in exactly the overcapacity-heavy sectors, steel, batteries, solar, and increasingly chemicals, where China’s own domestic price data shows the deepest and most sustained margin compression.
| Year | Cases | Context |
| 2020 | 131 | Prior high point, Covid-era disruption |
| 2022 | 46 | Cyclical low |
| 2023 | 69 | 18 trading partners filed cases |
| 2024 | 160 | Record high — more than double 2023; 28 trading partners, incl. Thailand, Peru, Pakistan |
Two further data points frame where polyurethane sits within this broader picture. Over the longer run, 1995 to 2023, a cumulative 1,614 anti-dumping cases have been brought against China worldwide, with India (298 cases), the United States (189), and the European Union (155) as the three heaviest historical users; the current polyol, MDI, TDI, PTMEG, and adipic acid cases sit inside exactly that same top-three roster rather than representing new entrants to the practice. And within China’s own chemical sector specifically, industry commentary describes three consecutive years of profit decline and a roughly 36% fall in the sector’s product price index through late 2025, with local analysts explicitly warning that 2026 would bring more trade friction rather than less — a warning that the polyether polyols, PTMEG, and adipic acid filings of the past six months have already borne out. The honest reading, then, is not that anti-dumping activity against China is a new phenomenon in 2026, but that the specific chemicals underpinning polyurethane have moved, within the space of about eighteen months, from being a secondary target to one of the more active fronts inside a genuinely record year for the practice overall.
North America: A Case Study in Speed
UNITED STATES
The US MDI case is a useful marker for how quickly these proceedings can now move once a government decides to prioritize them. Petitioned in February 2025 by BASF and Dow under an ad hoc fair-trade coalition, the case produced preliminary margins as high as 511.75% within seven months and a finalized, enforceable antidumping duty order by June 25, 2026, roughly sixteen months from filing to order, which is fast by the standards of the statutory process. The final rate settled closer to 161.6% for cooperating respondents after correction of a ministerial error, still high enough to functionally exclude Chinese MDI from meaningful price competition in the US market for the foreseeable future.
The PTMEG case opened in April 2026 is worth reading differently. By naming South Korea and Vietnam alongside China, among other Asian producers, the petitioners are implicitly arguing that the problem is regional oversupply in the isocyanate and glycol chain, not a China-specific pricing practice. That framing matters for how Chinese producers should think about strategy: shifting nominal production or blending to a third Asian country will not obviously solve the underlying exposure if the US treats the whole region as a single competitive threat. The case is still in its early stage: the ITC’s May 2026 injury vote came back affirmative, which keeps the investigation alive, but that only clears the lower bar of ‘reasonable indication of injury.’ The number that will actually set duty levels, Commerce’s preliminary dumping margin, isn’t due until September 16, 2026, so there’s no PTMEG duty rate to point to yet, only a case that has survived its first procedural checkpoint.
Europe: The Producer Coalition Strategy
EUROPEAN UNION
The European cases show a related pattern, fewer but larger producers acting collectively rather than a single national champion filing alone, as in the Brazilian and US cases. The polyether polyols investigation opened in late June 2026 was brought jointly by BASF, Covestro, PCC Rokita, Shell, and Chimcomplex, effectively the entire surviving EU polyol producer base filing as one bloc. The adipic acid case that concluded in May 2026 with duties of 29.1% to 42.3% followed the same collective logic, built around a Chinese sector that now controls close to 70% of global adipic acid capacity. Two further filings on PBAT and aliphatic-aromatic copolyesters, adjacent biodegradable-plastics chains rather than core PU inputs, were both triggered by BASF, which is emerging as the most consistently active single petitioner across the entire European chemicals trade-defense docket this year, not just in polyurethane.
The complication is capacity. Ineos has publicly warned that the European Commission’s trade-defense caseload has grown faster than its staff can process it, citing injury findings as high as 67% met with duties proposed as low as 3.7% in unrelated cases. If that capacity constraint holds for polyurethane cases as it apparently has elsewhere, the polyether polyols investigation opened in June could take considerably longer to reach a preliminary determination than the statutory timeline suggests, leaving Chinese exporters operating under investigation-related uncertainty for an extended period without yet facing an actual duty.
India: What Sunset Reviews Reveal
INDIA
India offers the longest running dataset on how these measures actually perform over time, and the pattern is instructive. TDI duties against China, Japan, and Korea have been in force in some form since 2016 and were reaffirmed through a sunset review in 2022, suggesting a durable, structural competitive disadvantage that Chinese TDI has not been able to close even after several years of trying. Spandex tells a different story. An earlier elastomeric filament yarn duty regime lapsed in 2022, and Chinese and Vietnamese pricing pressure returned quickly enough that Indorama filed a fresh petition, resulting in a March 2026 recommendation for duties of roughly US$2 per kilogram. The lesson for how to read any of the current cases: a five-year duty is not necessarily a permanent solution, and the underlying Chinese cost advantage tends to reassert itself the moment protection lapses, which is exactly the dynamic worth watching as the US, EU, and Brazilian measures approach their own review dates later this decade.
India has also been the most active jurisdiction anywhere in actually completing new PU-chain cases rather than leaving them in process. A polyether polyol case opened in March 2023 by Manali Petrochemicals, India’s sole domestic producer, concluded within a year with duties of $534 per tonne on Wanhua and $608 per tonne on other Chinese producers — finalized a full year before Brazil’s comparable polyol case and more than two years ahead of the EU’s, which only opened in June 2026. A separate case brought by Covestro’s Indian unit against thermoplastic polyurethane (TPU) followed the same fast timeline, running from initiation in September 2023 to a finalized duty of $0.93–$1.58 per kilogram by October 2024. Taken together with TDI and the spandex cases, India has now run five distinct PU-chain proceedings against China since 2016, more than any other jurisdiction in this survey, and its average time from initiation to final duty, roughly twelve to fourteen months, is also the fastest of the major users covered here.
Brazil: The Limits of Protection, Seen From Inside
BRAZIL
Brazil is the clearest illustration of the tension these measures create even where they succeed. GECEX Resolution No. 754, in force since July 2025, set Chinese polyether polyol duties at roughly double the rate applied to US exporters, US$1,409–1,469 per tonne against Chinese producers including Wanhua and Hebei Yadong, versus US$555–680 per tonne against BASF and Dow. Dow Brasil Sudeste, the sole domestic petitioner, got the protection it asked for, and the size of the gap between the China and US rates points to exactly the outcome the duty was designed to produce: Chinese-origin volume is understood to have been the more heavily displaced of the two since July 2025, with import volumes from China running below their pre-duty levels. Brazil’s customs data broken out by origin was not available for this report, so that direction is best read as the expected and, on the evidence assembled during the case, the intended result rather than a precisely quantified figure.
Brazil’s foam and mattress manufacturers, represented by ABICOL, pushed back hard enough that SECEX opened a formal public-interest review within two weeks of the duties taking effect, specifically to assess whether they should be suspended given supply-shortage risk. That review has since concluded: GECEX Resolution No. 858, published February 20, 2026, closed the assessment without suspending or modifying the duty, after Dow argued that supply from non-Chinese origins combined with domestic capacity was sufficient to cover Brazilian demand. The measure stands as originally set, in force to 2030. The episode is still a useful reminder that anti-dumping relief redistributes cost within the importing country as much as it restricts the exporting one; the domestic producer won twice, first on the original case and again on the review; though this particular review resolved in the petitioner’s favor rather than staying open-ended.
Brazil’s parallel adipic acid sunset review, opened March 30, 2026, adds a second layer: Brazil is simultaneously defending one wall on polyols, now upheld in full, and deciding whether to extend a second one on an adjacent PU input.
Southeast Asia: Exposure Without a Mechanism
INDONESIA, VIETNAM, MALAYSIA, THAILAND
No Southeast Asian authority currently runs a direct anti-dumping case against Chinese MDI, TDI, or polyether polyols. Indonesia’s KADI has been active on adjacent petrochemicals — polypropylene homopolymer and block copolymer — but those cases target multiple Asian exporters collectively rather than China specifically, a materially different posture from the China-focused cases in the US, EU, and India. What Southeast Asia does have is exposure: Vietnam sourced roughly 70% of its polyether polyol imports from China in 2025, a concentration that makes it a natural landing zone for volume that Chinese producers can no longer place competitively in the US, EU, India, or Brazil. Indonesia’s move to draft anti-circumvention and transshipment rules for 2026 suggests regulators are alert to the risk of Chinese material being rerouted through the region to dodge duties elsewhere, which, if finalized, would close off the release valve that currently makes Southeast Asia the most open market left for Chinese PU exports.
China’s Own Lever
CHINA DOMESTIC POLICY
On January 8–9, 2026, China’s Ministry of Finance and State Taxation Administration cancelled the 13% VAT export rebate on 249 product categories effective April 1, 2026, with polyether polyols under HS code 39072990 explicitly included alongside PVC, agrochemicals, and photovoltaic and battery inputs. With export dependency near 33% of Chinese polyol production, the removal of the rebate strips out a cost advantage that has underpinned Chinese pricing dominance in Turkey, India, and Vietnam for years. Some larger, vertically integrated producers are exploring a bonded processing-trade workaround — importing propylene oxide under a duty-free handbook scheme, converting it domestically, and re-exporting the finished polyol without triggering VAT — but the model only pencils out while imported PO undercuts domestic PO, a narrowing window as global feedstock markets normalize.
A Price Reality Check: What the Hormuz Shock Actually Did
FEEDSTOCK VOLATILITY, MARCH–JULY 2026
Two of the developments above happened to land in the same six-week window as an unrelated geopolitical shock, and separating the two matters for reading current spot prices correctly. The 2026 Iran war began February 28, and Iran declared the Strait of Hormuz closed on March 4, disrupting roughly a fifth of global seaborne oil and LNG trade and pushing Brent crude above $120 per barrel by mid-March. Because propylene oxide, the direct feedstock for polyether polyols, is an oil derivative, the war shock landed on Chinese FOB polyol pricing at almost exactly the same moment Chinese exporters were also rushing shipments to beat the April 1 VAT rebate deadline, two separate cost-and-volume pressures compounding into a single, unusually sharp spike.
The scale of the move, and the shape of its unwind, is worth stating plainly rather than folding into the trade-policy narrative above. Chinese FOB polyol pricing rose from roughly $1,225 per tonne on March 1 to a peak of $2,265 on April 8, an 85% move in five weeks, before falling back to around $1,340 per tonne by July 1, a 41% retracement from the peak that leaves China only about 9% above its pre-crisis baseline. European and North American delivered prices moved on a longer lag and have not unwound nearly as far: West European polyol peaked in early May near €2,575 per tonne and North American polyol peaked in late May near $3,142 per tonne, and both remain roughly 13% below those peaks as of July 1, still close to double their March 1 starting points. That divergence is itself informative: Chinese pricing, driven by FOB spot competition and no longer cushioned by an export subsidy, snapped back quickly once the war de-escalated and the pre-deadline rush ended, while Western delivered prices, which layer freight, war-risk insurance, and in several cases anti-dumping duties on top of the same feedstock cost, are proving considerably stickier on the way down.

Weekly average spot prices, China (FOB), West Europe and North America (DEL). Source: PUdaily market pricing data.
| Market | Mar 1 baseline | 2026 peak | Jul 1, 2026 |
| China, FOB (USD/t) | $1,225 | $2,265 (Apr 8) | $1,340 (–41%) |
| West Europe, DEL (EUR/t) | €1,122 | €2,575 (May 8) | €2,250 (−13%) |
| North America, DEL (USD/t) | $1,582 | $3,142 (May 27) | $2,745 (−13%) |
The practical implication for anyone reading a Chinese FOB quote today: the current price reflects a market that has already round-tripped through both a war shock and a subsidy withdrawal and landed close to where it started. It is not yet clear whether $1,300–$1,400 per tonne represents a new, post-rebate equilibrium or a temporary trough before Chinese producers pass through the lost 13% rebate more fully once feedstock volatility settles further.
Global Snapshot
| Region | Product | Status | Key figure |
| United States | MDI | AD order in force — Jun 2026 | ~161.6% final rate |
| United States | PTMEG | ITC injury vote affirmative — May 2026 | China, Korea, Vietnam named; dumping margin due Sep 2026 |
| European Union | Adipic acid | Definitive duties — May 2026 | 29.1% – 42.3% |
| European Union | Polyether polyols | Investigation opened — Jun 2026 | BASF, Covestro, PCC Rokita, Shell, Chimcomplex |
| European Union | PBAT / copolyesters | Investigations opening | BASF-led complaints, adjacent chain |
| India | TDI | In force — renewed 2022 | China, Japan, Korea |
| India | Polyether polyols | In force — Mar 2024 | $534–$608/t |
| India | TPU | In force — Oct 2024 | $0.93–$1.58/kg |
| India | Spandex / elastane | Recommended — Mar 2026 | Up to ~$2/kg; China + Vietnam |
| Brazil | Polyether polyols | In force — Jul 2025 | $1,409–$1,469/t (vs $555–$680/t US) |
| Brazil | Adipic acid | Sunset review — Mar 2026 | Extension under review |
| Southeast Asia | PU raw materials | No direct AD action | Vietnam ~70% China-origin polyol |
| China (domestic) | Polyether polyols + 248 others | VAT rebate cut — Apr 2026 | 13% rebate removed, HS 39072990 |
What Comes Next for Chinese Product
None of this points toward a collapse in Chinese PU export volumes, and it is worth resisting the temptation to read the case log above as a story of China losing ground. China’s capacity base remains large and cost-competitive at the feedstock level, and the obvious response to a duty, redirecting volume toward markets that haven’t imposed one, is exactly what trade theory predicts and what Chinese exporters have done in every prior round of this cycle. The more interesting question is not whether that redirection happens, but what else is happening at the same time: Chinese polyol, MDI, and TDI quality has continued to improve over the past several years, with leading producers such as Wanhua and Covestro’s China operations investing in higher-specification grades and moving up the value chain rather than competing on price alone. That matters because it means the current wave of duties raises the cost of entry for Chinese material without necessarily closing the quality gap that used to be the main argument against it, a materially different situation from a decade ago, when Chinese product competed almost purely on price.
With that caveat in mind, a few specific developments look likely over the next twelve to twenty-four months:
- Continued trade-flow redirection toward markets without duties. Chinese volume that previously went to the US, EU core markets, India, and Brazil will keep concentrating in Southeast Asia, the Middle East, and Africa, reinforcing the import-dependence numbers already visible in Vietnam, Turkey, and India. This is the default response to any duty and shouldn’t be read as a special insight so much as the baseline case.
- Gradual uptake of bonded processing-trade structures. The import-PO, export-polyol workaround may spread beyond the largest integrated producers as the VAT rebate loss bites, though its economics remain fragile and sensitive to the domestic-versus-imported PO price spread, so this is likely to stay a partial, producer-specific response rather than a wholesale shift.
- More anti-circumvention scrutiny over time. Indonesia’s 2026 rulemaking may be followed by similar moves elsewhere as regulators in duty-free markets watch import volumes rise and ask whether material is genuinely originating where it claims to.
- Some consolidation pressure inside China, concentrated among smaller producers. Non-integrated Chinese polyol producers without secure feedstock access face the most margin pressure from the combined effect of the rebate loss and continued anti-involution policy; some capacity rationalization there is plausible, though the pace will depend on how much support local governments continue to extend to marginal producers.
- More overseas capacity investment by the largest Chinese producers, continuing an existing trend. Wanhua’s Hungary MDI capacity is the clearest precedent: producing inside a market that would otherwise impose a duty sidesteps the issue rather than contesting it, and further announcements of this kind would be consistent with treating the current measures as durable rather than temporary, though this is an extension of a strategy already underway, not a new one.
- A gradually widening product list, following an established pattern. TDI, PTMEG, and adipic acid cases are already open in multiple jurisdictions; adjacent chains such as PBAT are following the same petition pattern, and further filings covering additional PU-adjacent HS codes are a reasonable base-rate expectation rather than a dramatic escalation.
The honest summary: Chinese producers are not losing their structural cost advantage in feedstock and scale, and the quality gap that once made Western and Indian material an easy default choice has narrowed. What has changed is that the advantage now has to clear a materially higher bar, duties in force or pending across four continents, a lost export subsidy at home — before it shows up as a landed price advantage for the buyer. That is a slower, costlier, and more contested version of the same trade, not the end of it, and not a story with an obvious winner.
Appendix: Full Case Log (2003–2026) — Anti-Dumping Actions Against Chinese PU-Chain Products
The list below covers documented anti-dumping investigations specifically targeting Chinese polyurethane-chain products — MDI, TDI, PTMEG, adipic acid, polyether polyols, TPU, spandex/elastane, and PU-coated leather — across the jurisdictions most active in this space. It reaches back to the earliest confirmed case, India’s original 2003 polyether polyol investigation, to show that PU-specific trade defense against China is not purely a product of the last decade, even though the current wave is far denser than anything in the prior twenty years. The log excludes adjacent chemicals (PBAT, copolyesters, general petrochemicals) and countries where no PU-specific case could be confirmed in available public sources, including Southeast Asia, where, as discussed above, no direct case against Chinese PU raw materials currently exists. Dates reflect investigation initiation, final determination, and duty notification where applicable; “Ongoing” indicates no final determination as of this writing.
| Jurisdiction | Product | Started | Outcome |
| India | Polyether polyol (China, South Korea) — original case | 2003 | Final Nov 2004; sunset renewal 2009 (min. price $2,601/t); 2nd sunset review withdrew measure — lapsed 2015 |
| India | TDI (China, Japan, Korea) | Oct 2016 | Final Dec 2017; sunset renewed Jun 2022 — in force |
| India | Spandex (China, Vietnam, Korea) — original case | c. 2016 | Duty imposed 2016 (~$3.34/kg); lapsed 2022, not renewed |
| India | PU leather (China) | Feb 2021 | Final Feb 2022; duty $0–$0.46/m from May 2022 — in force to 2027 |
| India | Polyether polyol (China, Thailand) | Mar 2023 | Final Mar 2024; duty $534–$608/t — in force to 2029 |
| India | TPU (China) | Sep 2023 | Final Aug 2024; duty $0.93–$1.58/kg from Oct 2024 — in force to 2029 |
| India | Spandex (China, Vietnam) — revived case | Mar 2025 | Recommended Mar 2026, up to ~$2/kg — pending notification |
| United States | MDI (China) | Feb–Mar 2025 | Final Apr 2026; AD order Jun 2026 — duty ~161.6%, in force |
| United States | PTMEG (China, Korea, Vietnam) | Apr 2026 | ITC injury determination affirmative, May 2026, investigation continues; Commerce dumping-margin preliminary due Sep 16, 2026 |
| European Union | Adipic acid (China) | Mar 2025 | Provisional Nov 2025; definitive May 2026 — duty 29.1–42.3%, in force |
| European Union | Polyether polyol (China) | Jun 2026 | Just opened — no determination yet |
| Brazil | Polyether polyol (China, US) | Jan 2024 | Definitive Jul 2025 — duty $1,409–$1,469/t (China); public-interest review closed Feb 2026, duty upheld unchanged, in force to 2030 |
| Brazil | Adipic acid (China) — sunset review | Mar 2026 | Ongoing — review of existing duty |
Read chronologically, the list itself makes the point of the section above concrete: a single early case in 2003 that ultimately lapsed in 2015 right as the current cycle was about to begin, then two more cases opened in the 2016–2021 window (India TDI, India PU leather), against nine opened from 2023 onward (India polyol, India TPU, India spandex revival, US MDI, US PTMEG, EU adipic acid, EU polyether polyols, Brazil polyol, Brazil adipic acid sunset review). The pace roughly quadrupled in the second half of the decade, and every case still open or still in force as of mid-2026 was filed in 2023 or later, with the sole exception of India’s TDI order, which has now survived one full sunset review and remains the longest-running currently active PU-specific measure against China in this list.
 Everchem Updates Archive
  Sign Up for Email Updates