The Urethane Blog
Everchem Updates
VOLUME XXI

September 14, 2023
Everchem’s exclusive Closers Only Club is reserved for only the highest caliber brass-baller salesmen in the chemical industry. Watch the hype video and be introduced to the top of the league: — read more
November 19, 2022
Visualizing America’s Changing Demographics Over The Past 100 Years
by Tyler Durden
Friday, Nov 18, 2022 – 08:00 PM
The United States has famously been called a melting pot, due its demographic makeup of various cultures, races, religions, and languages. But what shape does that mixture take? And how has it changed over time?
Beginning over 100 years ago, this video from Kaj Tallungs assesses how America’s demographics have changed from 1901 to 2020. It uses data from multiple sources including the U.S. Census Bureau, the National Center for Health Statistics, and the Human Mortality Database.
A Look at the Total Population
As Visual Capitalist’s Avery Koop notes, the most obvious takeaway from this animation is that America’s population has soared over the last century. America’s population grew from 77 million in 1901 to over 330 million in 2020—or total growth of 330% over the 119 years.
And the U.S. has continued to add to its population totals. Here’s a brief look at at the population in 2021 by regional breakdowns:

And here’s a glance at how some of the population shakes out, across the top 10 most populous states in the country:
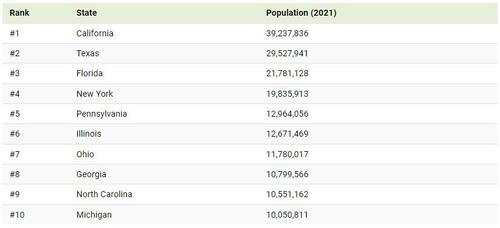
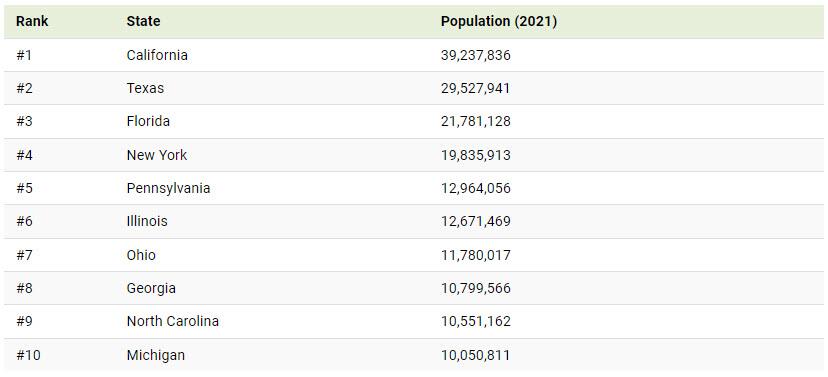
Demographic Breakdowns
Diving a little deeper, the country’s demographic breakdowns have also changed significantly over the last 100+ years. While the share of men and women is an obvious near-even split, age and race distributions have changed drastically.
For starters, though birth rates have remained fairly strong in the U.S., they have been slowing over time. This is similar to many other Western countries, and can eventually result in a larger share of elderly people as well as an increased financial cost of subsidizing their care. Additionally, fewer births results in a depleting workforce as the young population shrinks.
The shares of Black, Asian, Hispanic, and people of two or more races have also been growing. In fact, between 2010–2020 the population of people identifying as two races or more increased by a whopping 276%.
Here’s a glance at some of the other demographic growth rates over the 2010-2020 period:
- Black or African American alone population: +5.6%
- Asian alone population: +35.5%
- Hispanic or Latino alone population: +23%
- White population: -9%
Looking Ahead
Like many countries, a “graying” of the population will become a concern in the United States.
By 2060, it is expected that 95 million Americans will be over 65. But the share of those 18 and under will also continue to grow (albeit at a much slower pace) from 74 million people in 2020 to 80 million in 2060.
Another interesting insight from the Census Bureau is that from 2016–2060, the American-born population is expected to grow by only 20%, whereas the foreign-born population—the share of population who will immigrate to the U.S.—is expected to rise 58%.
True to the melting pot moniker, America’s demographics will continue to change dramatically over the coming decades.
https://www.zerohedge.com/economics/visualizing-americas-changing-demographics-over-past-100-years
November 19, 2022
Visualizing America’s Changing Demographics Over The Past 100 Years
by Tyler Durden
Friday, Nov 18, 2022 – 08:00 PM
The United States has famously been called a melting pot, due its demographic makeup of various cultures, races, religions, and languages. But what shape does that mixture take? And how has it changed over time?
Beginning over 100 years ago, this video from Kaj Tallungs assesses how America’s demographics have changed from 1901 to 2020. It uses data from multiple sources including the U.S. Census Bureau, the National Center for Health Statistics, and the Human Mortality Database.
A Look at the Total Population
As Visual Capitalist’s Avery Koop notes, the most obvious takeaway from this animation is that America’s population has soared over the last century. America’s population grew from 77 million in 1901 to over 330 million in 2020—or total growth of 330% over the 119 years.
And the U.S. has continued to add to its population totals. Here’s a brief look at at the population in 2021 by regional breakdowns:
And here’s a glance at how some of the population shakes out, across the top 10 most populous states in the country:
Demographic Breakdowns
Diving a little deeper, the country’s demographic breakdowns have also changed significantly over the last 100+ years. While the share of men and women is an obvious near-even split, age and race distributions have changed drastically.
For starters, though birth rates have remained fairly strong in the U.S., they have been slowing over time. This is similar to many other Western countries, and can eventually result in a larger share of elderly people as well as an increased financial cost of subsidizing their care. Additionally, fewer births results in a depleting workforce as the young population shrinks.
The shares of Black, Asian, Hispanic, and people of two or more races have also been growing. In fact, between 2010–2020 the population of people identifying as two races or more increased by a whopping 276%.
Here’s a glance at some of the other demographic growth rates over the 2010-2020 period:
- Black or African American alone population: +5.6%
- Asian alone population: +35.5%
- Hispanic or Latino alone population: +23%
- White population: -9%
Looking Ahead
Like many countries, a “graying” of the population will become a concern in the United States.
By 2060, it is expected that 95 million Americans will be over 65. But the share of those 18 and under will also continue to grow (albeit at a much slower pace) from 74 million people in 2020 to 80 million in 2060.
Another interesting insight from the Census Bureau is that from 2016–2060, the American-born population is expected to grow by only 20%, whereas the foreign-born population—the share of population who will immigrate to the U.S.—is expected to rise 58%.
True to the melting pot moniker, America’s demographics will continue to change dramatically over the coming decades.
https://www.zerohedge.com/economics/visualizing-americas-changing-demographics-over-past-100-years
November 17, 2022
LyondellBasell Evaluates Propylene Expansion Project
HOUSTON, Nov. 17, 2022 /PRNewswire/ — LyondellBasell (NYSE: LYB) today announced it is evaluating the expansion of its propylene production capacity at its Channelview Complex near Houston, TX. The potential expansion would involve building a new propylene facility using LyondellBasell’s existing technology to convert ethylene into propylene for use in the production of polypropylene and propylene oxide. The related product lines are used to make everyday items such as flexible foam for mattresses, cosmetic packaging, electrical covering for 5G network infrastructure, plastic wrap for food packaging, medical syringes, vehicle bumpers, furniture upholstery and pipe for home plumbing, to name a few.
“In addition to the lower carbon emissions than competing technologies, we believe the project has more favorable economics compared to other production methods,” said Ken Lane, Executive Vice President Global Olefins & Polyolefins. “The products offered through this investment will be an important element to helping our value chain partners achieve their long-term sustainability ambitions. Additionally, this upstream investment would allow us to be less dependent on propylene market supply and demand, providing us with the opportunity to serve growing customer needs better.”
A final investment decision on this 400 kiloton propylene expansion project is expected towards the end of next year. The project would have an annual capacity of 950 million pounds per year. It would increase the company’s propylene capacity at the Channelview Complex by more than 35 percent and would create approximately 10-15 new jobs.
https://lyondellbasell.mediaroom.com/index.php?s=43&item=1423
November 16, 2022
Los Angeles imports keep sinking as East Coast gains more ground
LA October imports fell 28% year on year, 2% month on month
· Tuesday, November 15, 2022

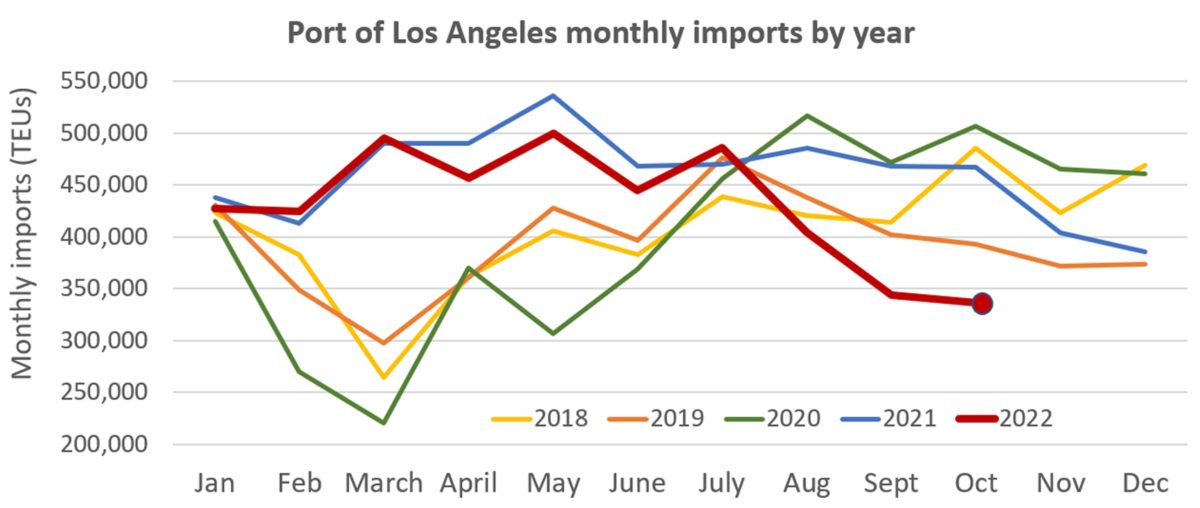
The Port of Los Angeles reported yet another month of falling volumes on Tuesday, as the import pendulum continues to swing away from the West Coast and toward container shipping gateways on the East and Gulf coasts.
Los Angeles’ total throughput for October came in at 678,429 twenty-foot equivalent units, down 25% versus October 2021.
Imports totaled 336,307 TEUs, down 28% year on year.
It was the lowest October import tally since 2009 amid the global financial crisis and the lowest monthly imports since May 2020 at the height of the COVID lockdowns. This October’s imports were down 14% from October 2019 prior to the pandemic.
On a positive note, the huge month-on-month slide seen in Los Angeles in September has slowed. Imports fell 15% in September versus August. October’s imports declined only 7,155 TEUs (i.e., a single shipload) or 2% versus September.
During Tuesday’s news conference, Port of Los Angeles Executive Director Gene Seroka said carriers “blanked” (canceled) 20 sailings in October, removing about 25% of normal service. An additional 20 sailings have been blanked in November and December combined.
“November numbers will be soft, and so will December,” Seroka acknowledged.
‘We need to get labor peace’
Seroka blamed “the steep decline” on three factors: a lack of a West Coast port labor contract, an early peak season and lower consumer spending on durables compared to purchases during the pandemic.
Both Seroka and Los Angeles Mayor Eric Garcetti repeatedly highlighted the labor issue during the news conference. The previous West Coast port labor agreement expired on July 1.
Seroka said that he has been on a “whistlestop tour” and “knocking on doors,” speaking to shippers and carriers in the U.S., Asia and Europe and “looking to get that allocation back to Los Angeles.” But he admitted that “it starts with getting a labor agreement … where they can feel that certainty of the cargo flow and getting to market on time.”
Garcetti stressed “we need to get labor peace and an agreement done.” However, he insisted “there will not be a strike. I don’t say this as someone trying to market [Los Angeles], but the remaining issues are so much more minor than in past years when we’ve been able to resolve this.”
Regarding the cargo shift to the East Coast and the Port of New York/New Jersey recently unseating Los Angeles as America’s busiest port, Seroka said, “We’ve been in the No. 1 position here for 22 consecutive years, and one or two months [in second place] is not going to create a trend. Our dwell times have improved and the ship backlog is nearly gone. We’re eager to ramp volume back up.”
Long Beach month-on-month decline worse than LA’s
Declines in Los Angeles were mirrored in the neighboring Port of Long Beach, highlighting the pressures facing West Coast ports.
On Thursday, Long Beach reported a 24% year-on-year drop in imports to 293,924 TEUs. It was the port’s lowest import number in any month since April 2020 at the beginning of the pandemic. It was Long Beach’s lowest import total for the month of October since 2012 and was down 13% from October 2019, pre-pandemic.
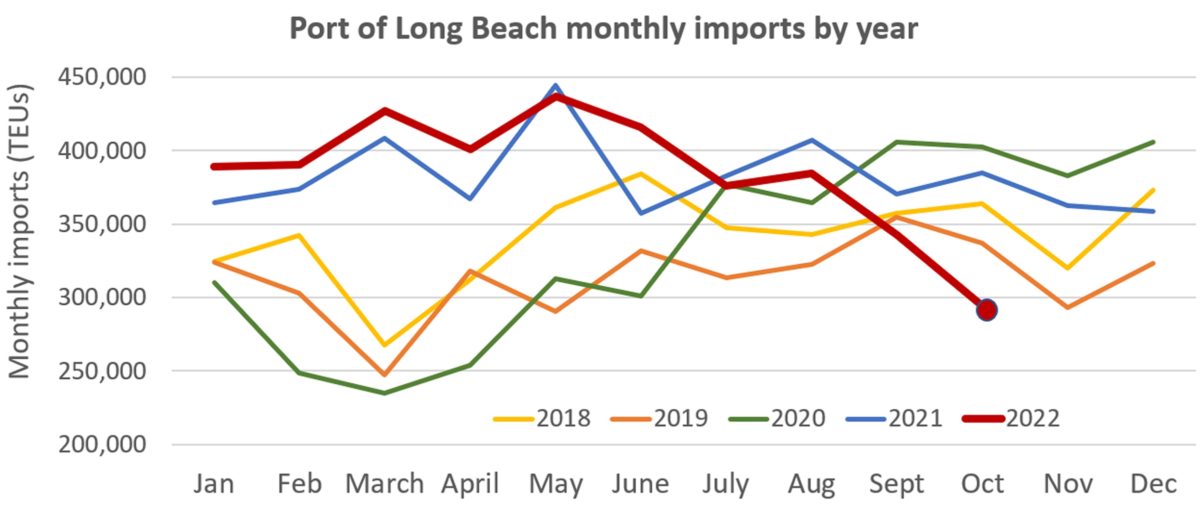
October imports sank 48,747 TEUs or 14% in October versus September, a much steeper month-on-month decline than in Los Angeles.
East Coast ports take more market share
The import picture at East and Gulf Coast ports remains in stark contrast to the situation at West Coast ports. These ports are still near their all-time highs.
On Monday, Savannah, Georgia, reported October imports of 263,828 TEUs, its second best monthly total ever behind the record reached in August. It was the port’s best-ever October for imports, up 2% year on year and up 32% from October 2019, pre-COVID.
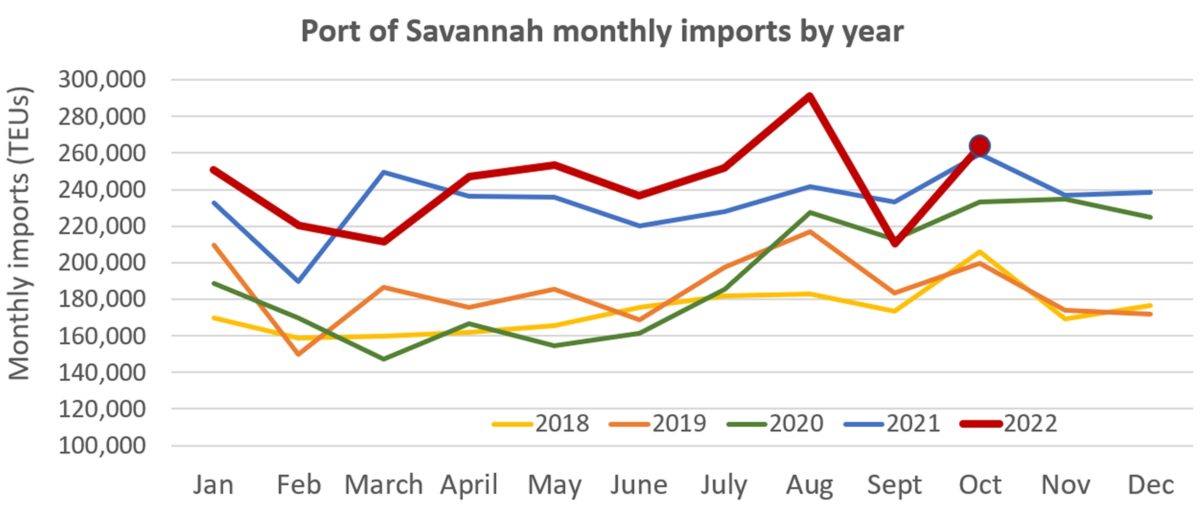
Savannah posted an increase of 53,461 TEUs or 25% in October versus September, when imports were depressed by the Hurricane Ian closure.
In its monthly release in October, the port said it expected to clear its anchorages by the end of November. That is proving too optimistic: As of Tuesday, there were still 33 container vessels at anchor off the coast of Georgia.
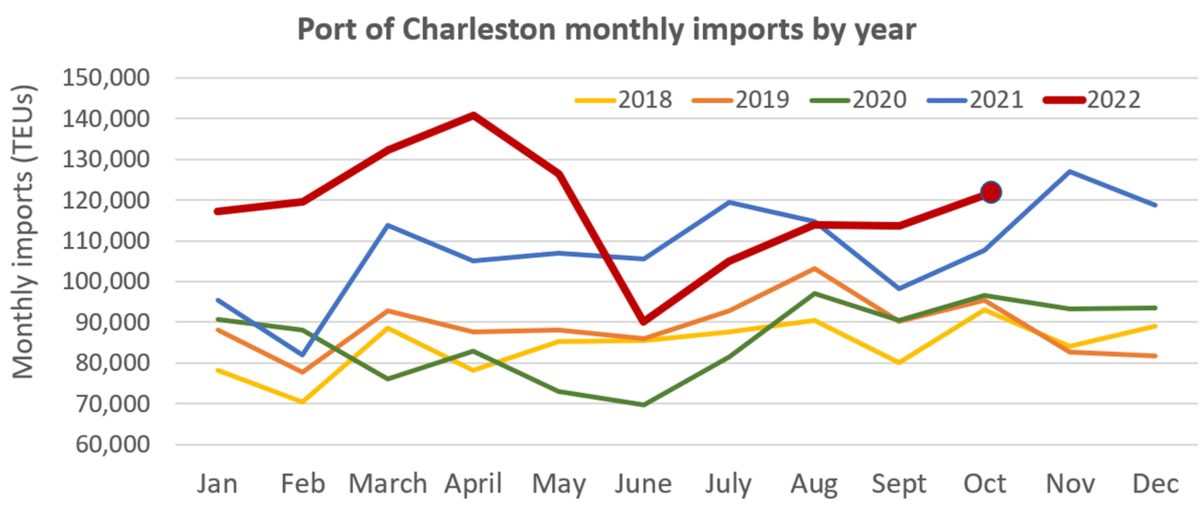
The Port of Charleston in South Carolina also reported its October throughput on Monday. Loaded imports came in at 121,305 TEUs, up 13% year on year, 7% month on month and 27% versus October 2019, pre-pandemic. It was Charleston’s best October for imports ever and its fifth-highest monthly import total.
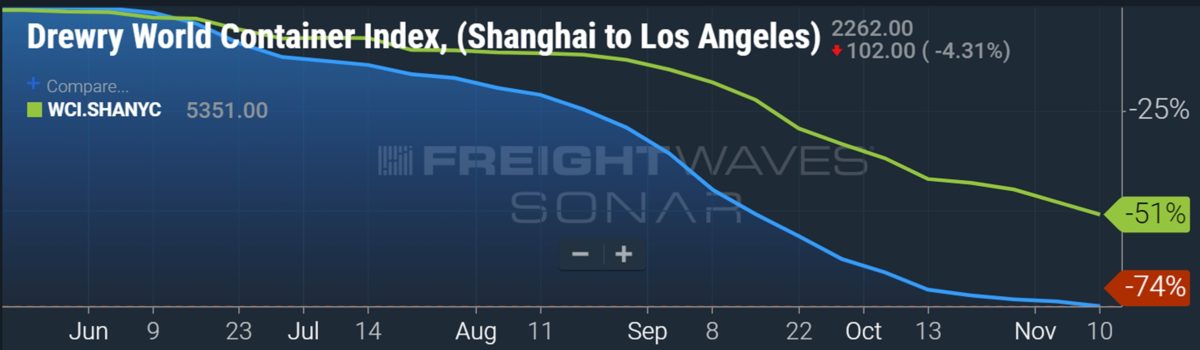
As a result of higher demand and greater congestion, spot rates to the East Coast have not fallen as fast as rates to the West Coast over the past six months. Blue line: Shanghai-Los Angeles. Green line: Shanghai-New York (Chart: FreightWaves SONAR)