Asian Markets
October 1, 2021
PO in China
SunSirs: Propylene Oxide Prices Rose Slightly in September
http://www.chemnet.com Sep 30,2021 SunSirs
Price trend
According to the monitoring data of SunSirs, as of September 29, the average price of propylene oxide from enterprises was 17,333.33 RMB/ton, an increase of 8.11% compared with the price on September 1 (the reference price of propylene oxide was 16,033.33 RMB/ton). The price rose 17.12% in a three-month cycle.
Analysis review
The propylene oxide market rose slightly in September. In early September, as the inventory dropped to a low level, the factory offered a strong market offer, and the downstream new orders were average, downstream followed up passively and the price rose slightly. In mid-September, under the influence of the “dual control” policy, manufacturers stopped or reduced the load in varying degrees, the overall market supply had shrunk, the transaction had improved, and the price had risen again. In late September, some installations were operating at low load, and the market supply was still tight. The tight balance between supply and demand drove the market upward. As the end of the month, the production restriction policy affected propylene oxide and the downstream start-up load. The market was relatively stable, the overall trading atmosphere was average, and the market was running steadily.
Upstream propylene, according to data from SunSirs’bulk list, as of September 28, the reference price of propylene was 7,965.67 RMB/ton, which was a 3.6% increase compared with the price on September 1 (7,688.55 RMB/ton).
Downstream propylene glycol, according to the monitoring data of SunSirs, as of September 28, the reference price of propylene glycol was 21,100.00 RMB/ton, an increase of 23.63% compared with the price on September 1 (17,066.67 RMB/ton); Downstream soft foam polyether, the mainstream price of soft foam polyether in Shandong on September 29 was around 17,300-17,700 RMB/ton.
Market outlook
The propylene oxide analysts of SunSirs believe that, on the whole, the current cost impact is limited, the downstream polyether new orders are generally traded, and the overall market atmosphere is sluggish. It is expected that in the short term, the propylene oxide market may be mainly wait-and-see. More attention needs to be paid to changes in supply and demand.
September 29, 2021
China Update
China economy to slow as industries struggle from power crunch
Author: Fanny Zhang
2021/09/29
SINGAPORE (ICIS)–China’s economic prospects are being weighed down by an ongoing power crunch in a huge swathe of the country, threatening overall industrial production, with much tighter controls on energy consumption in place in selected provinces in September.
Some investment banks have shaved their GDP growth forecast for the second-biggest economy below 8% as industries struggle from power shortage stemming from high coal prices, and efforts by some provinces to keep within their respective energy consumption targets in the third quarter.
Goldman Sachs now expects China to post a 7.8% GDP growth in 2021, down from its previous forecast of 8.2%.
The US investment bank cited “significant downside pressures” from major industrial output cuts caused by power outages, which affect an estimated 44% of the country’s industrial activity.
China-based investment bank China International Capital Corp (CICC) expects the GDP drag would be 0.1-0.15 percentage point in both the third and fourth quarters, with overall industrial output to be reduced by 1.3%-1.5%.
A prolonged production cut could shave China’s fourth-quarter GDP growth by a full percentage point, according to US-based investment bank Morgan Stanley.
Japan-based Nomura has likewise revised down its full-year GDP forecast for China to 7.7% from 8.2% previously, with third-quarter and fourth-quarter growths projected to come in at 4.7% and 3%, respectively.
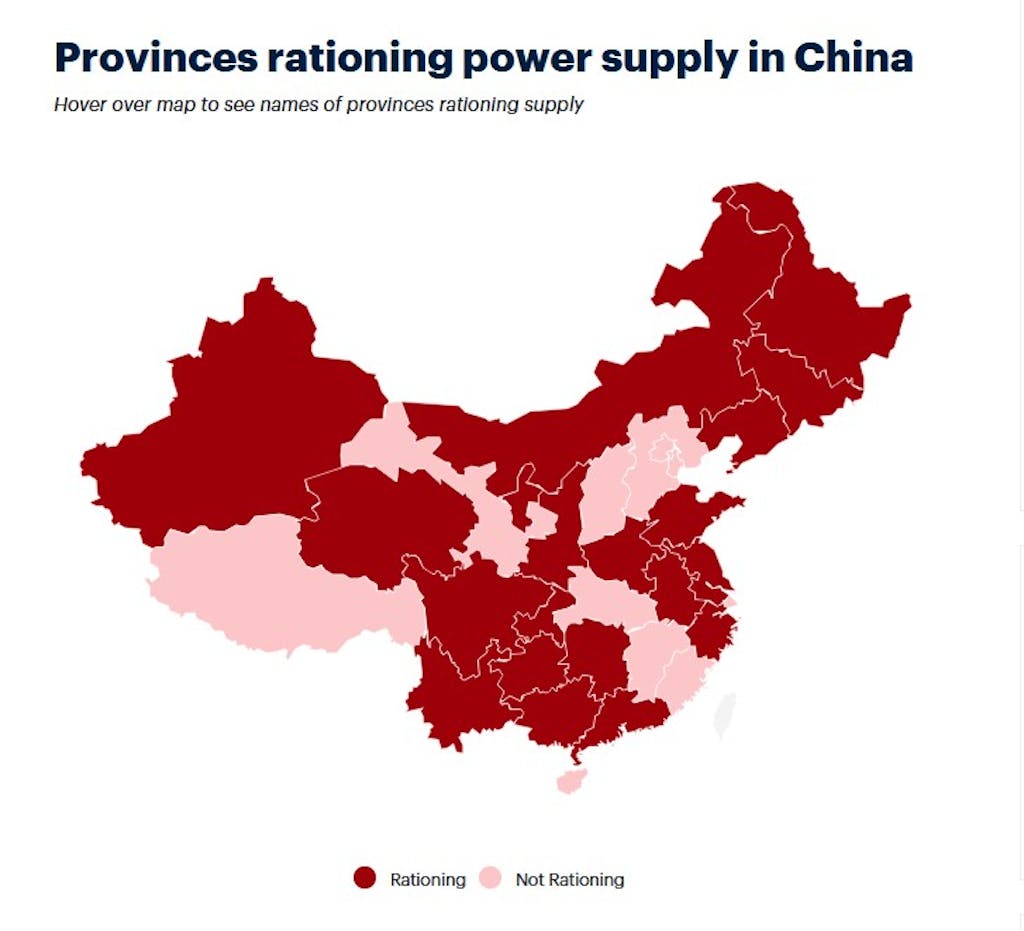
Power rationing is now in place at 20 of the 31 provinces/municipalities in mainland China, with coal-based power plants running at reduced rates to stem losses arising from high feedstock costs. https://e.infogram.com/5e89a67b-46d1-4592-9a81-1604a5610c85?parent_url=https%3A%2F%2Fwww.icis.com%2Fexplore%2Fresources%2Fnews%2F2021%2F09%2F29%2F10689696%2Fchina-economy-to-slow-as-industries-struggle-from-power-crunch&src=embed#async_embed
China has been leading the global economic rebound from a pandemic-driven slump in 2020, having successfully contained COVID-19 infections much earlier than the rest of the world.
Its industries have been working double time to accommodate increased export orders, thereby causing unprecedented spikes in energy consumption.
But the country also has a commitment to reduce carbon emissions, with specific annual targets on energy consumption set for each province, in line with the goal of achieving net-zero emissions by 2060, based on China’s 14th Five-Year Plan.
In September, some provinces well in excess of the limits on total energy consumption as well as intensity (consumption per GDP) in the first half of 2021 have moved to rectify the issue, aggravating the effects of the power shortage and hitting downstream industries hard.
Factories are being forced to cut production or shut operations, and in some regions, office buildings, shopping centres and even residential homes are affected.
Power companies are losing money from high cost of coal, said freelance economist Guan Qingyou.
Spot prices of coal – which accounts for 70% of China’s total power generation – nearly quadrupled from 2020 levels to $180/tonne, in line with strong gains in global commodity prices this year.
China’s energy challenges may not be resolved in the short term, Guan said.
Industrial production in China has weakened for five straight months, with the August official purchasing managers index (PMI) reading of 50.1 barely above the threshold for expansion.
Another concern looming in the background for the Chinese economy is the debt-saddled giant property developer Evergrande.
The company, which is China’s second-bigger property developer, has accumulated $305bn in debt, which was about 2% of China’s GDP.
Analysts said that Evergrande’s collapse is threatening stability of the Chinese property market, as well as financial system.
Focus article by Fanny Zhang
September 29, 2021
China Update
China economy to slow as industries struggle from power crunch
Author: Fanny Zhang
2021/09/29
SINGAPORE (ICIS)–China’s economic prospects are being weighed down by an ongoing power crunch in a huge swathe of the country, threatening overall industrial production, with much tighter controls on energy consumption in place in selected provinces in September.
Some investment banks have shaved their GDP growth forecast for the second-biggest economy below 8% as industries struggle from power shortage stemming from high coal prices, and efforts by some provinces to keep within their respective energy consumption targets in the third quarter.
Goldman Sachs now expects China to post a 7.8% GDP growth in 2021, down from its previous forecast of 8.2%.
The US investment bank cited “significant downside pressures” from major industrial output cuts caused by power outages, which affect an estimated 44% of the country’s industrial activity.
China-based investment bank China International Capital Corp (CICC) expects the GDP drag would be 0.1-0.15 percentage point in both the third and fourth quarters, with overall industrial output to be reduced by 1.3%-1.5%.
A prolonged production cut could shave China’s fourth-quarter GDP growth by a full percentage point, according to US-based investment bank Morgan Stanley.
Japan-based Nomura has likewise revised down its full-year GDP forecast for China to 7.7% from 8.2% previously, with third-quarter and fourth-quarter growths projected to come in at 4.7% and 3%, respectively.
Power rationing is now in place at 20 of the 31 provinces/municipalities in mainland China, with coal-based power plants running at reduced rates to stem losses arising from high feedstock costs. https://e.infogram.com/5e89a67b-46d1-4592-9a81-1604a5610c85?parent_url=https%3A%2F%2Fwww.icis.com%2Fexplore%2Fresources%2Fnews%2F2021%2F09%2F29%2F10689696%2Fchina-economy-to-slow-as-industries-struggle-from-power-crunch&src=embed#async_embed
China has been leading the global economic rebound from a pandemic-driven slump in 2020, having successfully contained COVID-19 infections much earlier than the rest of the world.
Its industries have been working double time to accommodate increased export orders, thereby causing unprecedented spikes in energy consumption.
But the country also has a commitment to reduce carbon emissions, with specific annual targets on energy consumption set for each province, in line with the goal of achieving net-zero emissions by 2060, based on China’s 14th Five-Year Plan.
In September, some provinces well in excess of the limits on total energy consumption as well as intensity (consumption per GDP) in the first half of 2021 have moved to rectify the issue, aggravating the effects of the power shortage and hitting downstream industries hard.
Factories are being forced to cut production or shut operations, and in some regions, office buildings, shopping centres and even residential homes are affected.
Power companies are losing money from high cost of coal, said freelance economist Guan Qingyou.
Spot prices of coal – which accounts for 70% of China’s total power generation – nearly quadrupled from 2020 levels to $180/tonne, in line with strong gains in global commodity prices this year.
China’s energy challenges may not be resolved in the short term, Guan said.
Industrial production in China has weakened for five straight months, with the August official purchasing managers index (PMI) reading of 50.1 barely above the threshold for expansion.
Another concern looming in the background for the Chinese economy is the debt-saddled giant property developer Evergrande.
The company, which is China’s second-bigger property developer, has accumulated $305bn in debt, which was about 2% of China’s GDP.
Analysts said that Evergrande’s collapse is threatening stability of the Chinese property market, as well as financial system.
Focus article by Fanny Zhang
September 28, 2021
More on China Energy Programs
China’s crackdown on intensive energy use ripples across petrochemical sector
Highlights
Cracker, PDH plants mull output cuts, hikes amid impact on margins
Coal shortage further constrains operations in coal-olefin sector
Bigger producers can gain — if they manage energy costs
China’s increasingly strident efforts to curb intensive energy use and hasten carbon emission cuts are prompting petrochemical makers using LPG or naphtha as feedstock to adjust run rates in response to the various impacts the move is having across the petrochemical sector.
The crackdown comes at a time when prices of LNG, a cleaner but costlier alternative to coal as a generating fuel, are rallying ahead of winter and coal usage by households for heating is being prioritized over industrial requirements amid low stockpiles and concerns over generation capacity.
The coal shortage is constraining operations in the coal-olefin industry, while higher LNG costs for generation are impacting the economics of petrochemical plants that use other feedstocks.
China’s total electricity consumption rose 13.8% over January-August, outpacing an 11.3% increase in power generation over the same period, National Development and Reform Commission data showed.
The coal-olefin sector has cut runs to reduce intense power usage after the Yuan 126 billion ($19.6 billion) coal-olefins plant in northwest Shaanxi province was suspended for flouting energy consumption limits.
That sector is estimated to account for 20%-25% of China’s polypropylene production. The rest is estimated to come from oil — mainly naphtha cracking at steam crackers — at 55%, with LPG cracking at propane and mixed alkane dehydrogenation plants accounting for 12%-14% and methanol around 6%, according to data from domestic information provider Longzhong and industry sources.
LPG demand from the chemical and petrochemical sectors was estimated to account for more than half of China’s total LPG demand in 2020, Longzhong data showed.
Coal-fired power plants generate around 50% of China’s electricity supply.
Lower PP output
Reduced PP production from coal-olefin plants could result in higher PP margins, which could theoretically provide more market share for the LPG cracking sector, including PDH plants and boost LPG demand by 10%, a trade source with China Gas said.
However, operating rates at some PDH plants, especially those in eastern Jiangsu and southern Guangdong provinces, are also expected to be affected by local governments’ power-rationing policies, market sources said.
The NDRC has alerted 10 provinces or regions including Guangdong, Jiangsu, Yunnan, Fujian, Shaanxi, Guangxi, Ningxia, Qinghai, Xinjiang and Hubei that they have not met energy-consumption targets for the first half of 2021.
Guangdong recently imposed a new round of power rationing on industrial users, cutting their power supply for 4-5 days a week, according to a report by the province’s development and reform commission Sept. 25.
Dongguan Juzhengyuan in Guangdong shut its PDH plant for four days in September due to power rationing, reducing its operating rate to 69.75% from full capacity in August, according to domestic energy information provider JLC.
Jiangsu has also enforced power rationing on industrial users, supplying power for two days and cutting supply for two days, local media reported.
Oriental Energy has lowered the operating rate at its Zhangjiagang PDH plant in Jiangsu in September due to power rationing, market sources said.
Crunching margins were also constraining operating rates at many PDH plants. Their LPG feedstock import costs have risen significantly in recent months, while the domestic price of their propylene has lagged far behind amid weak demand from downstream plants.
Chemical and petrochemical plants are also considered energy-intensive enterprises and their operating rates have been limited or cut by some local governments, domestic media reported.
“We are still watching for more government announcements regarding the power cut issue,” an industry source said. “So far we are not expecting much impact on the PDH side, more on the coal-to-olefin side. As for crackers/PDH plants, as long as they are not under maintenance or facing technical issues, they will be running at maximum rates.”
LPG demand boost
But another trade source said power cuts by provinces and shrinking margins had prompted SP Chemical to lower operating rates at its 700,000 mt/year LPG-based cracker at Taixing in Jiangsu to 60-70% of capacity, while a company source said Jiangsu Sailboat Petrochemical was delaying the restart of its methanol-to-olefins plant.
The trade source said major petrochemical producers that were able to afford and procure alternative generating fuel such as LNG or Russian piped gas – as happened in 2018 – could boost operating rates at PDH plants or steam crackers to leverage the prospects of higher PP margins.
Soaring LNG prices have encouraged some factories, mostly ceramic makers, to switch to LPG as burning fuel from natural gas. This was expected to lift LPG demand to a limited extent, a trade source in Shanghai said.
Natural gas demand from the power generation sector was estimated to comprise 16% of China’s total gas demand in 2020, National Energy Administration data showed.
Regional LPG prices hovering near seven-year highs have prompted some ethylene producers to switch to cheaper naphtha as feedstock, though this is estimated to reduce LPG demand by less than 10%, another source said.
“The strength of naphtha is because of expensive LPG. There is more demand from petrochemical producers as they are cutting their use of butane and propane in cracking,” a Singapore-based naphtha trader said.
But one Chinese petrochemical source said trading firm Unipec was heard buying less naphtha than in previous years, and increasing imports of light crude.