Current Affairs
December 26, 2023
HPPO (Hippo) Process Hurdles
Net Profit for PO Produced in China Using HPPO Process Averages About CNY -275/tonne
PUdaily | Updated: December 21, 2023
Currently, hydrogen peroxide is an important raw material for producing propylene oxide (PO), and 27.5% hydrogen peroxide plays a dominant role in domestic market. In recent years, however, hydrogen peroxide with a concentration of over 50% has been increasingly used as it can help increase the productivity of PO facilities and improve product quality. In HPPO process, PO is manufactured through direct oxidation of propylene with hydrogen peroxide (mostly with a 50-70% concentration). Specifically, at low temperature and low pressure in a fixed bed reactor, selective oxidation reaction occurs between propylene and hydrogen peroxide in the mixture of methanol and water and in the presence of the titanium silicalite (TS-1) catalyst. Featuring short process, high atom utilization, low investment, mild reaction conditions, high energy efficiency, no pollution, high product yield and few by-products, HPPO is internationally recognized as a green production technology.
Previously, the core technologies for HPPO process were monopolized by a handful of global chemical giants such as BASF, Dow Chemical, Evonik and Uhde. This provided a bargaining chip for them to ask high prices for technology transfer. Specifically, the fee for licensing PO manufacturing technology was tens of millions of euros, and additional fee was charged for hydrogen peroxide production technology, which was tied to the sale of the former technology. The result is meagre profit for PO produced using this process, averaging about CNY -275/tonne, according to Suntower.
Presently, Jilin Shenhua and Sinopec Changling Refining & Chemical are the two established PO manufacturers using HPPO process. In 2011, making an investment of CNY 2.5 billion, Jilin Shenhua brought in the HPPO process jointly developed by Degussa and Uhde to build a 300kt/a PO facility in Jilin province, the first and largest of its kind in China and coming online in July 2014. In 2013, Sinopec Changling Refining & Chemical invested approximately CNY 1.28 billion to build a 100kt/a industrial plant using its proprietary HPPO process. In July 2014, interim handover of the project was completed. And on December 6, trial run was successfully conducted, marking that Sinopec became the third company in the world owing patented HPPO process. In April 2023, Shandong Jincheng Petrochemical’s 300kt/a PO facility, with an ancillary 900kt/a hydrogen peroxide plant, successfully produced premium-grade propylene oxide. In May, Qixiang Tengda Chemical put into production its 300kt/a PO unit using HPPO technology jointly developed by Evonik and thyssenkrupp. In August, Taixing Yida Chemical’s HPPO-based 150kt/a PO project was completed. Suntower estimates that the current PO capacity using HPPO process stands at 1.55 million tonnes per year, accounting for about 45% of the total PO capacity.
If you are interested in the information about costs of different PO production processes and other relevant information, please contact us or subscribe to the 2023 Asia-Pacific PO Market Report.
Contact information:
Tel: 021- 61250980
Website: www. pudaily.com
Email: marketing@pudaily.com
Address: Room 607, Building B, Rhine Hongjing Center, 1439 Wuzhong Road, Minhang District, Shanghai
December 18, 2023
Truckload Freight Improving
Truckload supply and demand on collision course in 2024
Data gives reason for optimism for economy and transportation market next year
Zach Strickland, FW Market Expert & Market Analyst
· Saturday, December 16, 2023

Listen to this article
4 min
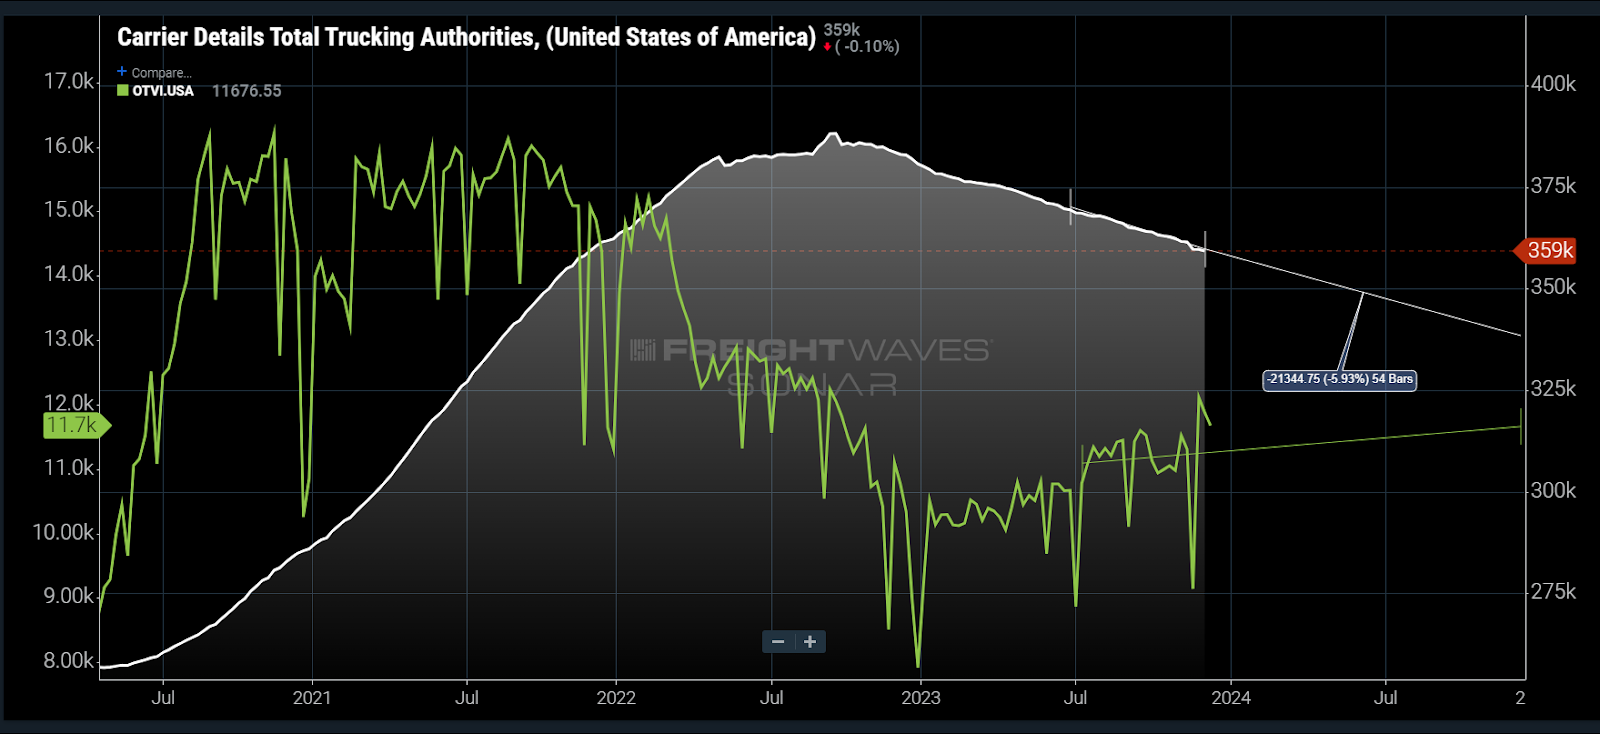
Chart of the Week: Carrier Details Total Trucking Authorities, Outbound Tender Volume Index – USA SONAR: CDTTA.USA, OTVI.USA
Trucking demand is up while capacity is down since this time last year. This statement by itself means that the transportation market is healthier, but it also suggests that 2024 should be better in aggregate as the gap between supply and demand narrows quickly.
Truckload demand is barely a shadow of what it was during the pandemic, but it has been growing throughout most of 2023. This fact has been invisible to most carriers and 3PLs, which continue to deal with a massive glut of oversupplied capacity thanks to a record number of entrants in 2020-21 according to Carrier Details Total Trucking Authorities data set.
Tender volumes are averaging over 10% higher year over year this December and have been growing steadily since last winter. Outside of October, daily tender volumes moved higher, suggesting that economic demand for goods has grown.
On this past week’s Freightonomics episode, Zac Rogers, an associate professor of supply chain management at Colorado State and co-author of the Logistics Managers’ Index (LMI), suggested that the demand growth was a product of both inventories having been rightsized versus this time last year and growth in consumption.
While he admits that there is some ongoing concern about consumer health, the numbers are what they are. Anthony Smith, FreightWaves’ chief economist, responded to his concerns with a resounding “never bet against the American consumer.”
Possibly the most shocking revelation was in the LMI outlook of transportation prices by respondents. The LMI is divided up into multiple measures of logistics activity such as transportation and warehousing prices and capacity. Values above 50 indicate expansion while values below 50 are contractionary.
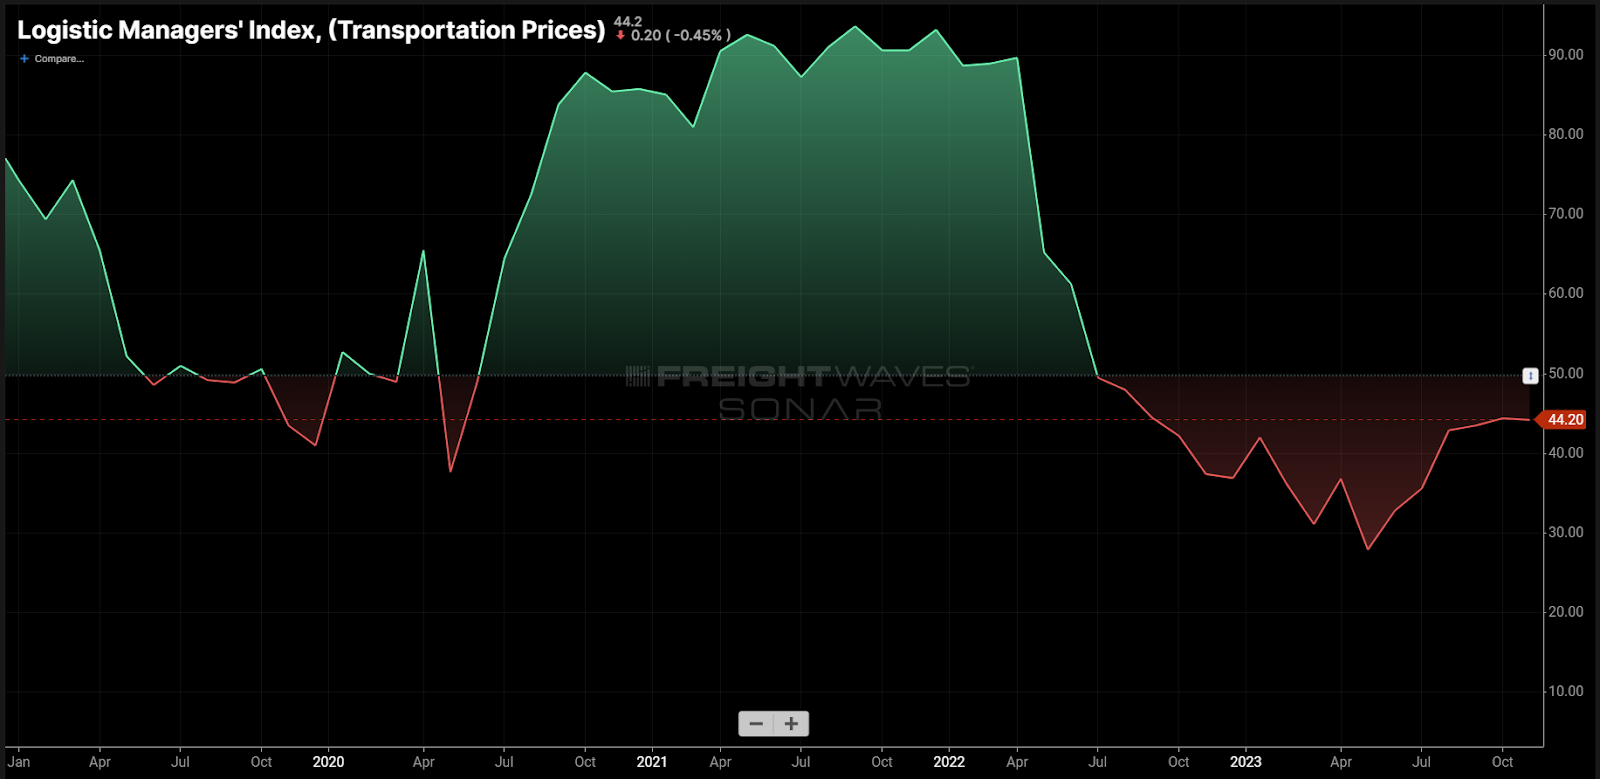
The transportation pricing component has averaged a value of 38 in 2023 and has been showing below 50 since the summer of 2022. Respondents to the November survey showed a reading of around 64 for prices in 2024, indicating that most expect rates to have bottomed.
While every forecast is an opinion on some level, the data does suggest that the supply of capacity and demand for its use is moving back toward equilibrium at a relatively fast clip.
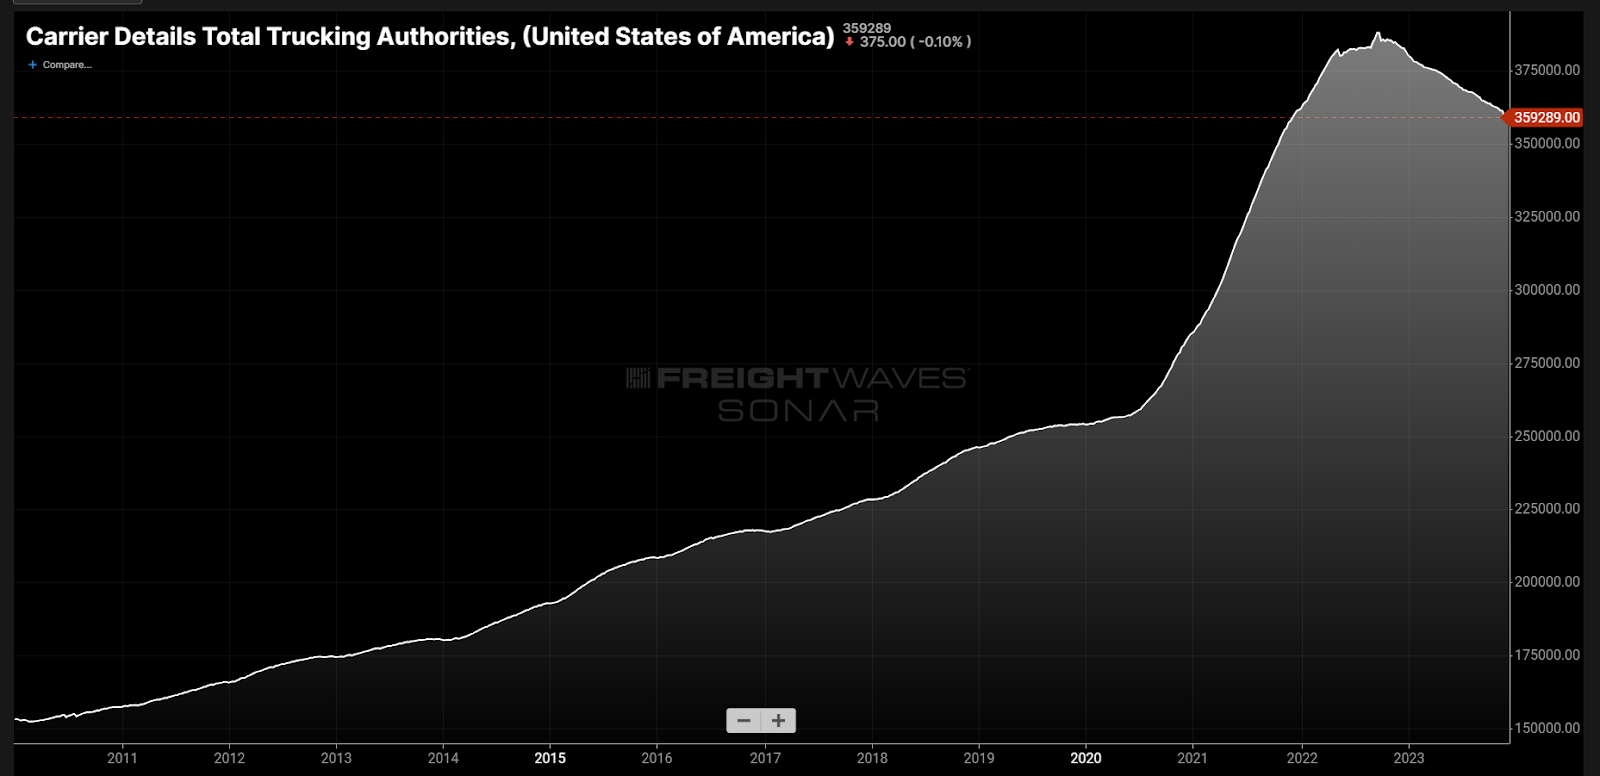
Looking at the past 13 years of Carrier Details Total Trucking Authorities data, there has never been such a strong downward trend. This of course is following the historic growth rate — the definition of an economic bubble.
FreightWaves CEO Craig Fuller stated in this past week’s State of Freight webinar that the risk is growing for shippers in 2024. Taking an overly aggressive approach to cost cutting would be much more risky than last year. No capacity is guaranteed. Even the strongest carriers feel this level of market downturn.
While Fuller admitted that he does not definitively know that the market will turn, there are several LMI respondents that feel similarly that there will be noticeable signs of tightening by the end of next year.
Economically speaking, there are still questions, but the answers are coming into focus with time. At the very least, the U.S. has economically overachieved versus many expectations, which does provide hope for the “soft landing” many have wanted.
Unfortunately, the solution to the freight market means that several first have to lose. This has been the case for many sectors post-pandemic. But this too is passing.
About the Chart of the Week
The FreightWaves Chart of the Week is a chart selection from SONAR that provides an interesting data point to describe the state of the freight markets. A chart is chosen from thousands of potential charts on SONAR to help participants visualize the freight market in real time. Each week a Market Expert will post a chart, along with commentary, live on the front page. After that, the Chart of the Week will be archived on FreightWaves.com for future reference.
SONAR aggregates data from hundreds of sources, presenting the data in charts and maps and providing commentary on what freight market experts want to know about the industry in real time.
The FreightWaves data science and product teams are releasing new datasets each week and enhancing the client experience.
December 18, 2023
Global Debt
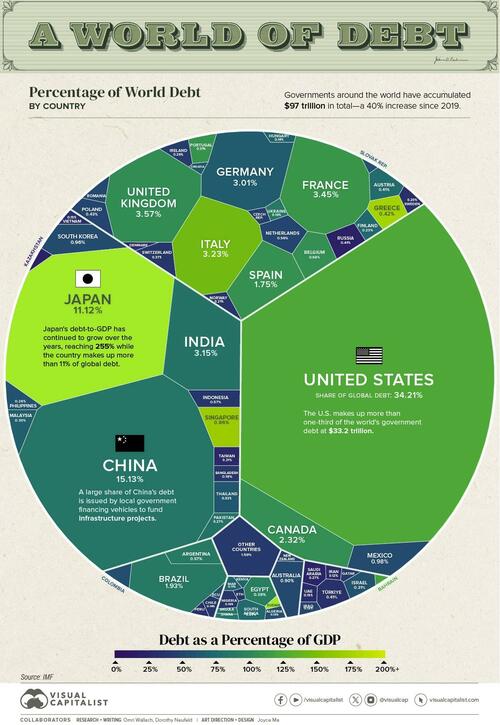
Visualizing $97 Trillion Of Global Debt In 2023
by Tyler Durden
Monday, Dec 18, 2023 – 06:55 AM
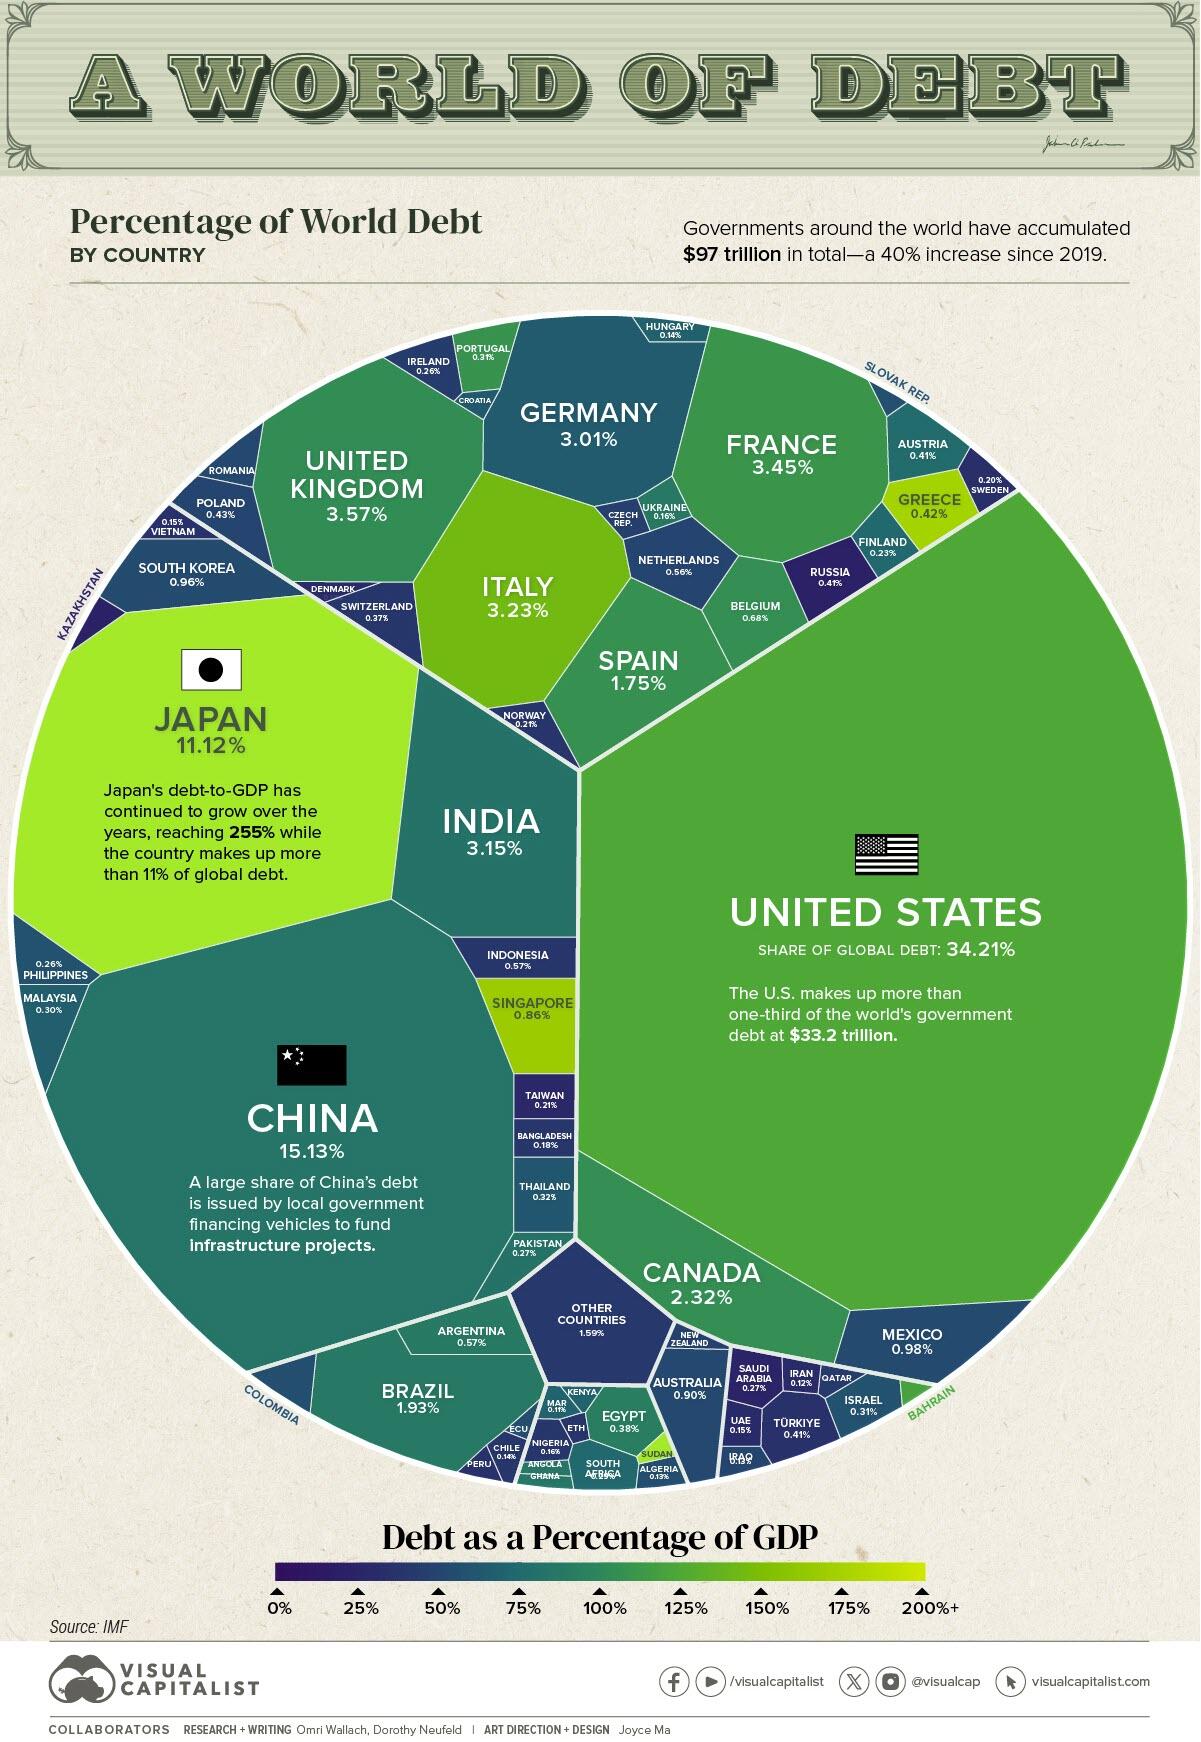
Global government debt is projected to hit $97.1 trillion this year, a 40% increase since 2019.
During the COVID-19 pandemic, governments introduced sweeping financial measures to support the job market and prevent a wave of bankruptcies. However, this has exposed vulnerabilities as higher interest rates are amplifying borrowing costs.
In the graphic below, Visual Capitalist’s Niccolo Conte and Dorothy Neufeld show global debt by country in 2023, based on projections from the International Monetary Fund (IMF).
Debt by Country in 2023
Below, we rank countries by their general government gross debt, or the financial liabilities owed by each country:
| Country | Gross Debt (B) | % of World Total | Debt to GDP |
|---|---|---|---|
| 🇺🇸 U.S. | $33,228.9 | 34.2% | 123.3% |
| 🇨🇳 China | $14,691.7 | 15.1% | 83.0% |
| 🇯🇵 Japan | $10,797.2 | 11.1% | 255.2% |
| 🇬🇧 UK | $3,468.7 | 3.6% | 104.1% |
| 🇫🇷 France | $3,353.9 | 3.5% | 110.0% |
| 🇮🇹 Italy | $3,141.4 | 3.2% | 143.7% |
| 🇮🇳 India | $3,056.7 | 3.1% | 81.9% |
| 🇩🇪 Germany | $2,919.3 | 3.0% | 65.9% |
| 🇨🇦 Canada | $2,253.3 | 2.3% | 106.4% |
| 🇧🇷 Brazil | $1,873.7 | 1.9% | 88.1% |
| 🇪🇸 Spain | $1,697.5 | 1.7% | 107.3% |
| 🇲🇽 Mexico | $954.6 | 1.0% | 52.7% |
| 🇰🇷 South Korea | $928.1 | 1.0% | 54.3% |
| 🇦🇺 Australia | $875.9 | 0.9% | 51.9% |
| 🇸🇬 Singapore | $835.0 | 0.9% | 167.9% |
| 🇧🇪 Belgium | $665.2 | 0.7% | 106.0% |
| 🇦🇷 Argentina | $556.5 | 0.6% | 89.5% |
| 🇮🇩 Indonesia | $552.8 | 0.6% | 39.0% |
| 🇳🇱 Netherlands | $540.9 | 0.6% | 49.5% |
| 🇵🇱 Poland | $419.4 | 0.4% | 49.8% |
| 🇬🇷 Greece | $407.2 | 0.4% | 168.0% |
| 🇹🇷 Türkiye | $397.2 | 0.4% | 34.4% |
| 🇷🇺 Russia | $394.8 | 0.4% | 21.2% |
| 🇦🇹 Austria | $393.6 | 0.4% | 74.8% |
| 🇪🇬 Egypt | $369.3 | 0.4% | 92.7% |
| 🇨🇭 Switzerland | $357.7 | 0.4% | 39.5% |
| 🇹🇭 Thailand | $314.5 | 0.3% | 61.4% |
| 🇮🇱 Israel | $303.6 | 0.3% | 58.2% |
| 🇵🇹 Portugal | $299.4 | 0.3% | 108.3% |
| 🇲🇾 Malaysia | $288.3 | 0.3% | 66.9% |
| 🇿🇦 South Africa | $280.7 | 0.3% | 73.7% |
| 🇵🇰 Pakistan | $260.9 | 0.3% | 76.6% |
| 🇸🇦 Saudi Arabia | $257.7 | 0.3% | 24.1% |
| 🇮🇪 Ireland | $251.7 | 0.3% | 42.7% |
| 🇵🇭 Philippines | $250.9 | 0.3% | 57.6% |
| 🇫🇮 Finland | $225.0 | 0.2% | 73.6% |
| 🇳🇴 Norway | $204.5 | 0.2% | 37.4% |
| 🇨🇴 Colombia | $200.1 | 0.2% | 55.0% |
| 🇹🇼 Taiwan | $200.0 | 0.2% | 26.6% |
| 🇸🇪 Sweden | $192.9 | 0.2% | 32.3% |
| 🇷🇴 Romania | $178.7 | 0.2% | 51.0% |
| 🇧🇩 Bangladesh | $175.9 | 0.2% | 39.4% |
| 🇺🇦 Ukraine | $152.8 | 0.2% | 88.1% |
| 🇨🇿 Czech Republic | $152.2 | 0.2% | 45.4% |
| 🇳🇬 Nigeria | $151.3 | 0.2% | 38.8% |
| 🇦🇪 UAE | $149.7 | 0.2% | 29.4% |
| 🇻🇳 Vietnam | $147.3 | 0.2% | 34.0% |
| 🇭🇺 Hungary | $140.0 | 0.1% | 68.7% |
| 🇨🇱 Chile | $132.2 | 0.1% | 38.4% |
| 🇩🇰 Denmark | $126.7 | 0.1% | 30.1% |
| 🇮🇶 Iraq | $125.5 | 0.1% | 49.2% |
| 🇩🇿 Algeria | $123.5 | 0.1% | 55.1% |
| 🇳🇿 New Zealand | $115.0 | 0.1% | 46.1% |
| 🇮🇷 Iran | $112.1 | 0.1% | 30.6% |
| 🇲🇦 Morocco | $102.7 | 0.1% | 69.7% |
| 🇶🇦 Qatar | $97.5 | 0.1% | 41.4% |
| 🇵🇪 Peru | $89.7 | 0.1% | 33.9% |
| 🇦🇴 Angola | $79.6 | 0.1% | 84.9% |
| 🇰🇪 Kenya | $79.1 | 0.1% | 70.2% |
| 🇸🇰 Slovakia | $75.4 | 0.1% | 56.7% |
| 🇩🇴 Dominican Republic | $72.1 | 0.1% | 59.8% |
| 🇪🇨 Ecuador | $65.9 | 0.1% | 55.5% |
| 🇸🇩 Sudan | $65.5 | 0.1% | 256.0% |
| 🇬🇭 Ghana | $65.1 | 0.1% | 84.9% |
| 🇰🇿 Kazakhstan | $60.7 | 0.1% | 23.4% |
| 🇪🇹 Ethiopia | $59.0 | 0.1% | 37.9% |
| 🇧🇭 Bahrain | $54.5 | 0.1% | 121.2% |
| 🇨🇷 Costa Rica | $53.9 | 0.1% | 63.0% |
| 🇭🇷 Croatia | $51.2 | 0.1% | 63.8% |
| 🇺🇾 Uruguay | $47.0 | 0.0% | 61.6% |
| 🇯🇴 Jordan | $46.9 | 0.0% | 93.8% |
| 🇸🇮 Slovenia | $46.8 | 0.0% | 68.5% |
| 🇨🇮 Côte d’Ivoire | $45.1 | 0.0% | 56.8% |
| 🇵🇦 Panama | $43.5 | 0.0% | 52.8% |
| 🇲🇲 Myanmar | $43.0 | 0.0% | 57.5% |
| 🇴🇲 Oman | $41.4 | 0.0% | 38.2% |
| 🇹🇳 Tunisia | $39.9 | 0.0% | 77.8% |
| 🇷🇸 Serbia | $38.5 | 0.0% | 51.3% |
| 🇧🇴 Bolivia | $37.8 | 0.0% | 80.8% |
| 🇹🇿 Tanzania | $35.8 | 0.0% | 42.6% |
| 🇺🇿 Uzbekistan | $31.7 | 0.0% | 35.1% |
| 🇿🇼 Zimbabwe | $30.9 | 0.0% | 95.4% |
| 🇧🇾 Belarus | $30.4 | 0.0% | 44.1% |
| 🇬🇹 Guatemala | $29.1 | 0.0% | 28.3% |
| 🇱🇹 Lithuania | $28.7 | 0.0% | 36.1% |
| 🇸🇻 El Salvador | $25.8 | 0.0% | 73.0% |
| 🇺🇬 Uganda | $25.3 | 0.0% | 48.3% |
| 🇸🇳 Senegal | $25.2 | 0.0% | 81.0% |
| 🇨🇾 Cyprus | $25.2 | 0.0% | 78.6% |
| 🇱🇺 Luxembourg | $24.6 | 0.0% | 27.6% |
| 🇭🇰 Hong Kong SAR | $23.5 | 0.0% | 6.1% |
| 🇧🇬 Bulgaria | $21.7 | 0.0% | 21.0% |
| 🇨🇲 Cameroon | $20.6 | 0.0% | 41.9% |
| 🇲🇿 Mozambique | $19.7 | 0.0% | 89.7% |
| 🇵🇷 Puerto Rico | $19.6 | 0.0% | 16.7% |
| 🇳🇵 Nepal | $19.3 | 0.0% | 46.7% |
| 🇱🇻 Latvia | $18.9 | 0.0% | 40.6% |
| 🇮🇸 Iceland | $18.7 | 0.0% | 61.2% |
| 🇵🇾 Paraguay | $18.1 | 0.0% | 40.9% |
| 🇱🇦 Lao P.D.R. | $17.3 | 0.0% | 121.7% |
| 🇭🇳 Honduras | $15.7 | 0.0% | 46.3% |
| 🇵🇬 Papua New Guinea | $15.7 | 0.0% | 49.5% |
| 🇹🇹 Trinidad and Tobago | $14.6 | 0.0% | 52.5% |
| 🇦🇱 Albania | $14.5 | 0.0% | 62.9% |
| 🇨🇬 Republic of Congo | $14.1 | 0.0% | 97.8% |
| 🇦🇿 Azerbaijan | $14.1 | 0.0% | 18.2% |
| 🇾🇪 Yemen | $14.0 | 0.0% | 66.4% |
| 🇯🇲 Jamaica | $13.6 | 0.0% | 72.3% |
| 🇲🇳 Mongolia | $13.1 | 0.0% | 69.9% |
| 🇧🇫 Burkina Faso | $12.7 | 0.0% | 61.2% |
| 🇬🇦 Gabon | $12.5 | 0.0% | 64.9% |
| 🇬🇪 Georgia | $11.9 | 0.0% | 39.6% |
| 🇲🇺 Mauritius | $11.8 | 0.0% | 79.7% |
| 🇦🇲 Armenia | $11.8 | 0.0% | 47.9% |
| 🇧🇸 Bahamas | $11.7 | 0.0% | 84.2% |
| 🇲🇱 Mali | $11.0 | 0.0% | 51.8% |
| 🇲🇹 Malta | $11.0 | 0.0% | 54.1% |
| 🇰🇭 Cambodia | $10.9 | 0.0% | 35.3% |
| 🇧🇯 Benin | $10.6 | 0.0% | 53.0% |
| 🇲🇼 Malawi | $10.4 | 0.0% | 78.6% |
| 🇪🇪 Estonia | $9.0 | 0.0% | 21.6% |
| 🇨🇩 Democratic Republic of Congo | $9.0 | 0.0% | 13.3% |
| 🇷🇼 Rwanda | $8.8 | 0.0% | 63.3% |
| 🇳🇦 Namibia | $8.5 | 0.0% | 67.6% |
| 🇲🇬 Madagascar | $8.5 | 0.0% | 54.0% |
| 🇳🇪 Niger | $8.3 | 0.0% | 48.7% |
| 🇲🇰 North Macedonia | $8.2 | 0.0% | 51.6% |
| 🇧🇦 Bosnia and Herzegovina | $7.7 | 0.0% | 28.6% |
| 🇲🇻 Maldives | $7.7 | 0.0% | 110.3% |
| 🇬🇳 Guinea | $7.3 | 0.0% | 31.6% |
| 🇳🇮 Nicaragua | $7.2 | 0.0% | 41.5% |
| 🇧🇧 Barbados | $7.2 | 0.0% | 115.0% |
| 🇹🇬 Togo | $6.1 | 0.0% | 67.2% |
| 🇰🇬 Kyrgyz Republic | $6.0 | 0.0% | 47.0% |
| 🇲🇩 Moldova | $5.6 | 0.0% | 35.1% |
| 🇹🇩 Chad | $5.4 | 0.0% | 43.2% |
| 🇰🇼 Kuwait | $5.4 | 0.0% | 3.4% |
| 🇲🇷 Mauritania | $5.1 | 0.0% | 49.5% |
| 🇭🇹 Haiti | $5.1 | 0.0% | 19.6% |
| 🇬🇾 Guyana | $4.9 | 0.0% | 29.9% |
| 🇲🇪 Montenegro | $4.6 | 0.0% | 65.8% |
| 🇫🇯 Fiji | $4.6 | 0.0% | 83.6% |
| 🇹🇲 Turkmenistan | $4.2 | 0.0% | 5.1% |
| 🇹🇯 Tajikistan | $4.0 | 0.0% | 33.5% |
| 🇧🇼 Botswana | $3.9 | 0.0% | 18.7% |
| 🇬🇶 Equatorial Guinea | $3.8 | 0.0% | 38.3% |
| 🇸🇷 Suriname | $3.8 | 0.0% | 107.0% |
| 🇸🇸 South Sudan | $3.8 | 0.0% | 60.4% |
| 🇧🇹 Bhutan | $3.3 | 0.0% | 123.4% |
| 🇦🇼 Aruba | $3.2 | 0.0% | 82.9% |
| 🇸🇱 Sierra Leone | $3.1 | 0.0% | 88.9% |
| 🇨🇻 Cabo Verde | $2.9 | 0.0% | 113.1% |
| 🇧🇮 Burundi | $2.3 | 0.0% | 72.7% |
| 🇱🇷 Liberia | $2.3 | 0.0% | 52.3% |
| 🇽🇰 Kosovo | $2.2 | 0.0% | 21.3% |
| 🇸🇿 Eswatini | $2.0 | 0.0% | 42.4% |
| 🇧🇿 Belize | $1.9 | 0.0% | 59.3% |
| 🇱🇨 Saint Lucia | $1.8 | 0.0% | 74.2% |
| 🇬🇲 Gambia | $1.7 | 0.0% | 72.3% |
| 🇩🇯 Djibouti | $1.6 | 0.0% | 41.8% |
| 🇦🇬 Antigua and Barbuda | $1.6 | 0.0% | 80.5% |
| 🇸🇲 San Marino | $1.5 | 0.0% | 74.0% |
| 🇬🇼 Guinea-Bissau | $1.5 | 0.0% | 73.9% |
| 🇱🇸 Lesotho | $1.5 | 0.0% | 61.3% |
| 🇦🇩 Andorra | $1.4 | 0.0% | 37.7% |
| 🇨🇫 Central African Republic | $1.4 | 0.0% | 50.1% |
| 🇸🇨 Seychelles | $1.3 | 0.0% | 60.8% |
| 🇻🇨 Saint Vincent and the Grenadines | $0.9 | 0.0% | 86.2% |
| 🇬🇩 Grenada | $0.8 | 0.0% | 60.2% |
| 🇩🇲 Dominica | $0.7 | 0.0% | 93.9% |
| 🇰🇳 Saint Kitts and Nevis | $0.6 | 0.0% | 53.2% |
| 🇻🇺 Vanuatu | $0.5 | 0.0% | 46.8% |
| 🇰🇲 Comoros | $0.5 | 0.0% | 33.3% |
| 🇸🇹 São Tomé and Príncipe | $0.4 | 0.0% | 58.5% |
| 🇸🇧 Solomon Islands | $0.4 | 0.0% | 22.2% |
| 🇧🇳 Brunei Darussalam | $0.3 | 0.0% | 2.3% |
| 🇼🇸 Samoa | $0.3 | 0.0% | 36.2% |
| 🇹🇱 Timor-Leste | $0.3 | 0.0% | 16.4% |
| 🇵🇼 Palau | $0.2 | 0.0% | 85.4% |
| 🇹🇴 Tonga | $0.2 | 0.0% | 41.1% |
| 🇫🇲 Micronesia | $0.1 | 0.0% | 12.5% |
| 🇲🇭 Marshall Islands | $0.1 | 0.0% | 18.1% |
| 🇳🇷 Nauru | <$0.1 | 0.0% | 29.1% |
| 🇰🇮 Kiribati | <$0.1 | 0.0% | 13.1% |
| 🇹🇻 Tuvalu | <$0.1 | 0.0% | 8.0% |
| 🇲🇴 Macao SAR | <$0.1 | 0.0% | 0.0% |
| 🌐 World | $97,129.8 | 100% | 93.0% |
With $33.2 trillion in government debt, the U.S. makes up over a third of the world total.
Given the increasing debt load, the cost of servicing this debt now accounts for 20% of government spending. It is projected to reach $1 trillion by 2028, surpassing the total spent on defense.
The world’s third-biggest economy, Japan, has one of the highest debt to GDP ratios, at 255%. Over the last two decades, its national debt has far exceeded 100% of its GDP, driven by an aging population and social security expenses.
In 2023, Egypt faces steep borrowing costs, with 40% of revenues going towards debt repayments. It has the highest debt on the continent.
Like Egypt, several emerging economies are facing strain. Lebanon has been in default since 2020, and Ghana defaulted on the majority of its external debt—debt owed to foreign lenders—in 2022 amid a deepening economic crisis.
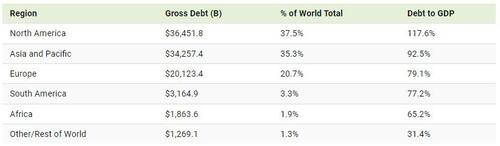
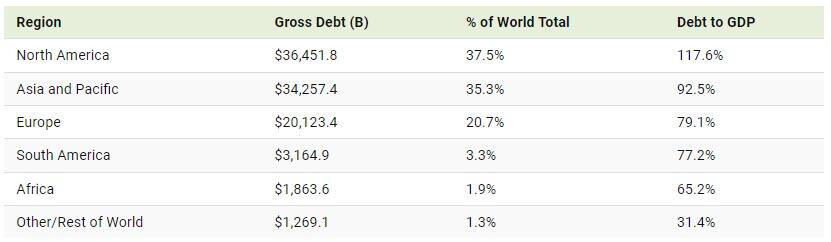
Global Debt: A Regional Perspective
How does debt compare on a regional level in 2023?
We can see that North America has both the highest debt and debt to GDP compared to other regions. Just as U.S. debt has ballooned, so has Canada’s—ranking as the 10th-highest globally in government debt outstanding.
Across Asia and the Pacific, debt levels hover close to North America.
At 3.3% of the global total, South America has $3.2 trillion in debt. As inflation has trended downwards, a handful of governments have already begun cutting interest rates. Overall, public debt levels are projected to stay elevated across the region.
Debt levels have also risen rapidly in Africa, with an average 40% of public debt held in foreign currencies—leaving it exposed to exchange rate fluctuations. Another challenge is that interest rates are also higher across the region compared to advanced economies, increasing debt-servicing costs.
By 2028, the IMF projects that global public debt will exceed 100% of GDP, hitting levels only seen during the pandemic.
https://www.zerohedge.com/markets/visualizing-97-trillion-global-debt-2023
December 10, 2023
Winter is Coming
“Winter Is Coming” For Leveraged Companies
by Tyler Durden
Friday, Dec 08, 2023 – 12:45 PM
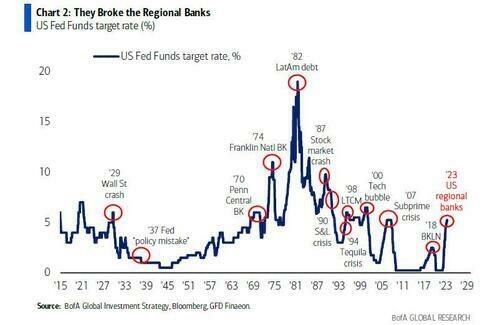
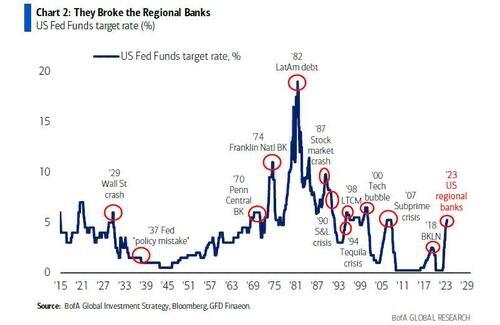
Earlier in the year, as regional banks faced a domino effect of failures, Bank of America strategist Michael Hartnett pointed out that every Fed tightening cycle has historically resulted in a crisis.
Given that the Federal Reserve hasn’t allowed a real credit cycle since the early 2000s, prolonged monetary tightening suggests that “winter is coming” for leveraged companies.
“The whole market and companies have been living in this la la land, this fake world of wealth of quantitative easing where you can borrow at 1% or 2%, you can buy anything, you can make lots of mistakes and you’re not going to get called out,” said Paul Horvath, chief executive officer at investment firm Orchard Global.
Horvath, speaking at the Milken Institute’s Middle East and Africa Summit in Abu Dhabi this week, was quoted by Bloomberg. He warned: “Winter is coming, and I don’t think people have enough parkas.”
The asset manager head said financial markets are holding up well so far, given the high rates. He noted corporates are levered up due to private equity firms buying up companies with cheap money, adding a global financial crisis might not be in the cards – but expects there will still be stress.
Bloomberg pointed out there were record levels of dealmaking during the pandemic era of cheap money. This led to a surge in private equity buyouts, backed by leveraged finance and the debt load placed on the target company. A large amount of that debt for junk-rated firms is coming due as large maturity walls approach.
Also speaking at the event was SLR Capital Partners co-founder Michael Gross, who said there is no easy solution for companies needing to refinance this debt.
“It’s going to take more than public markets coming back,” Gross said, adding, “It’s going to probably require private equity sponsors to find unique solutions like putting in more equity or finding preferred investors to step into the capital structures.”
Gross said managing portfolio companies with outdated debt structures will also face challenges for private credit funds.
He explained that funds were structured in a world of “perfection” based on an era of low interest rates, but that has all changed.
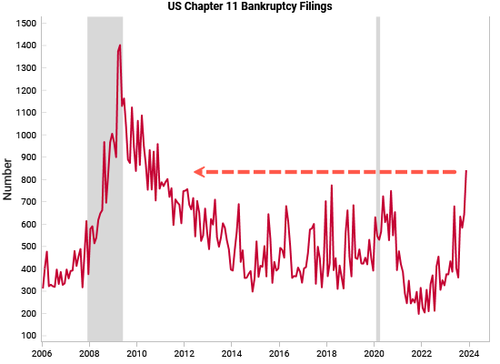
A higher for the longer environment with mounting macroeconomic headwinds only means over-leveraged firms are increasingly falling into distressed
The impact of this tightening cycle could be worse than the Great Recession – unless the Fed reverses course.
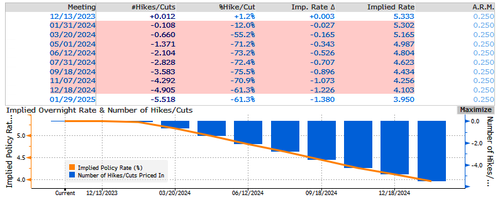
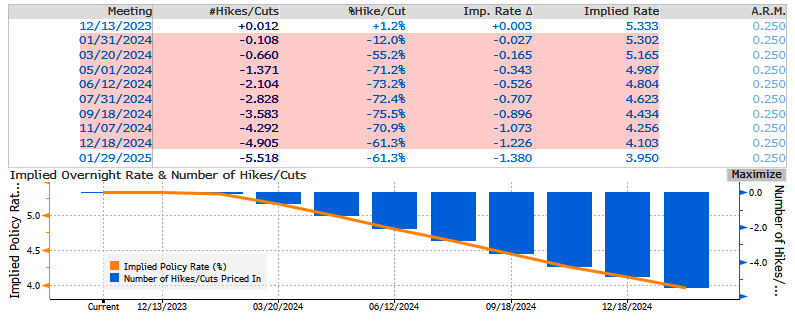
Rate traders are already pricing more than 100bps of rate cuts for 2024.
Meanwhile, Anne Walsh, chief investment officer of Guggenheim Partners Investment Management, said the US economy “hasn’t had a real corporate credit cycle since the early 2000s,” indicating a “purge is about to happen.”
https://www.zerohedge.com/markets/winter-coming-leveraged-companies
December 6, 2023
PFA Elects New Officers
Polyurethane Foam Association Elects New Officers, Names
Additions To Executive Committee for 2024
Philipe Knaub Takes Reins As President

LOUDON, TN (December 5, 2023)—The Polyurethane Foam Association (PFA) has named its
officers and Executive Committee for 2024. The slate of officers and committee members was
approved by attendees at the General Business Meeting on November 2, 2023 in Toronto.
Officers include:
Philippe Knaub, FXI, President
Rob Heller, Future Foam, 1st Vice President
Cam McLaughlin, Elite Comfort Solutions, 2nd Vice President
Hamdy Khalil, The Woodbridge Group, Treasurer
Bill Gollnitz, Immediate Past President.
Additional PFA Executive Committee members include:
Frank Donato of VPC
Karl Gust, BASF
Scott Skolnekovich, Covestro
Susan Kilpatrick, Evonik
Rob Einterz, Monument Chemical
Robert Smith, Wanhua
Barry Gabelman, Chemfoam.
Knaub takes over the presidency from Chip Holton of NCFI Polyurethanes, who had served in
the position since 2015.
Knaub is Senior Vice President and Chief Technology Officer of FXI, a
position he has held since 2016. He supervises all research and development projects, reporting
to the company’s Chief Executive Officer. He is accountable for all aspects of R&D and product
development, including project portfolio management, discovery, scale ups and
commercialization of new polyurethane foams.
Knaub earned a Ph.D. in Polymer Science from the Institut National des Sciences Appliquées de
Lyon. He holds multiple patents in polyol composition.
“PFA is a vital organization in the flexible polyurethane foam industry,” Knaub said. “I look
forward to working with my colleagues in the industry to further PFA’s programs in advocacy
and education.”
The Polyurethane Foam Association is a trade association founded in 1980 to help educate foam
users, allied industries and other stakeholders. PFA provides facts on environmental, health and
safety issues and technical information on the performance of flexible polyurethane foam (FPF)
in consumer and industrial products. FPF is used as a key comfort component in most
upholstered furniture and mattress products, along with automotive seating, carpet cushion,
packaging, and numerous other applications.
To learn more, visit www.pfa.org.