Current Affairs
October 30, 2023
Mattress Recycling Update
Bye Bye Mattress tops the 1.5 million mark for Connecticut mattresses recycled

Connecticut, US – In the eight years since the Mattress Recycling Council’s Bye Bye Mattress program started up in Connecticut, it has kept more than 1.5 million mattresses out of landfill. Placed end to end, MRC said, the mattresses would stretch all the way along the US east coast, from the very north of Maine to Key West in the south of Florida.
In the last fiscal year alone, almost 200,000 mattresses and box springs were recycled. The recycling rate was also increased, to 75%, with 3.75kT of foam, steel, fibre and wood being processed into new products. More than 24kT of materials have now been diverted from landfill in the eight years the program has been running.
“We also cultivated more participation from mattress retailers and other types of businesses that have large amounts of mattresses to recycle at once,” said Dan McGowan, MRC’s north-east programme coordinator. “The mattresses we collect are recycled locally, providing jobs and turning valuable materials into new products like carpet padding and a variety of steel products.”
October 26, 2023
Durable Goods Orders Increase in September
US Durable Goods Orders Soared In September By Most In Over 3 Years
by Tyler Durden
Thursday, Oct 26, 2023 – 08:50 AM
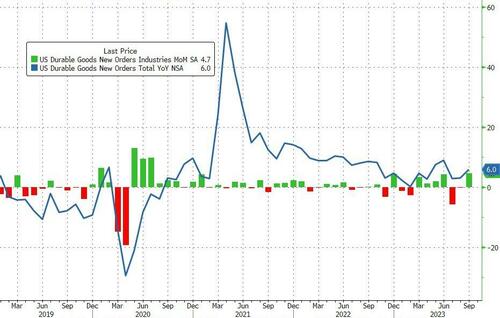
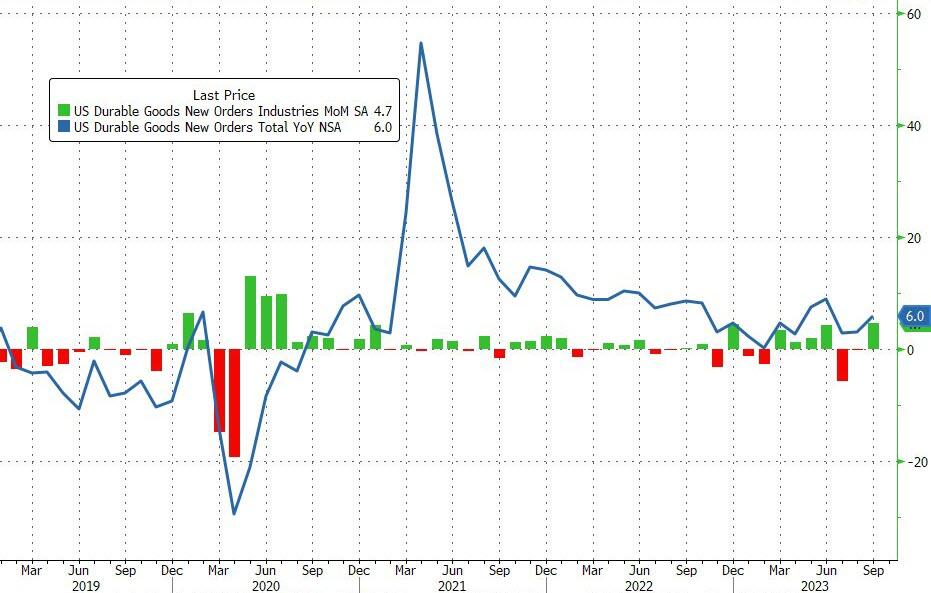
After two straight months of declines, preliminary durables goods orders for September soared 4.7% MoM (far higher than the 1.8% expected), lifting orders by 6.0% YoY…
Source: Bloomberg
That is the biggest MoM jump since July 2020.
Orders ex-transports rose just 0.5% MoM and ex-defense soared 5.8% MoM.
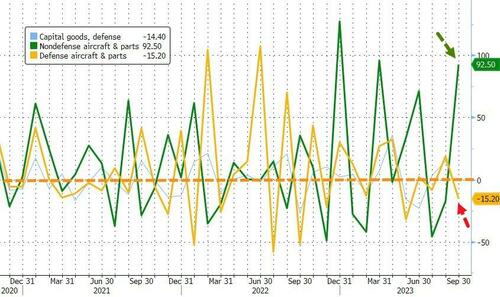
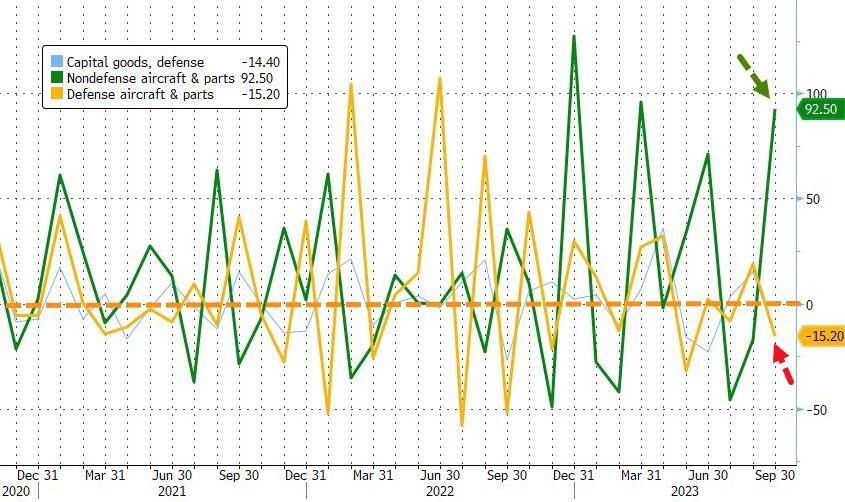
Defense spending tumbled 14.4% MoM but non-defense aircraft spending soared 92.5% MoM…
Source: Bloomberg
Finally, as a reminder, this data is all nominal – i.e not adjusted for inflation.
https://www.zerohedge.com/economics/us-durable-goods-orders-soared-september-most-over-3-years
October 23, 2023
Chemical Rail Traffic Rises Again
North American chem rail traffic rises

MRC — North American chemical rail traffic rose for a ninth consecutive week, with railcar loadings for the week ended 14 October up 0.3% year on year to 44,668, according Association of American Railroads.
For the first 41 weeks of 2023 ended 14 October, North American chemical rail traffic was down 1.1% year on year to 1,857,880 – with the US down 2.3% to 1,275,816.
In the US, chemical railcar loadings represent about 20% of chemical transportation by tonnage, with trucks, barges and pipelines carrying the rest. In Canada, chemical producers rely on rail to ship more than 70% of their products, with some exclusively using rail.
We remind, for last week, total U.S. weekly rail traffic was 499,217 carloads and intermodal units, up 3.0 percent compared with the same week last year. Total carloads for the week ending October 7 were 233,768 carloads, up 3.6 percent compared with the same week in 2022, while U.S. weekly intermodal volume was 265,449 containers and trailers, up 2.5 percent compared to 2022.
https://www.mrchub.com/news/409834-north-american-chem-rail-traffic-rises
October 4, 2023
U.S. Auto Sales Increase
Auto Sales: General Motors Takes Q3 Crown, But GM Stock Drops To New Low
- APARNA NARAYANAN
- 02:15 PM ET 10/04/2023
Auto sales in the U.S. grew for Ford Motor (F), General Motors (GM), Toyota Motor (TM) and Honda (HMC) in the third quarter, fueled by rising inventories and fleet demand. But GM stock made a new low on Wednesday.
Bucking the trend, Chrysler parent Stellantis (STLA) saw declining new vehicle sales.
As expected, GM took the Q3 sales crown, while the autoworkers’ strike extends into its third full week. Both GM and Ford reported sales momentum for electric vehicles, after challenges in the prior quarter.
Auto Stock Ratings
| Company | Symbol | Comp Rating | EPS Rating | RS Rating | SMR Rating | A/D Rating |
|---|---|---|---|---|---|---|
| Stellantis | (STLA) | 97 | 95 | 94 | A | C+ |
| Tesla | (TSLA) | 96 | 93 | 94 | A | C |
| Toyota Motor | (TM) | 93 | 79 | 92 | C | B- |
| Ford Motor | (F) | 84 | 95 | 41 | B | B- |
| General Motors | (GM) | 73 | 84 | 28 | A | C- |
Here is how automakers performed in Q3. The estimates from Cox Auto show sales volume for the quarter, as well as sales growth or decline vs. a year ago.
U.S. Auto Sales: General Motors
Q3 sales estimate: 658,433 vehicles, up 19.3% vs. Q3 2022.
Results: GM sold 674,336 vehicles, up 21% year over year. Year to date, GM sales are up 19%.
For Q3, the auto giant reported growth across all its car brands. Robust sales of traditional, gas-powered pickup trucks and new SUVs continued to drive gains, along with fleet sales.
GM sold 20,092 EVs in the third quarter, mostly older Bolts.
However, sales of newer-gen EVs also surged, albeit from low levels, as production headwinds eased. Lyriq EV sales more than doubled vs. Q2 to 3,018. Hummer EV sales rocketed to 1,167 from 47 in Q2.
GM also began initial sales of the Silverado electric truck.
Both GM and Ford are trying to ramp up EV production and sales after supply issues. In the second quarter, GM’s EV sales disappointed many investors.
Globally, automakers are shifting to electric vehicles, in the wake of Tesla’s success.
Shares of General Motors shed 2.9% Tuesday and a further 1.9% on the stock market today. GM stock hit a new 52-week low of 30.74 on Wednesday. It remains well below the 50-day moving average.
This week, GM and Ford boosted layoff in response to an expanded workers’ strike. According to a Bloomberg report Wednesday, General Motors said that the strike has already cost $200 million in the first two weeks, prompting the company to secure credit as it braces for more losses.
On Monday, Tesla (TSLA) reported disappointing global EV sales for the third quarter. EV startup Rivian (RIVN) reported better-than-expected Q3 deliveries.
Toyota Motor
Q3 sales estimate: 572,764 vehicles, up 8.9% vs. Q3 2022.
Results: Toyota sold 590,296 vehicles in Q3, up 12.2%.
A strong September finished the quarter. Toyota sold 203,904 vehicles for the month, a 13.9% increase from a year ago. “Electrified” vehicles made up nearly a third of the September total, Toyota said. The term includes battery electric vehicles, as well as fuel cell, hybrid and plug-in hybrid vehicles.
Toyota stock slid 3.1% Tuesday and a further 3% Wednesday, sliding below the 50-day moving average.
Ford Motor
Q3 sales estimate: 493,373 vehicles, up 6.9% vs. Q3 2022.
Results: Fold sold 500,504 vehicles, up 7.7% year over year. Year to date, Ford sales are up 9%.
In Q3, Ford truck sales grew 15% to 275,554 units. Ford SUV sales fell 0.3% to 194,723 units.
The automaker touted its “best ever sales” electric vehicles, including 20,962 battery-electric vehicles (BEVs) and 34,861 hybrid-electric vehicles.
Ford’s BEV sales jumped 15% year over year and were also up quarter over quarter. The gains were driven by the E-Transit van and the Mustang Mach-E SUV, for which Ford reported the highest sales since its debut in 2021. However, sales of the F-150 Lightning, the all-electric version of Ford’s top-selling truck, fell last quarter.
Sales of Ford hybrid-electric vehicles surged 41% year over year and were up slightly quarter over quarter. The new Maverick hybrid truck fueled gains, selling 23,931 units, an 83% increase year on year.
Ford stock shed 1.3% Wednesday, falling further below the 50-day line.
The auto giant said Tuesday it had made a new contract offer to resolve the UAW strike, but said a dispute over battery plants remains.
Stellantis
Q3 sales estimate: 384,371 vehicles, down 0.3% vs. Q3 2022.
Results: Stellantis sold 380,563 vehicles, down 1% from a year ago.
Shares of Stellantis stock gave up nearly 1% Wednesday.
Honda Motor
Q3 sales estimate: 331,608 vehicles, up 49.3% vs. Q3 2022.
Results: Honda sold 339,143 vehicles in Q3, up 52.7%. Like Toyota, Honda also signaled sales momentum heading into the close of 2023. Electric and hybrid-electric vehicles account for almost a quarter of its sales.
Honda stock gave up 3.5%, uncercutting the 50-day line.
U.S. Auto Sales Outlook
The annualized pace of September sales should reach 15.5 million, up from August’s 15 million rate, Cox Automotive analysts said. Citing strong Q3 sales momentum, the firm also raised its full-year forecast.
For 2023, Cox Auto now expects 15.3 million-15.4 million new vehicles to be sold in the U.S. market.
That is up from its forecast of 15 million at the end of June.
“Year-over-year sales gains have been surprising indeed,” said Cox analyst Charlie Chesbrough.
Consumers face high interest rates and ongoing inflation, which have put new cars out of reach for many.
However, pent-up demand has been fueling the vehicle market this year. Consumers and, especially, fleet customers are buying as the supply of new vehicles improves.
The UAW strike over a new labor contract has had little impact so far, analysts said. But a protracted strike could reverse gains the industry has made on inventory this year, they warned.
https://www.investors.com/news/auto-sales-q3-2023-gm-ford-gains/
October 1, 2023
Global Oil Production Overview
These Are The World’s Largest Oil Producers
by Tyler Durden
Saturday, Sep 30, 2023 – 07:35 AM
In 2022 oil prices peaked at more than $100 per barrel, hitting an eight-year high, after a full year of turmoil in the energy markets in the wake of the Russian invasion of Ukraine.
Oil companies doubled their profits and the economies of the biggest oil producers in the world got a major boost.
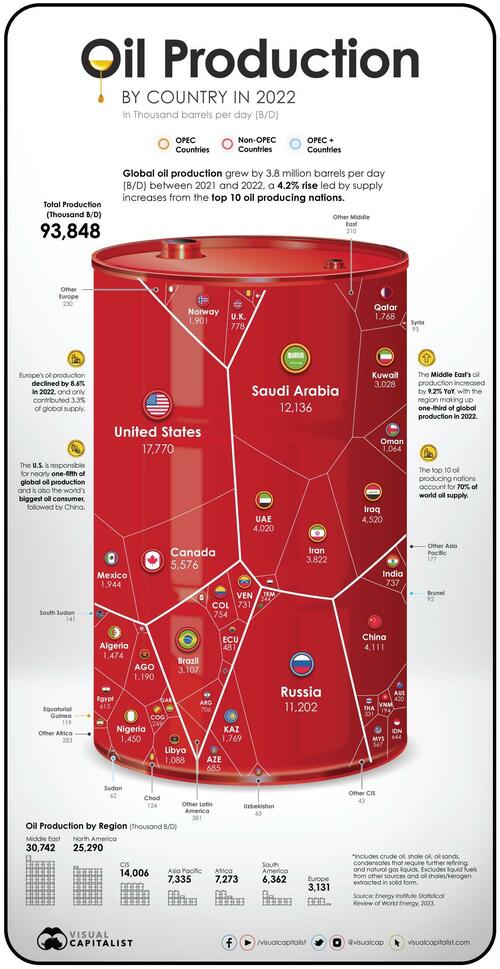
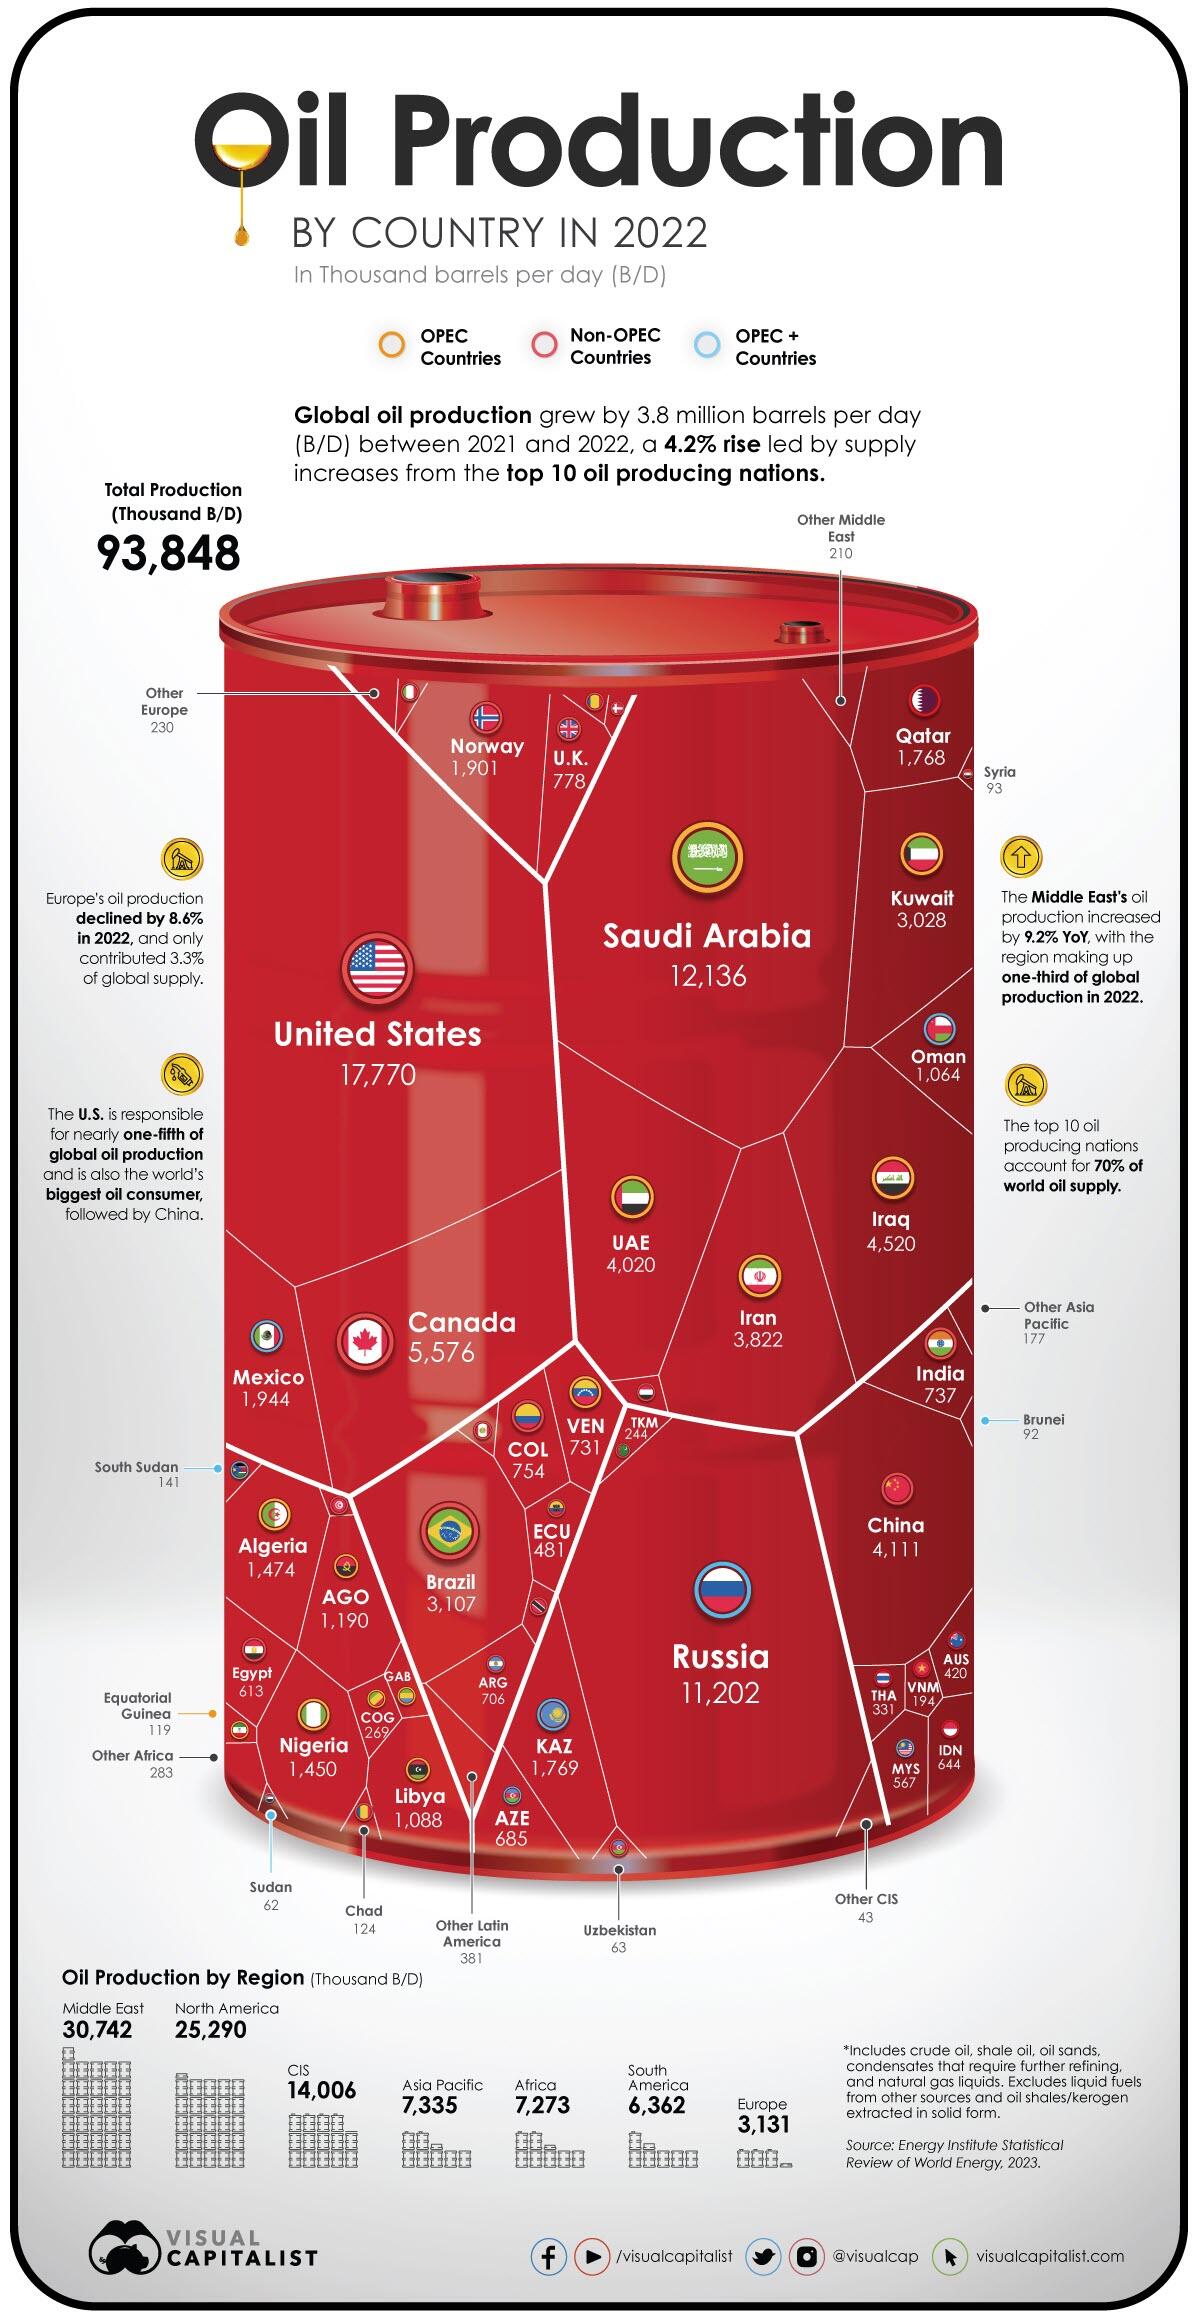
But which countries are responsible for most of the world’s oil supply? Using data from the Statistical Review of World Energy by the Energy Institute, Visual Capitalist’s Pallavi Rao and Christina Kostandi visualized and ranked the world’s biggest oil producers.
Ranked: Oil Production By Country, in 2022
The U.S. has been the world’s biggest oil producer since 2018 and continued its dominance in 2022 by producing close to 18 million barrels per day (B/D). This accounted for nearly one-fifth of the world’s oil supply.
Almost three-fourths of the country’s oil production is centered around five states: Texas, New Mexico, North Dakota, Alaska, and Colorado.
We rank the other major oil producers in the world below.
| Rank | Country | 2022 Production (Thousand B/D) | YoY Change | Share of World Supply |
|---|---|---|---|---|
| 1 | 🇺🇸 U.S. | 17,770 | +6.5% | 18.9% |
| 2 | 🇸🇦 Saudi Arabia | 12,136 | +10.8% | 12.9% |
| 3 | 🇷🇺 Russia | 11,202 | +1.8% | 11.9% |
| 4 | 🇨🇦 Canada | 5,576 | +3.0% | 5.9% |
| 5 | 🇮🇶 Iraq | 4,520 | +10.2% | 4.8% |
| 6 | 🇨🇳 China | 4,111 | +2.9% | 4.4% |
| 7 | 🇦🇪 UAE | 4,020 | +10.4% | 4.3% |
| 8 | 🇮🇷 Iran | 3,822 | +4.6% | 4.1% |
| 9 | 🇧🇷 Brazil | 3,107 | +3.9% | 3.3% |
| 10 | 🇰🇼 Kuwait | 3,028 | +12.0% | 3.2% |
| 11 | 🇲🇽 Mexico | 1,944 | +0.9% | 2.1% |
| 12 | 🇳🇴 Norway | 1,901 | -6.3% | 2.0% |
| 13 | 🇰🇿 Kazakhstan | 1,769 | -2.0% | 1.9% |
| 14 | 🇶🇦 Qatar | 1,768 | +1.8% | 1.9% |
| 15 | 🇩🇿 Algeria | 1,474 | +8.9% | 1.6% |
| 16 | 🇳🇬 Nigeria | 1,450 | -11.2% | 1.5% |
| 17 | 🇦🇴 Angola | 1,190 | +1.1% | 1.3% |
| 18 | 🇱🇾 Libya | 1,088 | -14.3% | 1.2% |
| 19 | 🇴🇲 Oman | 1,064 | +9.6% | 1.1% |
| 20 | 🇬🇧 UK | 778 | -11.0% | 0.8% |
| 21 | 🇨🇴 Colombia | 754 | +2.4% | 0.8% |
| 22 | 🇮🇳 India | 737 | -3.8% | 0.8% |
| 23 | 🇻🇪 Venezuela | 731 | +8.1% | 0.8% |
| 24 | 🇦🇷 Argentina | 706 | +12.4% | 0.8% |
| 25 | 🇦🇿 Azerbaijan | 685 | -5.6% | 0.7% |
| 26 | 🇮🇩 Indonesia | 644 | -6.9% | 0.7% |
| 27 | 🇪🇬 Egypt | 613 | +0.8% | 0.7% |
| 28 | 🇲🇾 Malaysia | 567 | -1.7% | 0.6% |
| 29 | 🇪🇨 Ecuador | 481 | +1.7% | 0.5% |
| 30 | 🇦🇺 Australia | 420 | -5.2% | 0.4% |
| 31 | 🇹🇭 Thailand | 331 | -17.5% | 0.4% |
| 32 | 🇨🇩 Congo | 269 | -1.7% | 0.3% |
| 33 | 🇹🇲 Turkmenistan | 244 | +1.0% | 0.3% |
| 34 | 🇻🇳 Vietnam | 194 | -1.2% | 0.2% |
| 35 | 🇬🇦 Gabon | 191 | +5.4% | 0.2% |
| 36 | 🇸🇸 South Sudan | 141 | -7.6% | 0.2% |
| 37 | 🇵🇪 Peru | 128 | +0.5% | 0.1% |
| 38 | 🇹🇩 Chad | 124 | +6.2% | 0.1% |
| 39 | 🇬🇶 Equatorial Guinea | 119 | -9.2% | 0.1% |
| 40 | 🇸🇾 Syria | 93 | -2.7% | 0.1% |
| 41 | 🇮🇹 Italy | 92 | -7.9% | 0.1% |
| 42 | 🇧🇳 Brunei | 92 | -13.8% | 0.1% |
| 43 | 🇾🇪 Yemen | 81 | -2.4% | 0.1% |
| 44 | 🇹🇹 Trinidad & Tobago | 74 | -3.6% | 0.1% |
| 45 | 🇷🇴 Romania | 65 | -6.2% | 0.1% |
| 46 | 🇩🇰 Denmark | 65 | -1.6% | 0.1% |
| 47 | 🇺🇿 Uzbekistan | 63 | -0.9% | 0.1% |
| 48 | 🇸🇩 Sudan | 62 | -3.3% | 0.1% |
| 49 | 🇹🇳 Tunisia | 40 | -12.9% | 0.0% |
| 50 | Other CIS | 43 | +4.4% | 0.0% |
| 51 | Other Middle East | 210 | +1.2% | 0.2% |
| 52 | Other Africa | 283 | -3.4% | 0.3% |
| 53 | Other Europe | 230 | -20.5% | 0.2% |
| 54 | Other Asia Pacific | 177 | -10.6% | 0.2% |
| 55 | Other S. & Cent. America | 381 | +68.5% | 0.4% |
| Total World | 93,848 | +4.2% | 100.0% |
Behind America’s considerable lead in oil production, Saudi Arabia (ranked 2nd) produced 12 million B/D, accounting for about 13% of global supply.
Russia came in third with 11 million B/D in 2022. Together, these top three oil producing behemoths, along with Canada (4th) and Iraq (5th), make up more than half of the entire world’s oil supply.
Meanwhile, the top 10 oil producers, including those ranked 6th to 10th—China, UAE, Iran, Brazil, and Kuwait—are responsible for more than 70% of the world’s oil production.
Notably, all top 10 oil giants increased their production between 2021–2022, and as a result, global output rose 4.2% year-on-year.
Major Oil Producing Regions in 2022
The Middle East accounts for one-third of global oil production and North America makes up almost another one-third of production. The Commonwealth of Independent States—an organization of post-Soviet Union countries—is another major regional producer of oil, with a 15% share of world production.
| Region | 2022 Production (Thousand B/D) | YoY Change | Share of World Supply |
|---|---|---|---|
| Middle East | 30,743 | +9.2% | 32.8% |
| North America | 25,290 | +5.3% | 27.0% |
| CIS | 14,006 | +0.9% | 14.9% |
| Africa | 7,043 | -3.5% | 7.5% |
| Asia Pacific | 7,273 | -1.4% | 7.8% |
| South & Central America | 6,361 | 7.2% | 6.8% |
| Europe | 3,131 | -8.6% | 3.3% |
What’s starkly apparent in the data however is Europe’s declining share of oil production, now at 3% of the world’s supply. In the last 20 years the EU’s oil output has dropped by more than 50% due to a variety of factors, including stricter environmental regulations and a shift to natural gas.
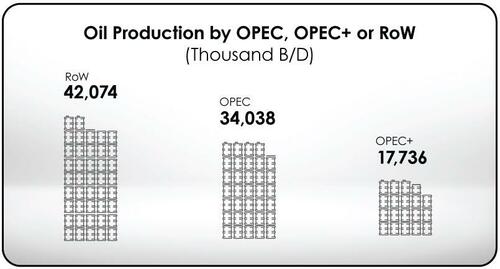
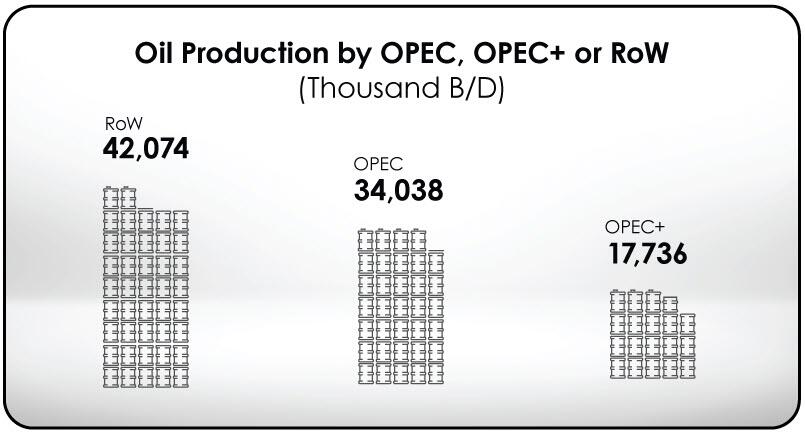
Another lens to look at regional production is through OPEC members, which control about 35% of the world’s oil output and about 70% of the world’s oil reserves.
When taking into account the group of 10 oil exporting countries OPEC has relationships with, known as OPEC+, the share of oil production increases to more than half of the world’s supply.
Oil’s Big Balancing Act
Since it’s the very lifeblood of the modern economy, the countries that control significant amounts of oil production also reap immense political and economic benefits. Entire regions have been catapulted into prosperity and wars have been fought over the control of the resource.
At the same time, the ongoing effort to pivot to renewable energy is pushing many major oil exporters to diversify their economies. A notable example is Saudi Arabia, whose sovereign wealth fund has invested in companies like Uber and WeWork.
However, the world still needs oil, as it supplies nearly one-third of global energy demand.
https://www.zerohedge.com/energy/these-are-worlds-largest-oil-producers