The Urethane Blog
January 14, 2023
These Are North America’s Biggest Sources Of Electricity By State And Province
by Tyler Durden
Friday, Jan 13, 2023 – 08:40 PM
On a national scale, the United States and Canada rely on a very different makeup of sources to generate their electricity.
The U.S. primarily uses natural gas, coal, and nuclear power, while Canada relies on both hydro and nuclear. That said, when zooming in on the province or state level, individual primary electricity sources can differ greatly.
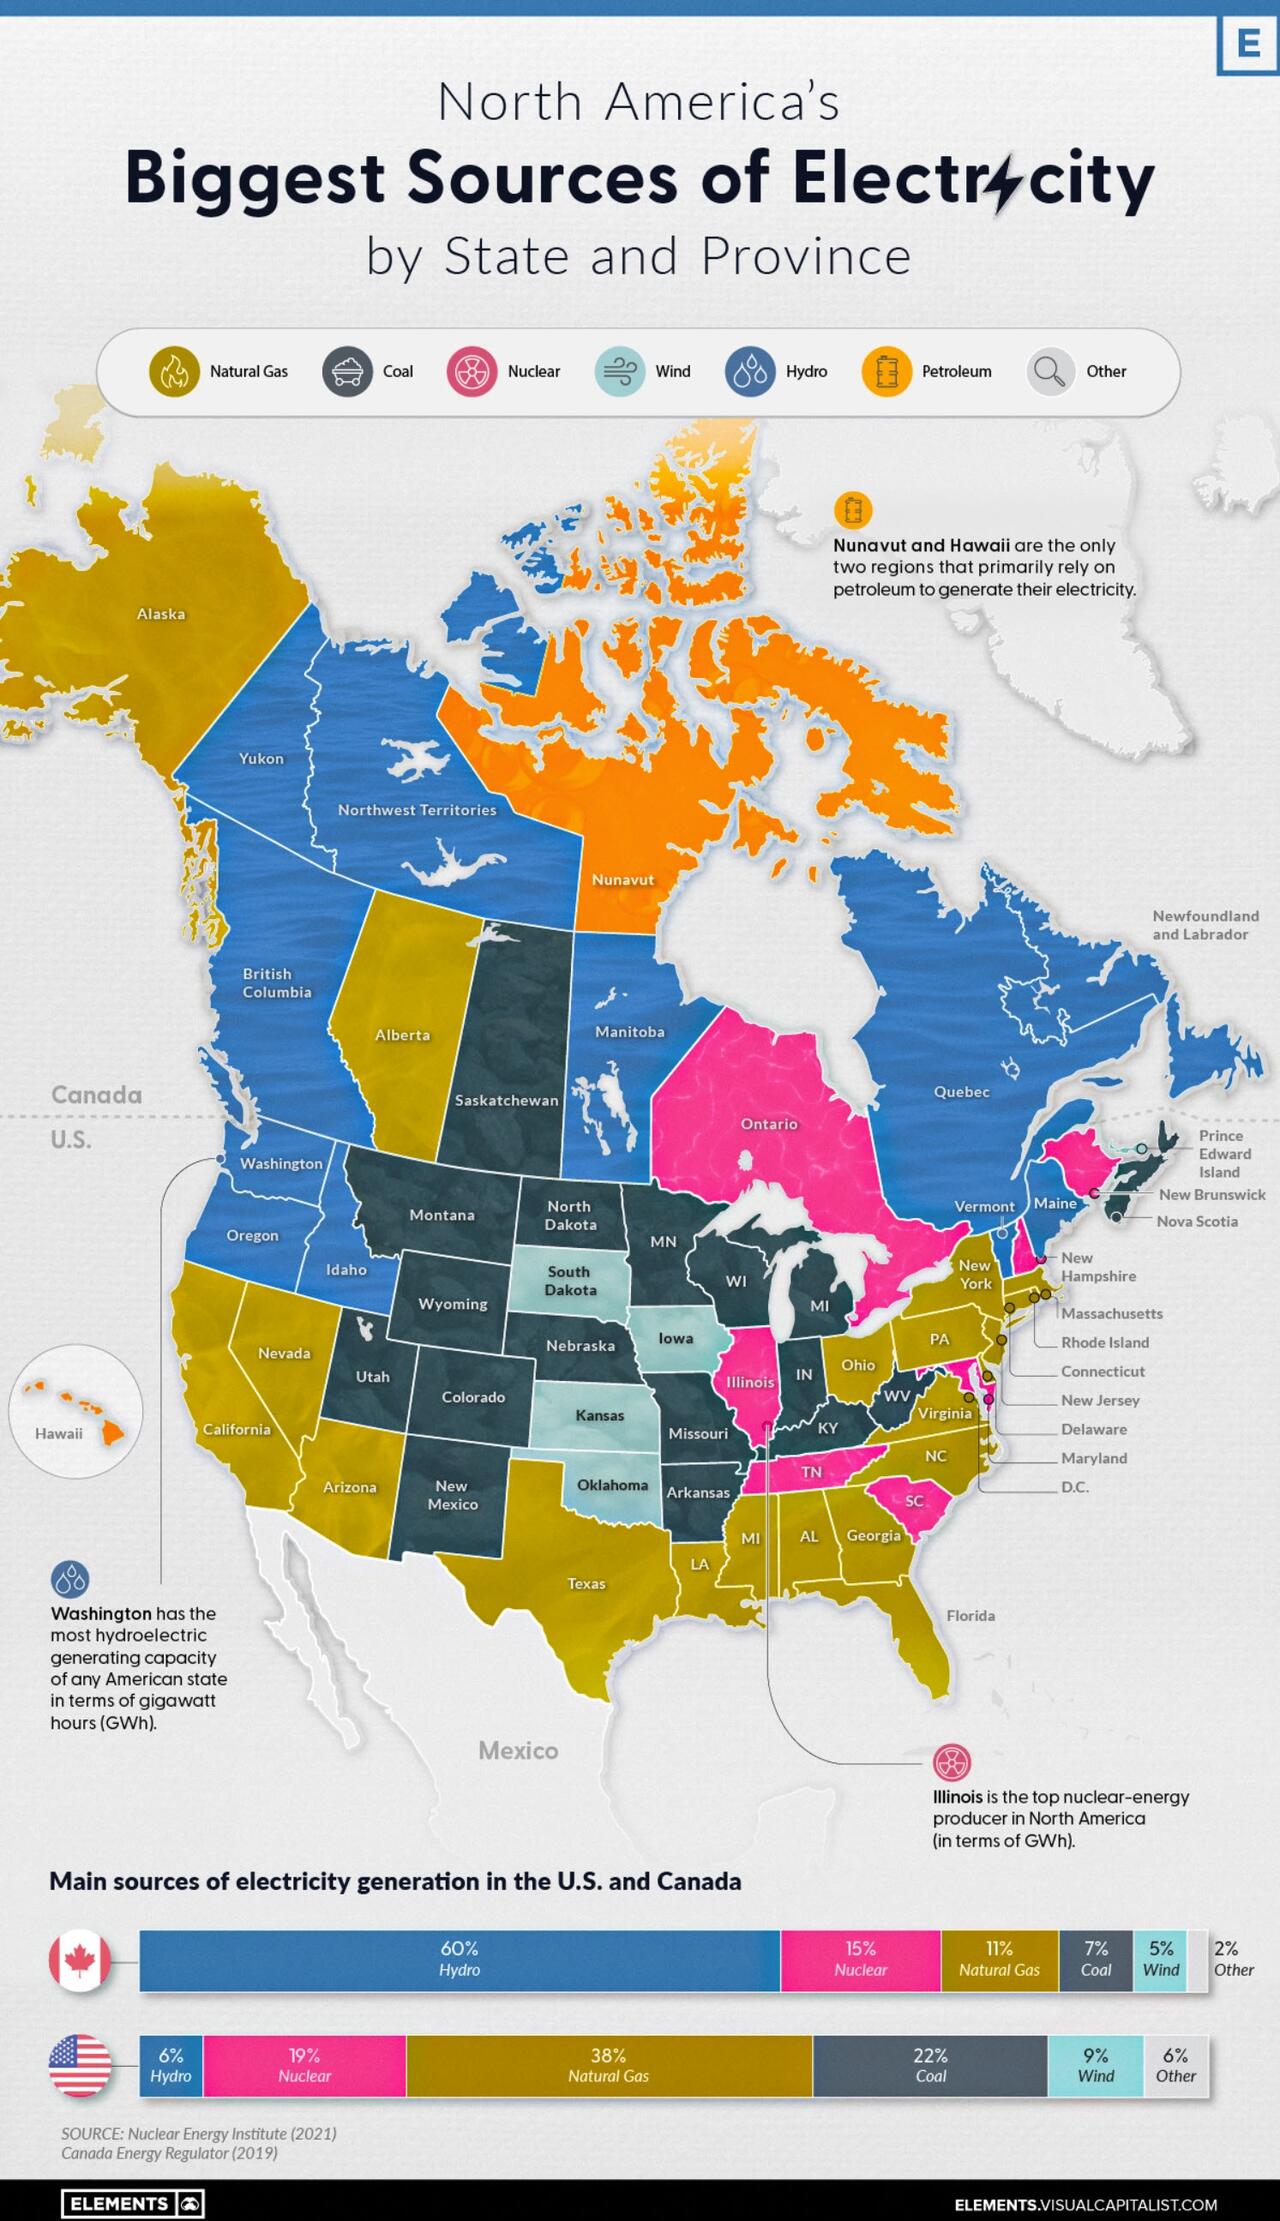
In the infographic below, Visual Capitalist’s Selin Oğuz takes a look at the electricity generation in the states and provinces of these two countries using data from the Nuclear Energy Institute (2021) and the Canada Energy Regulator (2019).
Natural Gas
Natural gas is widely used for electricity generation in the United States. Known as a “cleaner” fossil fuel, its abundance, coupled with an established national distribution network and relatively low cost, makes it the leading electricity source in the country.
In 2021, 38% of the 4120 terawatt-hours (TWh) of electricity generated in the U.S. came from natural gas. Not surprisingly, more than 40% of American states have natural gas as their biggest electricity source.
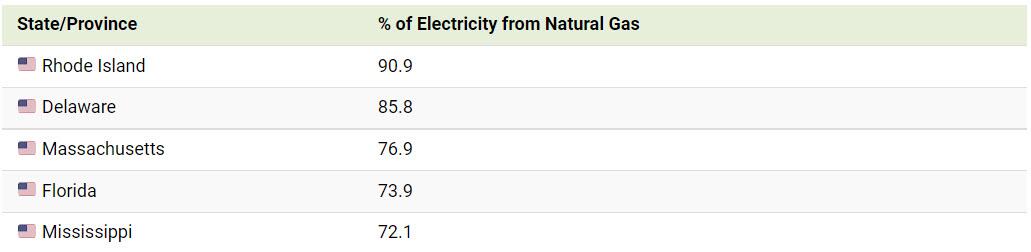
Here are some states that have the largest shares of natural gas-sourced electricity.
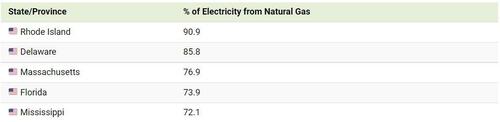
In Canada, natural gas is only the third-biggest electricity source (behind hydro and nuclear), accounting for 11% of the 632 TWh of electricity produced in 2019. Alberta is the only province with natural gas as its main source of electricity.
Nuclear
Nuclear power is a carbon-free energy source that makes up a considerable share of the energy generated in both the U.S. and Canada.
19% of America’s and 15% of Canada’s electricity comes from nuclear power. While the percentages are close to one another, it’s good to note that the United States generates 6 to 7 times more electricity than Canada each year, yielding a lot more nuclear power than Canada in terms of gigawatt hours (GWh) per year.
As seen in the map, many states and provinces with nuclear as their main source of electricity are concentrated in the eastern half of the two countries.
In the U.S., Illinois, Pennsylvania, and South Carolina are top producers in terms of GWh/year. Illinois and South Carolina also have nuclear as their primary electricity source, whereas Pennsylvania’s electricity production from natural gas exceeds that from nuclear.
The vast majority of Canada’s nuclear reactors (18 of 19) are in Ontario, with the 19th in New Brunswick. Both of these provinces rely on nuclear as their biggest source of electricity.
Renewables: Hydro, Wind and Solar
Out of the different types of renewable electricity sources, hydro is the most prevalent in North America. For example, 60% of Canada’s and 6% of the U.S.’s electricity comes from hydropower.
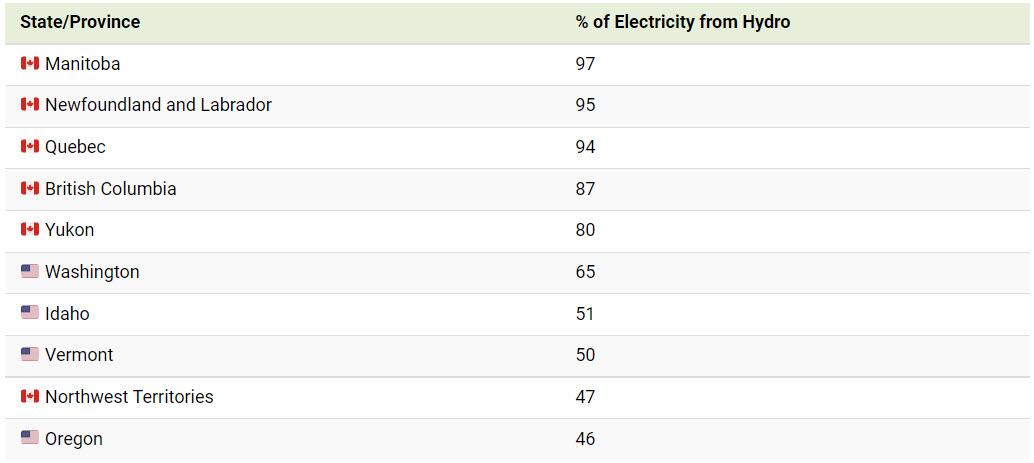
Here are the states and provinces that have hydro as their biggest source of electricity.
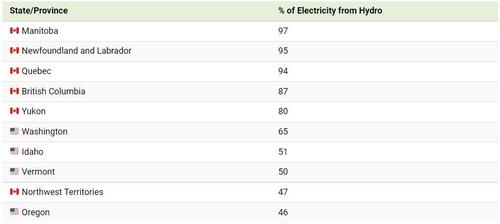
Wind and solar power collectively comprise a small percentage of total electricity generated in both countries. While no state or province relies on solar as its biggest source of electricity, Iowa, Kansas, Oklahoma, and South Dakota rely primarily on wind for their electricity, along with Canada’s Prince Edward Island (PEI).
Coal and Oil
Coal and oil are emission-heavy electricity sources still prevalent in North America.
Currently, 22% of America’s and 7% of Canada’s electricity comes from coal, with places such as Kentucky, Missouri, West Virginia, Saskatchewan, and Nova Scotia still relying on coal as their biggest sources of electricity.
Certain regions also use petroleum to generate their electricity. Although its use for this purpose is declining, it is still the biggest source of electricity in both Hawaii and Nunavut.
Over the next few years, it will be interesting to observe the use of these fossil fuels for electricity generation in the U.S. and Canada. Despite the differences in climate commitments between the two countries, lowering coal and oil-related emissions may be a critical part of hitting decarbonization targets in a timely manner.
January 13, 2023
Covestro announces preliminary results for fiscal year 2022

In the course of preparing Covestro’s group accounts for fiscal year 2022, preliminary full-year financial figures deviate from capital market expectations, based on the average values of latest consensus estimates of financial analysts, published by Vara Research on January 12, 2023.
“Covestro’s business development last year was clearly impacted by the sharp rise in energy and raw material costs, high inflation and a weakening global economy,” says Dr. Markus Steilemann, CEO of Covestro. “Nevertheless, our products are part of the solution to the current crisis and essential for a sustainable and circular future.”
Dr. Thomas Toepfer, CFO of Covestro, adds: “The recessionary environment and the extraordinary depreciation, in particular as a result of the current difficult economic conditions in Europe, additionally weighed on the Group’s earnings. However, our record-high sales and clearly positive free operating cash flow also show that even in these difficult times we are succeeding in generating cash. Our balance sheet is very solid, so we are also prepared for a prolonged economic downturn.”
Covestro provides already today the following preliminary key financial data for fiscal year 2022:
- Preliminary sales amount to 17,968 million euros. The consensus expects this figure to be 17,999 million euros.
- Preliminary EBITDA amounts to approx. 1,610 million euros. The previous guidance expected EBITDA to be between 1,700 million euros and 1,800 million euros. The consensus expects this figure to be 1,679 million euros.
- Preliminary net income amounts to approx. –300 million euros. The consensus expects this figure to be 420 million euros. The Group’s net income is particularly burdened by extraordinary depreciation of non-current assets in the amount of approx. 470 million euros and by adjustments of deferred tax assets in the amount of approx. 250 million euros.
- Preliminary free operating cash flow (FOCF) amounts to approx. 130 million euros. The previous guidance expected FOCF to be between EUR 0 and EUR 100 million. The consensus expects this figure to be –39 million euros.
The Annual Report 2022 will be published on March 2, 2023.
January 13, 2023
PRESS RELEASE: January 10, 2023 (Fresno, California)
General Coatings Manufacturing Corporation

Laxmi “Lax” Gupta built one of the largest family-owned systems houses in the United States under
his leadership over his 50-year career in the polyurethanes industry. He ran a family and customer
centric business enterprise and focused on innovation through Research and Development leading
to high performance products produced under the strictest quality control procedures. He left an
enduring legacy which will be continued by his wife Urmila Gupta and his three children, Dr. Shalesh
Gupta, Dr. Anjula Gupta and Dr. Sandeep Gupta, who are actively involved in managing all of his
businesses. Many other family members and now the third generation, Lax’s grandchildren, have
started to enter the businesses as well.

The owners of General Coatings Manufacturing Corporation (GCMC) would like to announce
appointment of Will Lorenz as the new President of General Coatings Manufacturing Corporation.
Will Lorenz has been Vice President of – National Sales in Spray Foam Roofing & Tank Systems for
GCMC. He received a BA in Chemistry from the College of Wooster, Ohio and an MBA from the
University California Irvine in 1996.
Prior to joining GCMC, Lorenz worked at Amoco Chemicals, Mobay
Corporation, ICI Polyurethanes, Henry Company, and Arnco. He is part of
multiple industry organizations. He is President of RCMA, a board member
of SPFA, on the Spray Foam Contractors (SFC) Leadership Committee, on
the Spray Foam Manufacturer Government Affairs Committee, and a
member of NRCA, National Roof Contractors Association.
“I see my role is to bring the GCMC team together and unleash our
capabilities. We pursue our goals through embracing Lax’s keen
entrepreneurial spirit, bringing new energy saving roofing solutions, and
unparalleled personal commitment to our dedicated contractors.” –
Lorenz
January 13, 2023
2022 big events of spandex industry 
Text size
| Macro environment was complex and changeable in 2022. Global economy decreased due to the raise of interest rate in US, energy price soared amid the Russia-Ukraine conflict and market liquidity weakened because of the repeat spread of COVID-19 pandemic in local China. Global economy faced high inflation and low growth rate, in stagnation stage. Spandex market was greatly affected by the macro environment in 2022. Demand for spandex was apparently insufficient. The weakness was transferred to upstream market from the downstream sector. Spandex market saw obviously worse price, operating rate, inventory and profit in 2022.Macro policies 1. Implementation of tax rate on spandex value chain in RCEP AgreementThe Regional Comprehensive Economic Partnership Agreement (RCEP) entered into force on January 1, 2022, mainly involving six ASEAN members, including Brunei, Cambodia, Laos, Singapore, Thailand and Vietnam, and four non-ASEAN members, including China, Japan, New Zealand and Australia.With the help of RCEP reciprocal tariffs, the growth rate of textile exports to Europe and the United States was greater than that to Europe and the United States. From January to October 2022, ASEAN accounted for 16.97% of China’s textile and apparel exports, surpassing the United States to become China’s largest export market, with an increase of 20.9 percent over the same period of last year; the United States took up 16.85%, with a decrease of 1.58 percent on annual basis; and the European Union accounted for 14.7%, with an increase of 4.73 percent year on year. 2023 is the second year of the entry into force of the RCEP, and trade terms and tariff dividends on exports to ASEAN will be further released. 2. Ministry of Industry and Information Technology and National Development and Reform Commission issued relevant guidance on chemical fiber and textileThe Ministry of Industry and Information Technology and the National Development and Reform Commission issued the guidance on the High-quality Development of the Chemical Fiber Industry on April 21, 2022 proposing that by 2025, the industrial added value of chemical fiber enterprises above scale will grow at an average annual rate of 5%. The proportion of chemical fiber output in the world will be basically stable. Upstream feedstock market 1. Capacity expansion 1) Shaanxi Shanhua’s BDO second phase alkynation efficiency improvement project starts operation successfully The second phase of the alkynation efficiency improvement project from Shaanxi Shanhua was successfully started up at one time in November, 2022, completed the activation of the catalyst, and produced qualified 1,4 butynediol. The second phase of BDO alkynation efficiency improvement project is a key project for Shaanxi Shanhua to improve both BDO production capacity and efficiency. 2)Inner Mongolia Dongjing commenced 280KTA BDO plant On November 24, 2022, after more than a year of intensive construction, Inner Mongolia Dongjing Biological Environmental Protection Technology Co., Ltd., located in Wuda Industrial Park of Wuhai, has successfully started up its 1,4-butanediol (BDO) plant with an annual output of 280000 ton. After a day of debugging, the purity has reached 99.91%, which indicated that Dongyuan Technology has become the world’s largest integrated production base of BDO with an annual BDO capacity at 380kt. 3) Wanhua Chemical’s MDI unit started production successfully in Fujian Wanhua Chemical Group Holding Company Wanhua Chemical (Fujian) Isocyanate Co., Ltd.’s 400kt/year MDI unit has successfully started operation on Dec 22, 2022, with qualified products available. This project will further optimize company’s MDI industrial layout and improve global industrial competitiveness. 2. New National Standard (2022 Version) for the PTMEG implemented The 2022 version of PTMEG new national standard, led by Sichuan Tianhua Fubon Chemical Co., Ltd., and jointly drafted by Chongqing Jianfeng New Materials Co., Ltd. Chiyuan Chemical Branch, Shaanxi Shanhua Coal Chemical Group Co., Ltd., CPP (Panjin) Co., Ltd., Dairen Chemical (Jiangsu) Co., Ltd., Xinjiang Blue Ridge Tunhe Energy Co., Ltd., Zhonglan Chengguang Chengdu testing Technology Co., Ltd. and CGN Juner (Zhejiang) New Materials Co., Ltd. has been issued and implemented from November, 2022.Spandex sector 1. Spandex capacity exceeded 1 million tons for the first time By the end of 2022, the capacity of spandex exceeded 1 million tons to be 1.0965 million tons/year in Chinese mainland, up by 12.9% or 125kt/year on the year. Three companies had new capacity in the first half of 2022, namely Hyosung Ningxia, Huafon Chongqing and Xinxiang Chemical Fiber, with total new capacity at 90kt/year. Four companies had new capacity in the second half of year, namely Tayho Ningxia, Zhuji Huahai, Xinxiang Chemical Fiber and Zhuji Qingrong, with total new capacity at 60kt/year. 25kt/year of capacity was eliminated at the end of 2022. The total increment of capacity was at 35kt/year combined with the new expansion and eliminated capacity in the second half of 2022.Spandex market saw extreme operation in 2022. New capacity expansion was big. However, some export orders flew to Southeast Asia and South Asia in the second and third quarter. Domestic and export demand was soft in the fourth quarter impacted by the spread of pandemic and the high inflation outside China. Demand for spandex saw a rare negative growth. The operating rate of spandex plants averaged at 76.4% in 2022, down by 18.2 percentage points on the year, with the highest and lowest level at 94% in mid-Mar and 55% in mid-Aug. 2. Huafon Group completed the M&A of bio-based business under DuPont On June 1, 2022, Beijing time, Huafon Group formally completed the delivery of the related business and technology of bio-based products spun off by DuPont of the United States. This is by far the largest overseas M&A transaction of Huafon Group. 3. Bangtai’s bio-based melt-spun spandex successfully passed the USDA Bio-based Product Certification On Jun 1, in order to realize the recycling of resources and build a sustainable future, Bangtai has a foothold in the field of new materials and plays a green role under the strategic goal of “Dual Carbon”. Bangtai’s technical team has successfully developed bio-based melt spinning spandex products and successfully passed the U.S. Department of Agriculture (USDA) Bio-based Product Certification! 4. Hyosung’s biological spandex certified by SGS On Jul 26, Hyosung is the world’s largest spandex manufacturer and the first global developer to commercialize biological spandex. Hyosung creora® bio-spandex has been certified by Standard Global Services (SGS) as an eco-product, ensuring that the product is made of plant materials and produced in a harmless and environmentally friendly environment. SGS is a leading inspection, accreditation, testing and certification organization and a globally recognized benchmark for quality and integrity. 5. The spread of pandemic affected the operation of some textile and apparel markets The COVID-19 pandemic had an obvious impact on the business of textiles and apparels in 2022. Some professional textile and apparel markets in Shanghai, Guangzhou, Hangzhou, Shenyang, Haicheng, Shaoxing, Xinjiang, Zhuzhou and Nantong were closed for a long time. 6. Textile companies went abroad to snatch orders At the end of the 2022, after China’s epidemic prevention and control measures were optimized, textile enterprises either set out on their own or joined the “order-grabbing regiment” organized by the government to get new orders and talk about new investment abroad so as to quickly expand market. |
http://www.ccfgroup.com/newscenter/newsview.php?Class_ID=D00000&Info_ID=2023011330026
January 13, 2023
Europur: Supply situation improves / prices of raw materials historically high
Jan 10, 2023

According to Europur, the European Association of Flexible PU Foam Blocks Manufacturers, even though gas prices in Europe have receded compared to the summer, they remain historically high and volatile in Europe, creating difficulties for the entire chemicals industry, in which gas is used both as a raw material and as a source of energy.
As reported by CEFIC, the European Chemical Industry Council, in October 2022 for the first time ever Europe imported more chemicals than it exported, and the industry at large is at “a breaking point”. Major German raw materials suppliers, also active in the polyurethane supply chain, have warned that the situation may prompt them to adapt their European strategies in the short term.
Being strongly dependent on the supply of chemical raw materials, the above means the situation was precarious over the autumn for the flexible polyurethane foam industry. Especially since this was combined with the additional difficulty that the three European sites producing TDI (Toluene Diisocyanate) – one of the main chemicals used to make foam blocks – halted production for various reasons. While two have in the meantime restarted production, one of them remains under force majeure. All suppliers did their utmost to stabilize supply, notably by using their global networks to import TDI from Asia and the USA, but such extensive rotations of ships require time to be put in place.
In parallel, demand for foam is reported to have decreased due to reduced demand, mostly from the upholstered furniture and bedding markets, as Europeans divert their spending to other items.
As a result of the declining demand and of the restart of European production / stable imports of chemicals, foam shortages have largely receded during November 2022. Prices of chemical raw materials have also started to stabilise. However, with continued high gas prices, they remain historically high as reported in specialised trade press.
The evolution of the situation for the future remains quite uncertain, as the flexible polyurethane foam supply chain can be influenced positively or negatively by any of these factors:
- Gas prices in Europe and operational cost of the chemical industry / anticipated uncertainty on stability of gas supply in Europe over much of 2023.
- The evolution of the pandemic in Asia and particularly China, which can influence price of chemical raw materials at global level and possibility for exports to Europe.
- Evolution of demand in Europe for foam-containing products, especially mattresses and furniture.
 Everchem Updates Archive
 Sign Up for Email Updates