
Current Affairs
August 21, 2025
Housing Update
Overall housing starts gain in July, affordability crisis persists
By Dakota Smith
August 20, 2025 | 9:41 am CDT

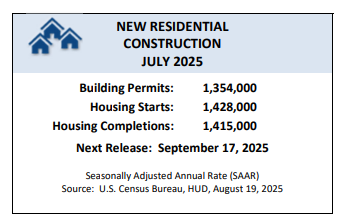
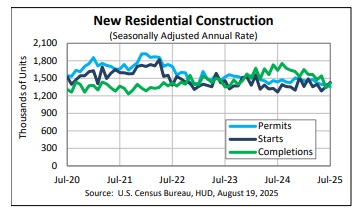
WASHINGTON, D.C. — Led by solid multifamily production, overall housing starts increased 5.2% in July to a seasonally adjusted annual rate of 1.43 million units, according to a report from the U.S. Department of Housing and Urban Development and the U.S. Census Bureau.
Single-family housing starts posted a modest gain in July as builders continue to contend with challenging housing affordability conditions and a host of supply-side headwinds, including labor shortages, elevated construction costs and inefficient regulatory costs.
The July reading of 1.43 million starts is the number of housing units builders would begin if development kept this pace for the next 12 months. Within this overall number, single-family starts increased 2.8% to a 939,000 seasonally adjusted annual rate and are down 4.2% on a year-to-date basis. The multifamily sector, which includes apartment buildings and condos, increased 9.9% to an annualized 489,000 pace.
“Single-family production continues to operate at reduced levels due to ongoing housing affordability challenges, including persistently high mortgage rates, the skilled labor shortage and excessive regulatory costs,” said Buddy Hughes, chairman of the National Association of Home Builders (NAHB) and a home builder and developer from Lexington, N.C. “These headwinds were reflected in our latest builder survey, which indicates that affordability is the top challenge to the housing market.”
“The slowdown in single-family home building has narrowed the home building pipeline,” said NAHB Chief Economist Robert Dietz. “There are currently 621,000 single-family homes under construction, down 1% in July and 3.7% lower than a year ago. This is the lowest level since early 2021 as builders pull back on supply.”
On a regional and year-to-date basis, combined single-family and multifamily starts were 10.2% higher in the Northeast, 17.7% higher in the Midwest, 2.4% lower in the South and 0.5% lower in the West.
Overall permits decreased 2.8% to a 1.35-million-unit annualized rate in July. Single-family permits increased 0.5% to an 870,000-unit rate and are down 5.8% on a year-to-date basis. Multifamily permits decreased 8.2% to a 484,000 pace.
Looking at regional permit data on a year-to-date basis, permits were 16.6% lower in the Northeast, 9.1% higher in the Midwest, 3.4% lower in the South and 5.1% lower in the West.
August 4, 2025
Furniture Growth
Manufacturing PMI at 48%, wood dips while furniture grows
By Dakota Smith
August 1, 2025 | 10:41 am CDT

TEMPE, Ariz. — Economic activity in the manufacturing sector contracted in July for the fifth consecutive month, following a two-month expansion preceded by 26 straight months of contraction, say the nation’s supply executives in the latest Manufacturing ISM Report On Business.
The report was issued today by Susan Spence, MBA, Chair of the Institute for Supply Management (ISM) Manufacturing Business Survey Committee:
“The Manufacturing PMI registered 48 percent in July, a 1-percentage point decrease compared to the 49 percent recorded in June. The overall economy continued in expansion for the 63rd month after one month of contraction in April 2020. (A Manufacturing PMI® above 42.3 percent, over a period of time, generally indicates an expansion of the overall economy.) The New Orders Index contracted for the sixth consecutive month, following three months of expansion. The figure of 47.1 percent is 0.7 percentage points higher than the 46.4 percent recorded in June. The July reading of the Production Index (51.4 percent) is 1.1 percentage points higher than June’s figure of 50.3 percent. The Prices Index remained in expansion (or ‘increasing’) territory, registering 64.8 percent, down 4.9 percentage points compared to the reading of 69.7 percent reported in June. The Backlog of Orders Index registered 46.8 percent, up 2.5 percentage points compared to the 44.3 percent recorded in June. The Employment Index registered 43.4 percent, down 1.6 percentage points from June’s figure of 45 percent.
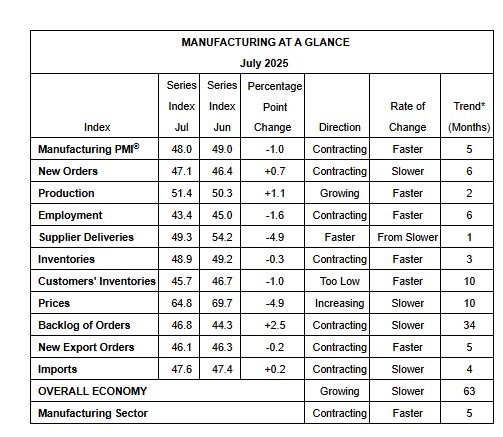
“Looking at the manufacturing economy, 79 percent of the sector’s gross domestic product (GDP) contracted in July, up from 46 percent in June. Notably, 31 percent of GDP is strongly contracting (registering a composite PMI® of 45 percent or lower), up from 25 percent in June. The share of sector GDP with a PMI at or below 45 percent is a good metric to gauge overall manufacturing weakness. Of the six largest manufacturing industries, none expanded in July, compared to four in June,” says Spence.
“The demand indicators improved, with the New Orders and Backlog of Orders indexes contracting at slower rates, while the Customers’ Inventories and New Export Orders indexes contracted at slightly faster rates. A ‘too low’ status for the Customers’ Inventories Index is usually considered positive for future production.
“Regarding output, the Production Index increased month over month to move further into expansion territory, however; the Employment Index dropped further into contraction as panelists indicated that managing head count is still the norm at their companies, as opposed to hiring. The mixed indicators in output suggest companies still cautious in their hiring, even with an increase in production.
“Finally, inputs (defined as supplier deliveries, inventories, prices and imports), on net, declined further into contraction territory. The Inventories Index moved marginally further into contraction territory after expanding in April, as companies work to reduce or adjust inventory to better align with demand. The Supplier Deliveries Index indicated faster deliveries as supply chain performance improved and sluggish demand continued. Prices continued to increase, but at a slower rate. The Imports Index remained in contraction but moved upward slightly,” Spence concludes.
“Business is steady, with solid bookings and backlog. Still uncertainty about tariffs and associated inflation,” says a Furniture & Related Products respondent.
Other respondents, including representatives of Machinery, Electrical Equipment, and Fabricated Metal Products, state that tariffs are disrupting overall manufacturing and imports & exports.
The seven manufacturing industries reporting growth in July — listed in order — are: Apparel, Leather & Allied Products; Plastics & Rubber Products; Nonmetallic Mineral Products; Textile Mills; Miscellaneous Manufacturing; Furniture & Related Products; and Primary Metals. The 10 industries reporting contraction in July — in the following order — are: Printing & Related Support Activities; Paper Products; Chemical Products; Machinery; Wood Products; Fabricated Metal Products; Computer & Electronic Products; Transportation Equipment; Electrical Equipment, Appliances & Components; and Food, Beverage & Tobacco Products.
The Wood Products sector reported a dip in:
- New orders
- Inventory Index
- Order backlogs
- Imports
A rise in:
- Customer inventories
Furniture & Related Products reported a dip in:
- Customer inventories
A rise in:
- Supplier Deliveries
- Prices
- Backlog of Orders
- New Export Orders
To read the full report, visit ismworld.org.
July 28, 2025
Mitsui TDI Plant Gas Leak
Mitsui Chemicals’ TDI Plant in Japan Experiences Chlorine Gas Leak
PUdaily | Updated: July 28, 2025
On July 27, 2025, around 6:10 p.m., residents near Hashiguchimachi, Omuta-shi, Fukuoka, Japan reported a sulfur-like smell and alerted emergency services. The source was traced to a chlorine gas leak at Mitsui Chemicals’ Omuta Plant, about 1 km east of the reported area. The plant operates a 50 ktpa TDI facility.

CHECK THE VIDEO: https://www.youtube.com/watch?v=OEt7Hf0M3eA
Previously, the plant’s TDI capacity was 120 ktpa, but it was recently reduced to 50 ktpa after maintenance. According to the plant and local fire authorities, around 40 to 42 people – both nearby residents and plant workers – were treated for symptoms like coughing and eye irritation. About five were hospitalized for observation. All remained conscious, and no serious injuries were reported.
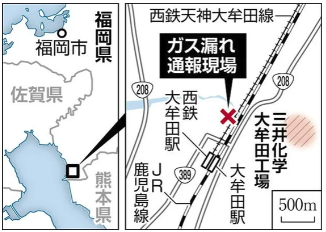
The leak occurred during plant operations. Detectors triggered an alarm at 5:40 p.m., leading to an emergency shutdown. The leak was fully contained by 7:50 p.m. The cause remains under investigation by the Omuta police.
The leak also disrupted the “Omuta Daijayama Festival”, a popular summer event that started at 5 p.m. near the site. The festival was canceled midway due to safety concerns.
Given these unpredictable dynamics, access to accurate, real-time market intelligence has become essential. PUdaily’s Pricing Intelligence Service and dedicated Asia-Pacific TDI reports help industry participants anticipate shifts, benchmark prices, and make better-informed procurement and sales decisions amid the uncertainty.
July 27, 2025
PE and You
Is Private Equity A Wolf In Sheep’s Clothing?
by Tyler Durden
Friday, Jul 25, 2025 – 03:45 PM
Authored by Lance Roberts via RealInvestmentAdvce.com,
In July 2007, just before the financial crisis erupted, Citigroup CEO Chuck Prince summed up Wall Street’s dangerous exuberance:
“When the music stops, in terms of liquidity, things will be complicated. But as long as the music is playing, you’ve got to get up and dance. We’re still dancing.”
Eighteen years later, Wall Street is dancing again, and the rhythm feels disturbingly familiar.
Private equity (PE), once a niche strategy reserved for sophisticated endowments and mega-pensions, is being aggressively marketed to everyday investors. It’s creeping into 401(k)s, target-date funds, and retirement accounts under the seductive promise of higher returns and diversification. But for investors who’ve forgotten history, or worse, were never taught it, the risks are mounting.

What Is Private Equity & How We Got Here
Private equity refers to investments in companies not publicly traded on a stock exchange. Instead of buying shares of companies like Apple or Microsoft, private equity firms purchase entire companies, or large stakes in them, using a mix of their own capital and large amounts of borrowed money (leverage).
Once they take control, they often restructure the company, cut costs, increase debt, and aim to “flip” it for a profit within a few years. This can be done by selling it to another company, a PE firm, or publicizing it via an IPO.
The pitch? Higher returns.
The reality? Higher risk and lower transparency.
PE’s ascent began after the 2008 financial crisis when near-zero interest rates pushed institutional investors out of traditional bonds and into “alternatives.” As I’ve written, institutional FOMO (fear of missing out) drove billions into private markets with questionable due diligence. So they turned to alternatives: private equity, private credit, hedge funds, and real estate.
In 2019, Ben Meng, then-CIO of CalPERS (California’s massive public pension fund), epitomized the mentality when he said, “We need private equity, we need more of it, and we need it now.”
And Wall Street delivered.
The results were predictable. With cheap credit abundant, deal volume exploded, topping $3.1 trillion globally in 2021. Valuations were detached from reality. According to McKinsey, buyout multiples surged from 6.5x EBITDA in 2009 to 12x in 2022, nearly doubling in just over a decade. But this boom was built on artificially low interest rates and easy liquidity.
That means PE firms paid twice as much for companies as a decade ago. The reason is simple: They could borrow more cheaply and charge investors higher fees.
However, with rates normalized and liquidity tightening, private equity’s structural weaknesses are surfacing. Therefore, as sophisticated investors become more risk-averse to the deals they take on, Wall Street is turning to a new source of capital: unsophisticated retail investors.
What Makes Private Equity Risky for You
Let’s break down some key concerns the average investor should understand before allocating capital—directly or indirectly—to private equity.
1. Illiquidity Is a Feature, Not a Bug
PE funds lock up investor capital for 7-10 years, sometimes longer, depending on extensions and follow-on investments. This means that investors lose the fundamental flexibility that public markets provide, namely, the ability to liquidate assets in response to life events, market downturns, or better opportunities. For example, if you invested in PE through the COVID-19 market shock, you couldn’t reallocate capital even as public markets sharply corrected and rebounded. This rigid illiquidity is especially dangerous for retirees or individuals who may require access to funds unexpectedly.
2. Opacity Masks Risk
In public markets, pricing is determined every second by the forces of supply and demand, providing price discovery and transparency. However, private equity relies on subjective valuation models that are updated quarterly or less frequently. This allows PE funds to “smooth returns,” creating the illusion of low volatility. For instance, during market sell-offs like 2022, many PE funds reported negligible markdowns while public equities fell double digits. This masks the true underlying risk, potentially misleading investors about the health of their portfolios and delaying the recognition of losses until forced asset sales or fund closures
3. Fees Are Devastatingly High
PE funds follow a “2 and 20” fee structure: a 2% annual management fee plus 20% of profits above a specific hurdle rate. Over a decade-long lock-up, even in mediocre-performing funds, fees can erode a substantial portion of gross returns. For example, on a hypothetical $100,000 investment, you could pay $20,000 in management fees over ten years, excluding performance fees. Compared to passive investment vehicles like S&P 500 ETFs costing 0.03%-0.10% annually, the fee drag in PE is enormous. Academic studies, such as those by Ludovic Phalippou at Oxford, have consistently shown that net returns after fees in PE barely exceed, and often underperform, simple public index strategies.
4. Leverage Amplifies Fragility
Leverage is a double-edged sword in private equity. While it can amplify returns in bull markets, it dramatically increases financial fragility during downturns. PE buyouts frequently involve debt levels of 5-7 times EBITDA, far exceeding leverage ratios typical of public companies. This dependence on cheap debt made sense in a zero-rate world, but is becoming a liability as borrowing costs rise. For instance, companies acquired at peak valuations in 2020-2021 face refinancing risks as interest coverage ratios deteriorate. Reports of loan covenant breaches and distressed sales are already emerging across sectors like healthcare, retail, and infrastructure, previously touted as “safe” plays in the PE world.
But while these issues are important, there are seven “red flags” that signal trouble ahead.
Seven Red Flags That Signal Trouble Ahead
The CFA Institute recently highlighted seven red flags signaling serious trouble brewing in private markets—risks magnified for retirement savers who lack the tools and resources to properly evaluate these risks. For retail investors, each of these red flags represents a significant warning that could impact long-term financial outcomes, especially when embedded within retirement plans like 401(k)s and target-date funds.
1. Declining Deal Quality
With record amounts of capital flowing into private equity, more money is chasing fewer high-quality investment opportunities. This leads to PE firms lowering their standards and investing in weaker companies or more speculative ventures. For retail investors, this means exposure to riskier businesses with less predictable cash flows. For example, during the 2021 SPAC boom, many companies that would have traditionally struggled to access public markets instead found their way into private portfolios, leading to high-profile failures post-acquisition.
The chart below from S&P Global shows the number of private transactions terminated between 2020-2023.
2. Inflated Valuations
PE managers often base valuations on future projections rather than tangible market transactions. As a result, portfolios can appear healthy on paper even when underlying fundamentals are deteriorating. For retail investors, this creates the illusion of stability, where portfolio statements show steady or appreciating values while the true market value could be significantly lower. A prime example occurred during 2022, when public tech stocks corrected sharply, but many PE tech holdings barely adjusted, delaying loss recognition and masking portfolio risk.
To that point, you should realize that most private equity investments (65%) either fail or return the initial investment at best.
Yes, private equity can be very lucrative. Depending on the deal you invest in, it can also be very harmful.
3. Fee Pressures = Riskier Deals
Institutional investors are increasingly pushing back on high fees, which puts pressure on PE firms to maintain profitability. This can lead to riskier behavior, such as over-leveraging or engaging in more aggressive cost-cutting at portfolio companies to boost short-term returns. For retail investors, this translates into an even worse alignment of interests: high fees remain in place, while portfolio risk quietly increases. Worse, retail channels often lack the negotiating power to secure fee reductions, leaving them exposed to premium costs for subpar investments.
4. Frozen Exit Markets
An essential part of private equity returns depends on the ability to sell portfolio companies at a profit. However, the current environment of rising interest rates and lower public market valuations has led to a sharp decline in IPOs and M&A activity. This creates a backlog of unsold assets, commonly referred to as an “exit overhang.” For retail investors, this means delayed distributions, longer-than-expected lock-up periods, and an increased likelihood of forced sales at discounted prices. Recent data from secondary market platforms show private equity interests trading at significant discounts, clear evidence of deteriorating liquidity.
5. Discounted Secondaries
When existing investors seek to exit PE investments early, they often turn to secondary markets. Today, these interests are commonly trading at 20-40% discounts to their stated net asset values (NAVs). This is a stark warning sign: even sophisticated investors are willing to accept steep losses to exit PE positions early. Retail investors, who often lack access to these secondary markets or the liquidity to exit early, are particularly vulnerable to being locked into declining assets with no realistic way out.
6. Rising Borrowing Costs
The foundation of many PE deals is built on cheap debt. With interest rates at multi-decade highs, borrowing costs have surged, eroding profitability across PE portfolios. Companies acquired during 2020-2021 at high multiples are now facing refinancing cliffs, where new debt comes at significantly higher rates. For retail investors, this increases the risk of portfolio companies defaulting or entering distressed restructurings, outcomes that can wipe out equity holders while still rewarding debt financiers higher in the capital structure.
7. Dry Powder FOMO
Private equity firms are sitting on record amounts of unallocated capital, or “dry powder.” While that may sound reassuring, it creates pressure to deploy capital quickly, often leading to questionable investment decisions and inflated deal pricing. For retail investors, this means being funneled into PE funds at the tail-end of a market cycle when managers are most desperate to deploy funds and least disciplined in underwriting. Historically, vintages raised during peak fundraising years, such as 2007 or 2021, have produced the worst returns.
When you see multiple red flags flashing across a sector, it’s time to reassess.
What the Average Investor Should Do
As discussed in “Why Am I So Lucky,” individuals hear tales of how high-net-worth investors (the smart money) own private equity in their allocations. As shown in the chart below from Long Angle, roughly 17% of their allocations are to private equities. These reports don’t generally tell you that their allocation to “private equity” often tends to be their personal businesses. Nonetheless, individual investors frequently see this type of analysis and think they should be replicating that process. But should they?
Before investing in private equity, significant differences must be considered between the vast majority of retail investors and high-net-worth individuals. The underlying risks of private equity investments can define these differences. However, with the right knowledge and proactive steps, investors can avoid the most common pitfalls and protect their long-term financial security.
1. Know What You Own
Start by reviewing your retirement plan allocations, especially if you are invested in a target-date fund or managed account solution. Many of these funds now include allocations to private equity or private credit, often buried deep within the prospectus. Request a detailed holdings report if necessary. For example, some widely used TDFs from major asset managers have added “private market” sleeves that investors are unaware of, effectively exposing them to higher fees and illiquidity.
2. Prioritize Liquidity
Liquidity provides optionality, especially during volatile markets or personal financial emergencies. If your retirement funds are locked up for years, you lose the ability to rebalance, take advantage of market dislocations, or fund unexpected needs. Favor investment options that allow for daily liquidity, such as low-cost index funds and ETFs. Remember, having access to your capital is a risk management tool in itself.
3. Focus on Transparency and Fees
Insist on clear, net-of-fee performance reporting. Avoid products with opaque valuation methodologies or excessive fee layers. As a rule of thumb, compare fees: if a private investment costs 2-3% annually versus 0.10% for an S&P 500 index fund, it must deliver dramatically higher returns to compensate, which few consistently achieve.
4. Stay Simple, Stay Diversified
Decades of evidence show that a well-diversified portfolio of simple, liquid public investments outperforms most complex alternatives after fees and taxes. Don’t be lured by “fancy” strategies with marketing sizzle but structural drawbacks.
Final Thoughts: Don’t Dance Just Because the Music Is Playing
Private equity may have its place in a diversified, institutional portfolio, but even then, it demands scrutiny. For the average investor, the risks are magnified by a lack of transparency, long lock-ups, and a fee structure that often benefits managers more than investors.
Wall Street has a long history of selling the newest shiny object to Main Street just as the trade begins to sour. If the music stops at this private equity party, you don’t want to be the last one still dancing.
When in doubt, stick to the core investing principles: transparency, liquidity, low costs, and discipline. Complex products are often designed to enrich the seller, not the buyer. Safeguard your financial future by keeping your portfolio simple, transparent, and aligned with your long-term goals.
https://www.zerohedge.com/markets/private-equity-wolf-sheeps-clothing
July 24, 2025
Economy Update
US Economy Expands at Fastest Pace This Year, But Factories Slide Into Contraction
The economy entered the third quarter with solid momentum, though a pullback in factory activity signals fresh challenges ahead.

Reporter
7/24/2025|Updated: 7/24/2025
0:00
4:22
The U.S. economy accelerated in July at its fastest pace so far in 2025, according to a closely watched purchasing managers’ survey released on July 24, which showed surging demand for services—even as factory activity slipped back into contraction.
S&P Global’s flash U.S. Composite PMI Output Index climbed to 54.6 from 52.9 in June, signaling the strongest overall growth in seven months and extending a 30‑month run of expansion.
The services sector led the gains, with its business activity index jumping to 55.2, hitting a seven-month high.
Factory activity faltered, however, with the manufacturing PMI dropping to 49.5 in July. This was the first reading below 50 this year, indicating a renewed downturn for the manufacturing sector, which President Donald Trump has been trying to revitalize with tariffs and other policies meant to rebuild the nation’s eroded industrial base.
The split points to an uneven recovery, with households and businesses continuing to spend on services in July, while factories reported falling new orders for the first time this year, along with leaner inventories after manufacturers rushed to build up stockpiles in May and June ahead of Trump’s anticipated tariffs.
“Growth was worryingly uneven and overly reliant on the services economy as manufacturing business conditions deteriorated for the first time this year, the latter linked to a fading boost from tariff front-running,” Chris Williamson, chief business economist at S&P Global Market Intelligence, said in a statement.
Overall, the PMI data suggests that the U.S. economy grew at a sharply faster rate at the start of the third quarter—consistent with a 2.3 percent annualized pace of growth—compared to the 1.3 percent that earlier S&P Global PMI surveys signaled for the second quarter, Williamson said.
Official government data for the second-quarter gross domestic product (GDP) is not set to be released until July 30. The most recent Philadelphia Federal Reserve survey of professional forecasters estimated a 1.4 percent pace of growth in the April to June quarter. The economy shrank by 0.5 percent in the first quarter, driven by sluggish spending and a tariff-driven spike in imports, which subtracted from GDP calculations.
The PMI report comes as other forecasts also point to firmer growth. The New York Fed’s GDP Nowcast pegs third-quarter growth at roughly 2.4 percent, which would mark a sharp rebound from the first quarter’s contraction and ease recession fears that roiled markets earlier this year following Trump’s unveiling of reciprocal tariff plans.
Meanwhile, inflationary pressures jumped in July, with the PMI survey flagging the second-sharpest increases in prices for goods and services in the past three years. Nearly two-thirds of manufacturers who reported higher input costs linked them to tariffs, while just under half of all respondents attributed increased selling prices to the administration’s trade policies.
“The rise in selling prices for goods and services in July, which was one of the largest seen over the past three years, suggests that consumer price inflation will rise further above the Federal Reserve’s 2 percent target in the coming months as these price hikes feed through to households,” Williamson predicted.
The Fed, which raised rates aggressively in 2022 and 2023 to tame inflation, cut them three times late last year and has since paused to assess the impact of Trump’s trade and fiscal policies. Federal Reserve Chair Jerome Powell told lawmakers in June that the full effects of the latest tariffs might not become clear until mid‑summer.
Business sentiment grew more cautious despite stronger headline growth. The PMI survey found confidence about the year ahead slipping to one of its lowest levels in more than two years, reflecting uncertainty over federal spending cuts and the durability of the services boom.
“Even in manufacturing, any protectionist benefits of import tariffs were often outweighed by concerns over higher prices and rising costs,” the PMI survey states.
Still, other recent data show that recession fears have subsided and that the inflation outlook has stabilized at pre-tariff levels, while June saw a marked improvement in consumer spending.
 Everchem Updates Archive
  Sign Up for Email Updates